• 概要
  • レビュー (1)
  • コメント

Momentum Trend Signal Points

5
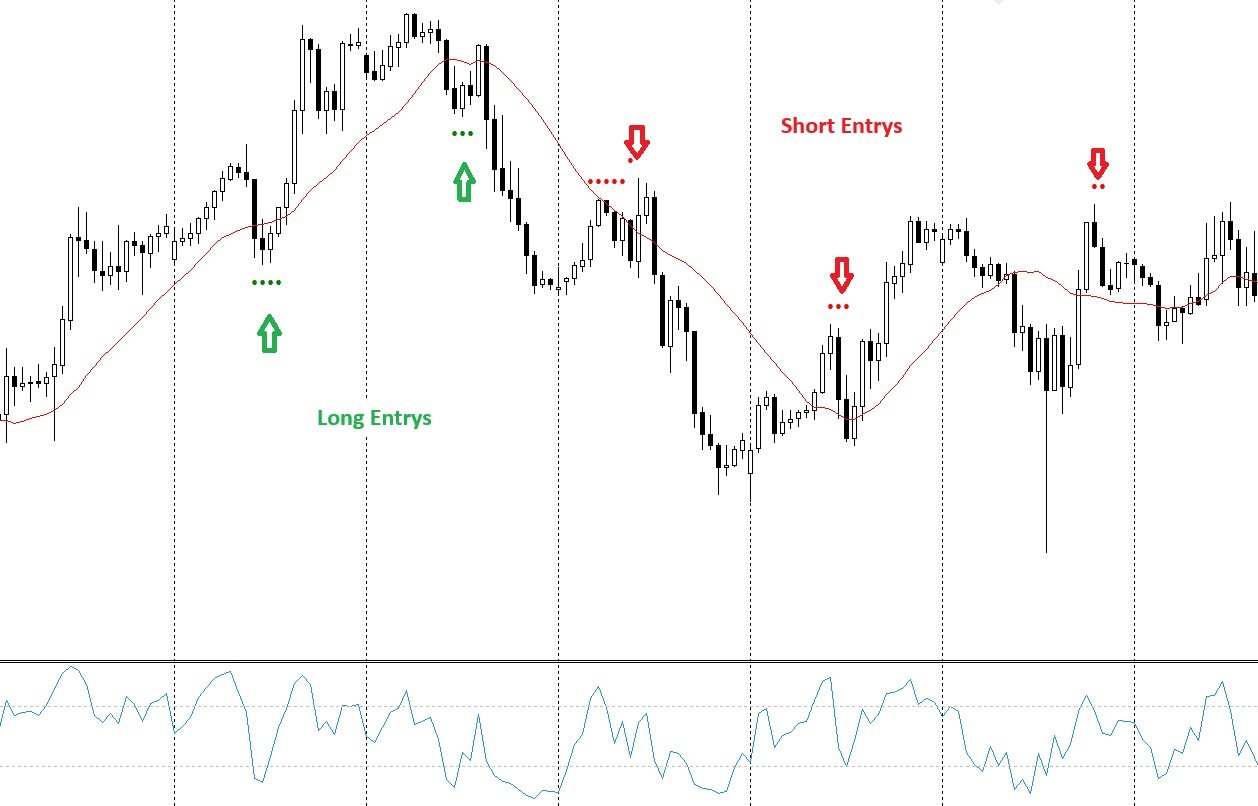
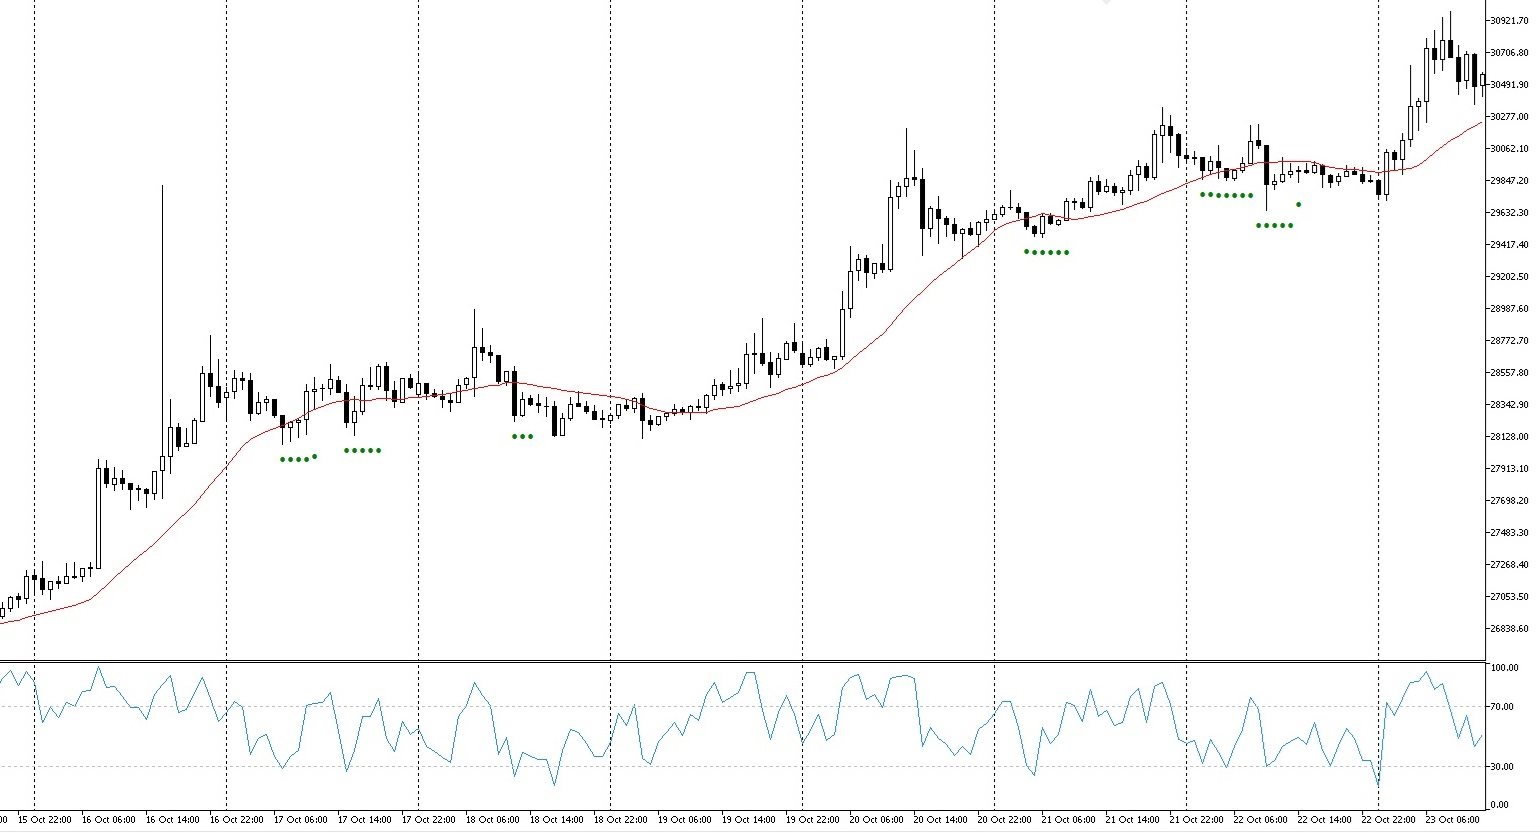
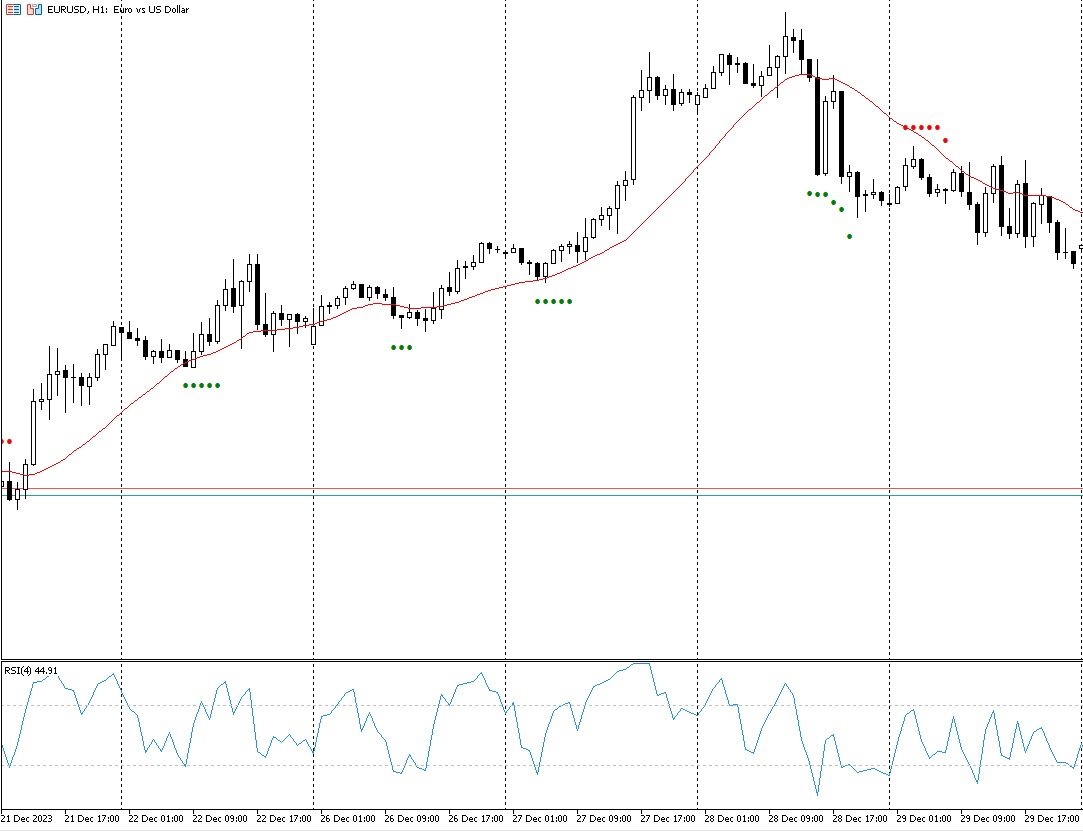
MomoPointsは、チャート上にロングとショートのエントリー/追加ポイントを表示するインジケーターです。

MomoPoints は、勢いとトレンドの強さに基づいて、リスク対報酬の比率が良好なエントリー/追加を表示します。

設定

----------------------------------
デザイン: 信号の色、サイズ、ウィングディング (グラフィック シンボル) を調整できます。

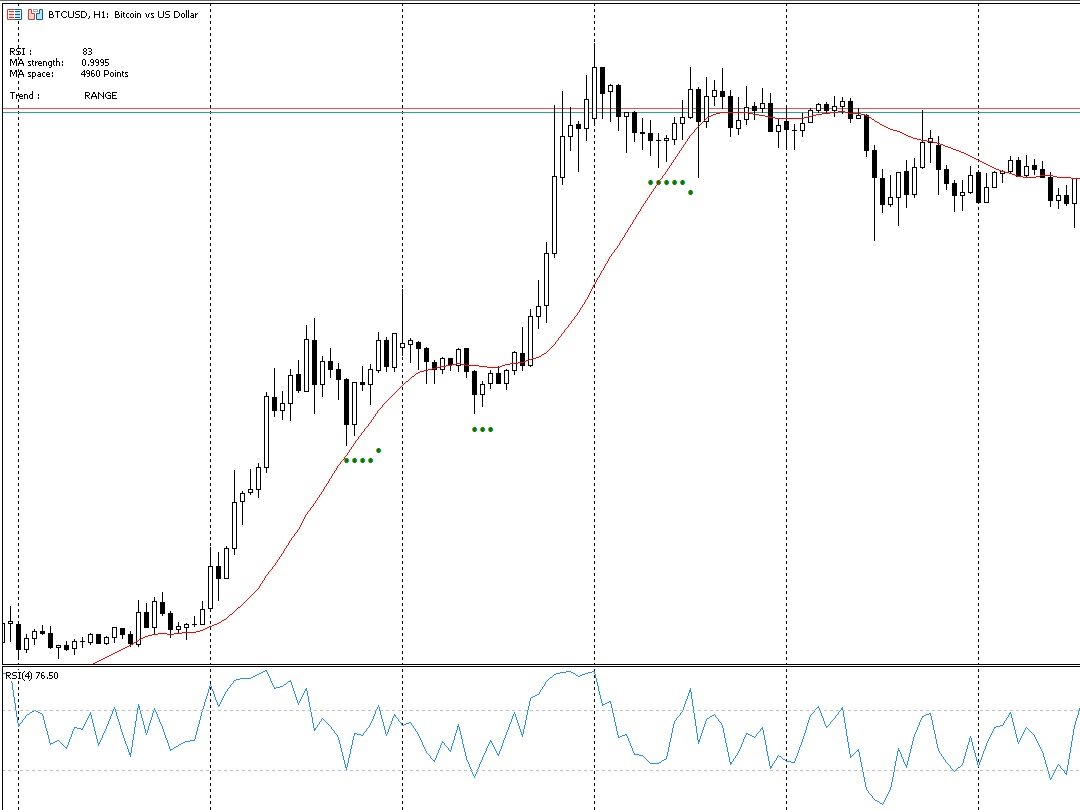
シグナル設定: 移動平均期間、トレンドの強さ、移動平均から価格までの距離、RSI期間を設定できます。

信号値をコメントとして表示して、資産に正しい値を設定できます。また、インジケーターはあらゆる取引ペアまたは資産に適合します。

適切なエントリを表示するには、すべてのアセットに独自の設定が必要です。特定のペアの設定が必要で、自分でそれを見つけることができない場合は、私がお手伝いします。


アラーム:プッシュ通知とサウンド音声アラートを有効にすることができます。


シグナルはリアルタイムで発生し、再描画は必要ありません

ご質問や追加情報や機能のご要望がございましたら、いつでもお問い合わせください。
レビュー 1
James Erasmus
1053
James Erasmus 2024.07.09 10:03 
 

Nice work on concept and indi. Some issues with like one dot, does one enter trade. Very cool that one can change the entry symbol! Some good entries some not, so it needs confirmation and some strategy, great free indi.

おすすめのプロダクト
The indicator is based on Robert Miner's methodology described in his book "High probability trading strategies" and displays signals along with momentum of 2 timeframes. A Stochastic oscillator is used as a momentum indicator. The settings speak for themselves period_1 is the current timeframe, 'current' period_2 is indicated - the senior timeframe is 4 or 5 times larger than the current one. For example, if the current one is 5 minutes, then the older one will be 20 minutes The rest of the
FREE
Follow The Line MT5
Oliver Gideon Amofa Appiah
4.42 (31)
This indicator obeys the popular maxim that: "THE TREND IS YOUR FRIEND" It paints a GREEN line for BUY and also paints a RED line for SELL. (you can change the colors). It gives alarms and alerts of all kinds. IT DOES NOT REPAINT and can be used for all currency pairs and timeframes. Yes, as easy and simple as that. Even a newbie can use it to make great and reliable trades. NB: For best results, get my other premium indicators for more powerful and reliable signals. Get them here: https://www.m
FREE
Trend Master Chart MT5
Frederic Jacques Collomb
5 (2)
Trend Master Chart、必要なトレンド指標です。 チャートをオーバーレイし、色分けを使用してさまざまな市場のトレンド/動きを定義します。 2 つの移動平均と異なるオシレーターを組み合わせたアルゴリズムを使用します。 これら 3 つの要素の周期は変更可能です。 どの時間枠やペアでも機能します。 上昇トレンドまたは下降トレンド、およびこのトレンドへのさまざまなエントリーポイントを一目で識別できます。 たとえば、顕著な上昇トレンド (薄緑色) では、このトレンド内のさまざまな市場インパルスが濃い緑色のローソク足で表示されます。 設定可能なアラートを使用すると、これらの衝動を決して見逃すことがなくなります。 MT4のバージョンです。 入力パラメータ: Period 1: 高速期間移動平均。 Period 2: 低速期間の移動平均。 Oscillator period: オシレーター周期。 Sell/Buy alert: 市場衝動アラート、トレンドエントリーポイント。 Bullish/Bearish alert: トレンドが
FREE
Free automatic Fibonacci is an indicator that automatically plots a Fibonacci retracement based on the number of bars you select on the BarsToScan setting in the indicator. The Fibonacci is automatically updated in real time as new highest and lowest values appears amongst the selected bars. You can select which level values to be displayed in the indicator settings. You can also select the color of the levels thus enabling the trader to be able to attach the indicator several times with differe
FREE
What is this indicator? このインジケーターはMT5のFX検証ソフト「 Knots Compositor 」の 全てのチャートモードに対応したMACD です。 どのチャートモードでも、 チャートに表示されているローソク足で計算して表示します 。 Types of the applied price - Close - Open - High - Low - Median Price (HL/2) - Typical Price (HLC/3) - Weighted Price (HLCC/4) KC-Indicators -   KC-MA   (移動平均線) -   KC-ENV   (エンベロープ) -   KC-BB   (ボリンジャーバンド) -   KC-ADX   (Average Directional Movement Index) -   KC-MACD   (Moving Average Convergence/Divergence) -   KC-RSI   (Relative Strength Index) -   KC-S
FREE
Forex Indicator Arrows is an arrow Indicator used as an assistant tool for your trading strategy. The indicator analyzes the standard deviation of bar close for a given period and generates a buy or sell signals if the deviation increases. It good to combo with Martingale EA to follow Trend and Sellect Buy Only/Sell Only for EA work Semi-Automatic. You can use this  Indicator with any EAs in my Products.
FREE
Tired of plotting trendlines? The PZ TrendLines MT5 indicator applies a mechanical approach to the construction of trend lines for you!  [ Installation Guide | Update Guide | Troubleshooting | FAQ | All Products ] It can draw up to 18 trendlines Trendlines can be optionally based on fractals Each line represents a breakout level Each trendline can be broken or rejected Configurable amount of lines Configurable colors Support I am happy to provide free products but given my limited time, they com
FREE
Cybertrade Keltner Channels - MT5 Created by Chester Keltner, this is a volatility indicator used by technical analysis. It is possible to follow the trend of financial asset prices and generate support and resistance patterns. In addition, envelopes are a way of tracking volatility in order to identify opportunities to buy and sell these assets. It works on periods longer than the period visible on the chart. All values ​​are available in the form of buffers to simplify possible automations.
FREE
Signal provider based on RSI Divergences from a higher timeframe. First 3 buffers export a signal. Timeframe for which divergences are detected is optional, see 'RSI divergences timeframe' parameter. The indicator uses different algorithms for divergences detection: 'Fast' algorithm is the simplest solution that works the fastest. 'Strict' algorithm filters out more noise but works slower than the previous one. 'Full' algorithm uses recursive functions and provides with lots of d
FREE
Value Chart Candlesticks
Flavio Javier Jarabeck
4.7 (10)
The idea of a Value Chart indicator was presented in the very good book I read back in 2020 , " Dynamic Trading Indicators: Winning with Value Charts and Price Action Profile ", from the authors Mark Helweg and David Stendahl. The idea is simple and the result is pure genius: Present candlestick Price analysis in a detrended way! HOW TO READ THIS INDICATOR Look for Overbought and Oversold levels. Of course, you will need to test the settings a lot to find the "correct" one for your approach.
FREE
平均足(ヘイキンアシ)MT5インジケーター 平均足(ヘイキンアシ)MT5インジケーターは、標準的な価格データをより滑らかでトレンドに沿ったローソク足に変換し、市場トレンドや潜在的な反転ポイントをより簡単に識別できるようにする強力なツールです。 主な特徴: 明確なトレンド識別: 異なるローソク足の色で上昇トレンドと下降トレンドを視覚的に区別します。 ノイズの低減: 価格変動をフィルタリングし、 市場の主要な動きをより明確に表示します。 早期トレンド検出: 標準チャートでトレンドの変化が明らかになる前に、 潜在的なトレンド変化を予測します。 汎用性: 単独で使用することも、 他のテクニカル指標と組み合わせて総合的な分析を行うこともできます。 カスタマイズ可能な設定: インジケーターを特定の取引設定や戦略に合わせて調整できます。 メリット: トレンドを特定し、 潜在的なエントリーポイントと出口ポイントを識別する能力を向上させます。 市場ノイズの影響を減らし、 重要な価格変動に集中します。 市場ダイナミクスをより明確に理解することで、 より情報に基づいた取引決定を行うことができます。 検証済
FREE
Peak Trough Analysis is the great tool to detect peaks and troughs in your chart. Peak Trough Analysis tool can use three different peaks and troughs detection algorithm. The three algorithm include the orignal Fractals Indicator by Bill Williams, the Modified Fractals indicator and ZigZag indicator. You can use this peak and trough analysis tool to detect the price pattern made up from Equilibrium Fractal-Wave process. For further usage, there are good guide line on how to use this peak trough
FREE
Tops & Bottoms Indicator FREE   Tops abd Bottoms:   An effective indicator for your trades The tops and bottoms indicator helps you to find  ascending and descending channel formations with indications of ascending and/or descending tops and bottoms. In addition, it  show possibles  opportunities with a small yellow circle when the indicator encounters an impulse formation. This indicator provide to you  more security and speed in making entry decisions. Also test our FREE advisor indicator:
FREE
Are you tired of drawing trendlines every time you're analyzing charts? Or perhaps you would like more consistency in your technical analysis. Then this is for you. This indicator will draw trend lines automatically when dropped on a chart. How it works Works similar to standard deviation channel found on mt4 and mt5. It has 2 parameters: 1. Starting Bar 2. Number of bars for calculation The   starting bar   is the bar which drawing of the trend lines will begin, while the   number of bars for c
FREE
Bounce Zone MT5
Nguyen Thanh Cong
4.14 (7)
Introduction The Bounce Zone indicator is a cutting-edge non-repainting technical tool built to identify key areas on the price chart where market sentiment is likely to cause a significant price reversal. Using advanced algorithms and historical price data analysis, this indicator pinpoints potential bounce zones. Combined with other entry signal, this indicator can help forex traders place the best trades possible Signal A possible buy signal is generated when price is in the green zo
FREE
This is a free version of the indicator, the period between the vertical lines is always 30 bars. In the paid version the period can be set by user, so a configuration with many ThreePointsChannel indicators with different periods is possible. The principle of construction - on top of any number of bars set by the user, a channel is constructed with maximum and minimum lines so that the bars touch the maximum and minimum of the channel at exactly three points. The name of the indicator follows
FREE
This indicator is a zero-lag indicator and displays  strength of trend change . True Trend  Oscillator Pro works best in combination with True Trend Moving Average Pro that displays exact trend as is. Oscillator value is exact price change in given direction of the trend. True Trend Moving Average Pro: https://www.mql5.com/en/market/product/103586 If you set PERIOD input parameter to 1 this indicator becomes a sharpshooter for binary options. Developers can use True Trend Oscillator in E
FREE
Introduction Reversal Candles is a cutting-edge non-repainting   forex indicator designed to predict price reversals with remarkable accuracy through a sophisticated combination of signals. Signal Buy when the last closed candle has a darker color (customizable) and an up arrow is painted below it Sell when the last closed candle has a darker color (customizable) and a down arrow is painted above it
FREE
The indicator identifies when a divergence occurs between price and an indicator or oscillator. It identifies both regular and hidden divergences. Combined with your own rules and techniques, this indicator will allow you to create (or enhance) your own powerful system. Features Can detect divergences for the following oscillators/indicators:   MACD, OsMA, Stochastics, RSI, CCI, RVI, Awesome, ADX, ATR, OBV, Composite index, MFI and Momentum. Only one oscillator/indicator can be selected. Draws
FREE
About the indicator: DALA Forecast is a universal tool for predicting the dynamics of time series of any nature. For prediction, modified methods of nonlinear dynamics analysis are used, on the basis of which a predictive model is built using machine learning methods.  To get the trial version of the indicator, you can contact me in private messages. How to use the indicator: Apply the indicator to your chosen financial instrument or indicator with the settings you need. The prediction will b
FREE
This indicator displays pivot points in the chart, including historical vales, and supports many calculation modes for Pivot Points and S/R levels. [ Installation Guide | Update Guide | Troubleshooting | FAQ | All Products ] It plots historical levels for backtesting purposes It allows you to select the reference timeframe It implements different Pivot Point calculation modes It implements different SR calculation modes It implements customizable colors and sizes Calculation Modes The indi
FREE
SUPERTREND; It is a trend following indicator based on the SuperTrend ATR created by Olivier Seban. It can be used to detect changes in trend direction and locate stops. When the price falls below the indicator curve, it turns red and indicates a downtrend. Conversely, when the price moves above the curve, the indicator turns green, indicating an uptrend. Like other indicators, it works well on SuperTrend when used in conjunction with other indicators such as MACD, parabolik SAR, Bollinger Band
FREE
Necessary for traders: tools and indicators Waves automatically calculate indicators, channel trend trading Perfect trend-wave automatic calculation channel calculation , MT4 Perfect trend-wave automatic calculation channel calculation , MT5 Local Trading copying Easy And Fast Copy , MT4 Easy And Fast Copy , MT5 Local Trading copying For DEMO Easy And Fast Copy , MT4 DEMO Easy And Fast Copy , MT5 DEMO The homeopathic indicator is also called the CCI indicator. The CCI indicator was propos
FREE
RSI with alerts BDA
Laron Demetris Burrows
4.4 (20)
このアルゴリズムは、86%*の精度で価格の短期的な変化を予測します。 ATRによって決定されるように大きな動きがある場合,買われ過ぎや売られ過ぎの状態の間に,インジケータはあなたに警告します. 価格が信号キャンドルよりも高いか低いかを予測します。 より大きな時間枠で平均復帰取引、バイナリオプションや先物契約のための完璧な。 この指標は5年間のデータに基づいてバックテストされ、時間の経過とともに価格の逆転を予測するための90%の精度を持っています。 特徴: 簡単なセットアップ 任意のグラフにドラッグアンドドロップ お好みに合わせてパラメータを調整(オプション) アラートを有効にする(オプション) そして、あなたは完了です! 視覚的および音声的な警告 お使いの携帯電話に直接送信されるアラート 端末に送信されるポップアップ警告 高いwinrate 取引の最大90%を獲得 バックテストされた5年と複数の通貨。 (バックテストの詳細と分析については、ウェブサイトを参照してください)。 多数の信号 シンボル*ごとに1日に2つの信号を期待しています。 *これは30分の蝋燭の表示器があればあ
FREE
Dual RSI
Paul Conrad Carlson
Indicator alerts for Dual Relative strength index rsi. Large rsi preset at 14 is below 30 small rsi preset at 4 is below 10 for buy bullish signals . Large rsi preset are 14 is above 70 small rsi preset at 4 is above 90 for sell bearish signals . Includes mobile and terminal alerts. draws lines when alerts. This indicator can help identify extremes and then the tops or bottoms of those extremes .
FREE
Donchian Channel is an indicator created by Richard Donchian. It is formed by taking the highest high and the lowest low of the last specified period in candles. The area between high and low is the channel for the chosen period. Its configuration is simple. It is possible to have the average between the upper and lower lines, plus you have alerts when price hits one side. If you have any questions or find any bugs, please contact me. Enjoy!
FREE
This indicator analyzes price action patterns and helps you to make positive equity decisions in the binary options market. [ Installation Guide | Update Guide | Troubleshooting | FAQ | All Products ] Easy to trade Trade both call and put options No crystal ball and no predictions The indicator is non-repainting The only strategy suitable for binary options is applying a mathematical approach, like professional gamblers do. It is based on the following principles: Every binary option represents
FREE
Donchian Channel DC is the indicator of Donchian Channels, that plots maximum and minimum values of a specific period, besides mean value line. It´s possible to configure simple period for analysis and the indicator will plot all three values. You can trade with this indicator as trend or reversal, according to each strategy. Do not let to test others indicators as soon as others expert advisors.
This indicator is an automated version of the Fibonacci retracement (Fib) indicator. Deciding the best areas to use when drawing the fib can be tricky and this  indicator was made with that in mind. When you drop it on the chart it will automatically choose the best points to draw the fib with, but in case you aren't satisfied with those regions, you can adjust it as you wish.
FREE
供給と需要のオーダーブロック: 「供給と需要のオーダーブロック」インジケーターは、外国為替のテクニカル分析において重要なスマートマネーの概念に基づいた洗練されたツールです。このツールは供給と需要ゾーンを特定し、機関投資家が重要な足跡を残す重要な領域に焦点を当てています。売り注文を示す供給ゾーンと買い注文を示す需要ゾーンは、トレーダーが価格の逆転や減速を予測するのに役立ちます。このインジケーターは、ブレイクアウト・オブ・ストラクチャー(BoS)およびフェアバリューギャップ(FVG)のコンポーネントを組み合わせた賢明なアルゴリズムを採用しています。BoSは市場の混乱を検出し、潜在的なオーダーブロックを特定し、FVGは精度を向上させるためにフェアバリューギャップを考慮しています。このツールはこれらの条件の視覚的表現を提供し、潜在的なオーダーブロックを強調し、市場のダイナミクスや転換点に関する洞察を提供することで、トレーダーの意思決定を支援します。使いやすいデザインは、さまざまな技術的な専門知識レベルのトレーダーにアクセスしやすく、高度な分析の包括的なソリューションを提供します。 特
FREE
このプロダクトを購入した人は以下も購入しています
まず第一に、この取引インジケーターは再描画されず、再描画されず、遅延しないことを強調する価値があります。これにより、手動取引とロボット取引の両方に理想的なものになります。 ユーザーマニュアル:設定、入力、戦略。 アトミックアナリストは、価格の強さとモメンタムを利用して市場でより良いエッジを見つけるためのPA価格アクションインジケーターです。ノイズや誤ったシグナルを除去し、取引ポテンシャルを高めるための高度なフィルターを備えています。複雑なインジケーターの複数のレイヤーを使用して、アトミックアナリストはチャートをスキャンし、複雑な数学的計算をシンプルなシグナルと色に変換します。これにより、どのような初心者トレーダーでも理解して使用し、一貫した取引の決定を行うことができます。 「アトミックアナリスト」は、新規および経験豊富なトレーダー向けにカスタマイズされた包括的な取引ソリューションです。プレミアムインジケーターとトップノッチの機能を1つの取引戦略に組み合わせ、すべてのタイプのトレーダーにとって汎用性のある選択肢にします。 デイリートレーディングとスキャルピング戦略:高速で正確な
Atbot
Zaha Feiz
4.96 (28)
AtBot: どのように機能し、どのように使用するか ### どのように機能するか MT5プラットフォーム用の「AtBot」インジケーターは、テクニカル分析ツールの組み合わせを使用して売買シグナルを生成します。単純移動平均(SMA)、指数移動平均(EMA)、および平均真実範囲(ATR)インデックスを統合して取引機会を特定します。さらに、Heikin Ashiキャンドルを使用してシグナルの精度を向上させることもできます。 購入後にレビューを残すと、特別なボーナスギフトを受け取ります。 ### 主な機能: - 再描画なし: シグナルはプロット後に変更されません。 - 再描画なし: シグナルは一貫しており、変更されません。 - 遅延なし: 遅延なくタイムリーなシグナルを提供します。 - 多様な時間枠: あらゆる時間枠で使用可能で、取引戦略に合わせることができます。 ### 操作手順: #### 入力と設定: - firstkey (TrendValue): トレンド検出の感度を調整します。 - Secondkey (SignalValue): 売買シグナル生成の感度を定義します。 - ma
まず第一に、このトレーディングシステムがノンリペイント、ノンリドロー、ノンラグのインジケーターであることを強調する価値がある。これにより、手動取引とロボット取引の両方に理想的なものになっています。 オンラインコース、マニュアル、プリセットのダウンロード。 「スマートトレンドトレーディングシステム MT5」は、新規および経験豊富なトレーダー向けにカスタマイズされた包括的なトレーディングソリューションです。10以上のプレミアムインジケーターを組み合わせ、7つ以上の堅実なトレーディング戦略を備えており、多様な市場状況に対応する多目的な選択肢となっています。 トレンドフォロー戦略:トレンドを効果的に乗り越えるための正確なエントリーとストップロス管理を提供します。 リバーサル戦略:潜在的なトレンドの反転を特定し、トレーダーがレンジ相場を活用できるようにします。 スキャルピング戦略:高速で正確なデイトレードおよび短期取引のために設計されています。 安定性:すべてのインジケーターはノンリペイント、ノンリドロー、ノンラグであり、信頼性の高いシグナルを保証します。 カスタマイズ:個々の取引の嗜好に合わせ
Gold Stuff mt5
Vasiliy Strukov
4.9 (185)
Gold Stuff mt5 は、金専用に設計されたトレンド指標であり、あらゆる金融商品にも使用できます。 インジケーターは再描画せず、遅れません。 推奨時間枠 H1. 設定と個人的なボーナスを得るために、購入後すぐに私に連絡してください!  トレンド スキャナーの強力なサポートを利用して、無料のインジケーターを入手し、プライバシーを守ります。あーみー!   設定 矢印を描く - オンオフ。 チャートに矢印を描く。 アラート - 可聴アラートのオンオフ。 メール通知 - オンオフ。 電子メール通知。 プチ通知 - オンオフ。 プッシュ通知。 次に、色域を調整します。 Gold Stuff mt5 は、金専用に設計されたトレンド指標であり、あらゆる金融商品にも使用できます。 インジケーターは再描画せず、遅れません。 推奨時間枠 H1. 設定と個人的なボーナスを得るために、購入後すぐに私に連絡してください!   設定 矢印を描く - オンオフ。 チャートに矢印を描く。 アラート - 可聴アラートのオンオフ。 メール通知 - オンオフ。 電子メール通知。 プチ通
TPSpro TREND PRO は 、市場を自動的に分析し、トレンドとその各変化に関する情報を提供し、再描画せずに取引にエントリーするためのシグナルを提供するトレンド指標です。 インジケーターは各ローソク足を使用し、個別に分析します。上向きまたは下向きのさまざまな衝撃を指します。通貨、仮想通貨、金属、株、指数の取引への正確なエントリーポイント! バージョンMT5                   インジケーターの完全な説明     RFI LEVELS インジケーター と併用することをお勧めします。 主な機能: レンダリングなしで正確な入力信号! シグナルが表示されると、それは関連性を維持します。これは、シグナルを提供してからそれを変更し、その結果、入金された資金が失われる可能性があるリドローインジケーターとの重要な違いです。より高い確率と精度で市場に参入できるようになりました。矢印が表示された後、ターゲットに到達する (利益確定) か反転シグナルが表示されるまで、ローソク足に色を付ける機能もあります。 STOP-LOSS/TAKE-PROFITゾーンの表示 エントリーポイン
最初のパルスレベルを反転 (RFI)     指示する     ロシア     -        utilizar con   el indicador の ESP 推奨事項 -   TPSpro トレンド プロフェッショナル版 -   MT5のバージョン 最も重要なことは、将来においても最も重要なことです。 機能のプリンシパル: ゾーンのほとんどは、ベンダーとコンプラドールによってアクティブ化されます。 状況を直感的に把握できるよう、初期の衝動を修正します。 LOGIC AI: MUESTRA zonas (círculos) parabuscar puntos de entrada cuando se activa una plantilla 視覚的に優れた視覚効果があり、最も重要な機能がすべて揃っていることに注意してください。 優れたニベレス/ゾーンの視覚化 (modo MTF) 世界で最も人気のある場所/ゾーンです。これを使用するのに最適な方法です (   TPSproTREND PRO   )。 アルゴリズム プロフェッショナル セパラド パソ ア パソ パラ オペラ それは
これはMT5のインジケーターで、再描画なしで取引に参入するための正確なシグナルを提供します。 外国為替、暗号通貨、金属、株式、インデックスなど、あらゆる金融資産に適用できます。かなり正確な見積もりを提供し、取引を開始して終了するのに最適な時期を教えてくれます。1つのシグナルを処理しただけでインジケーターの元が取れた例の 動画 (6:22)をご覧ください。Entry PointsPro インジケーターの助けを借りたほとんどのトレーダーの最初の1週間の結果が改善しています。 Telegramグループ に登録してください。Entry Points Proインジケーターのメリットは次の通りです。 再描画のないエントリーシグナル 再描画されるインジケーターでは一度表示されたシグナルが削除されて大きな金銭的損失につながることがありますが、これと異なり、表示されて確認されたシグナルは消えることがありません。 エラーなしの取引開始 インジケーターアルゴリズムによって取引を開始する(資産を売買する)理想的な瞬間を見つけることができます。それを使用するすべてのトレーダーの成功率が向上します。
まず第一に、この取引ツールはノンリペイント、ノンリドロー、ノンラグの指標であり、プロの取引に理想的ですことを強調する価値があります。 オンラインコース、ユーザーマニュアル、デモ。 スマートプライスアクションコンセプトインジケーターは、新米から経験豊富なトレーダーまで、非常 に強力なツールです。Inner Circle Trader AnalysisやSmart Money Concepts Trading Strategiesなど、20以上の有用な指標を1つに組み合わせています。このインジケーターはスマートマネーコンセプトに焦点を当て、大手機関の取引方法を提供し、彼らの動きを予測するのに役立ちます。 特に、流動性分析に優れており、機関がどのように取引しているかを理解しやすくしています。市場のトレンドを予測し、価格の動きを慎重に分析するのに優れています。機関の戦略とトレードを合わせることで、市場の動向についてより正確な予測ができます。このインジケーターは多目的であり、市場構造を分析し、重要な注文ブロックを特定し、さまざまなパターンを認識するのに優れています。 このインジ
Quantum Trend Sniper
Bogdan Ion Puscasu
4.92 (48)
ご紹介   クォンタム トレンド スナイパー インジケーターは 、トレンド反転を特定して取引する方法を変革する画期的な MQL5 インジケーターです。 13年以上の取引経験を持つ経験豊富なトレーダーのチームによって開発されました。     クォンタムトレンドスナイパーインジケーター   は、非常に高い精度でトレンドの反転を識別する革新的な方法で、あなたのトレーディングの旅を新たな高みに押し上げるように設計されています。 ***Quantum Trend Sniper Indicatorを購入すると、Quantum Breakout Indicatorを無料で入手できます!*** クォンタム ブレイクアウト インジケーターは、トレンドの反転を特定するとアラートを発し、矢印を示し、3 つのテイクプロフィットレベルを提案します。 初心者トレーダーにもプロのトレーダーにも適しています。 量子EAチャネル:       ここをクリック MT4のバージョン:       ここをクリック 推奨事項: 期間:すべての時間枠。最良の結果を得るには、M
トレンド スクリーナー インジケーターでトレンド取引の力を解き放ちます。ファジー ロジックと複数通貨システムを活用した究極のトレンド取引ソリューションです。 ファジー ロジックを活用した革新的なトレンド インジケーターである Trend Screener を使用して、トレンド取引を向上させます。 これは、13 を超えるプレミアム ツールと機能、および 3 つの取引戦略を組み合わせた強力なトレンド追跡インジケーターであり、Metatrader をトレンド アナライザーにする多用途の選択肢となります。 期間限定オファー : トレンド スクリーナー インジケーターは、わずか 50 ドルで生涯ご利用いただけます。 (元の価格 125$ ) (オファー延長) Trend Screener の 100% 非再描画精度の揺るぎない精度を体験して、取引の決定が過去の価格変動の影響を受けないようにしてください。 マルチタイムフレームおよびマルチ通貨機能の多用途性を解放し、比類のない自信を持って外国為替、商品、暗号通貨、インデックスの世界を取引できるようにします。 Trend Screener の包括的な
mql5と Telegramの モーニング・ブリーフィングで、詳細とスクリーンショットを含む毎日のマーケット・アップデートをご覧 ください! FX Power MT5 NGは 、長年の人気を誇る通貨強度計FX Powerの次世代モデルです。 この次世代ストレングスメーターは何を提供するのでしょうか?初代FXパワーの魅力すべて プラス GOLD/XAUの強さ分析 より正確な計算結果 個別に設定可能な分析期間 カスタマイズ可能な計算上限値により、さらに優れたパフォーマンスを実現 もっと見たい人のための特別なマルチインスタンス設定 すべてのチャートでお好みの色を無限に設定可能 数え切れないほどの通知オプションにより、重要なことを見逃すことはありません。 Windows 11とmacOSのスタイルで角を丸くした新しいデザイン 魔法のように動くインジケーターパネル FXパワーの主な機能 すべての主要通貨の強さの完全な履歴 すべての時間枠における通貨の強さの履歴 すべてのブローカーとチャートで同一の計算結果 100%信頼できるリアルタイム計算 -> リペイントなし ドロップダウン・リストから
FX Volume MT5
Daniel Stein
4.94 (17)
mql5と Telegramの モーニング・ブリーフィングで、詳細とスクリーンショットを含む毎日のマーケット・アップデートをご覧 ください! FX Volumeは、ブローカーの視点から市場のセンチメントをリアルに洞察する、最初で唯一の出来高インジケーターです。 ブローカーのような機関投資家が外国為替市場でどのようなポジションをとっているか、COTレポートよりもはるかに速く、素晴らしい洞察を提供します。 この情報をチャート上で直接見ることは、あなたの取引にとって真のゲームチェンジャーであり、画期的なソリューションです。 以下のようなユニークなマーケットデータ洞察から利益を得てください。 比率は 、通貨のロングポジションとショートポジションの比率をパーセントで表示します。 比率の変化は 、選択した期間内のロング比率とその変化率を表示します。 Volumes Totalは 、通貨の取引量(ロングとショート)の合計をロット単位で表示します。 Volumes Long :全通貨のロングポジションの取引量を表示します。 Volumes(ショート )は、全通貨のショートポジションの取引量を表示
IX Powerは 、FX Powerの無敵の精度をついにFX以外のシンボルにも提供します。 お気に入りの指数、株式、コモディティ、ETF、さらには暗号通貨の短期、中期、長期のトレンドの強さを正確に判断します。 お使いの端末が提供する すべてを分析する ことができます。ぜひお試しいただき、取引 タイミングが大幅に改善 されることをご体験ください。 IXパワーの主な特徴 100%正確で再描画されない計算結果 - ターミナルで利用可能なすべての取引シンボルに対して 予め設定され、さらに個別に設定可能な強度分析期間のドロップダウン選択 Eメール、メッセージ、モバイル通知による無数の通知オプション EAリクエストのためのアクセス可能なバッファ カスタマイズ可能な計算制限により、さらに優れたパフォーマンスを実現 もっと見たい人のための特別なマルチインスタンス設定 すべてのチャートでお好みの色を無限に設定可能 Windows 11とmacOSのスタイルで角を丸くした新しいパネルデザイン サブ・ウィンドウとメイン・チャートの間をシームレスに移動する、魔法のように動くイン
Step into the realm of Forex trading with confidence and precision using XQ, a cutting-edge Forex indicator designed to elevate your trading game to unprecedented heights. Whether you're a seasoned trader or just stepping into the world of currency exchange, XQ Forex Indicator empowers you with the insights and signals needed to make informed trading decisions. The signal conditions are a combination of three indicators, and XQ Forex Indicator only display  medium and long-term trends . The ind
Easy By Sell is a market indicator for opening and closing positions. It becomes easy to track market entries with alerts. It indicates trend reversal points when a price reaches extreme values ​​and the most favorable time to enter the market. it is as effective as a Fibonacci to find a level but it uses different tools such as an algorithm based on ATR indicators and Stochastic Oscillator. You can modify these two parameters as you wish to adapt the settings to the desired period. My othe
このダッシュボードは、選択されたシンボルの最新の利用可能なハーモニックパターンを表示するので、時間を節約し、より効率的に /   MT4バージョン 。 無料インジケーター:   Basic Harmonic Pattern インジケーター列 Symbol : 選択したシンボルが表示されます。 Trend :   強気または弱気 Pattern : パターンの種類(ガートレー、バタフライ、バット、カニ、サメ、サイファー、ABCD) Entry : エントリー価格 SL: ストップロス価格 TP1: 1回目の利食い価格 TP2: 2回目の利食い価格 TP3:   3回目の利食い価格 Current price :   現在値 Age (in bars):    最後に描画されたパターンの年齢 主な入力項目 Symbols:   "28 Major Currency Pairs "または "Selected Symbols "から選択。 Selected Symbols:   カンマで区切られた監視したいシンボル("EURUSD,GBPUSD,XAUUSD")。ブローカーが
note: this indicator is for METATRADER4, if you want the version for METATRADER5 this is the link:  https://www.mql5.com/it/market/product/108106 TRENDMAESTRO ver 2.4 TRENDMAESTRO recognizes a new TREND in the bud, he never makes mistakes. The certainty of identifying a new TREND is priceless. DESCRIPTION TRENDMAESTRO identifies a new TREND in the bud, this indicator examines the volatility, volumes and momentum to identify the moment in which there is an explosion of one or more of these data a
Golden Spikes Detector Overview: The Golden Spikes Premium is a groundbreaking trading indicator meticulously crafted for the Boom and Crash indices on the Deriv market. Tailored to meet the needs of discerning traders, this powerful tool operates exclusively on the one-minute timeframe, providing timely and precise signals to maximize your trading potential. The Golden Spikes Detector stands out in its ability to deliver accurate signals, ensuring that you capitalize on market opportunities wit
Gartley Hunter Multi - An indicator for searching for harmonic patterns simultaneously on dozens of trading instruments and on all possible timeframes. Manual (Be sure to read before purchasing) | Version for MT4 Advantages 1. Patterns: Gartley, Butterfly, Shark, Crab. Bat, Alternate Bat, Deep Crab, Cypher 2. Simultaneous search for patterns on dozens of trading instruments and on all possible timeframes 3. Search for patterns of all possible sizes. From the smallest to the largest 4. A
サポート線と抵抗線のプロットにうんざりしていませんか? サポートレジスタンス は、非常に興味深いひねりを加えてチャート内のサポートとレジスタンスラインを自動検出およびプロットするマルチタイムフレームインジケーターです。価格レベルは時間とともにテストされ、その重要性が高まるにつれて、ラインは太くなり、暗くなります。 [ インストールガイド | 更新ガイド | トラブルシューティング | よくある質問 | すべての製品 ] 一晩でテクニカル分析を強化 チャートを閲覧せずに重要な価格レベルを検出 一目ですべての価格レベルの相対的な強さを認識する すべての取引で最大30時間のプロットラインを節約 インジケーターは、すべての価格レベルの年齢を表示します インジケーターは再描画されていません 過去および現在の価格レベルは近接によって崩壊し、現在の市場行動に合わせて調整されます。動作は、必ずしもピークではない場所に線が引かれます。 価格レベルは、時間とともに拒否されるにつれて、より暗く、より広くなります ノイズを避けるために、重要でない価格レベルは定期的にクリアされます カスタマイズ可能な時間枠の
Matrix Arrow Indicator MT5
Juvenille Emperor Limited
5 (14)
マトリックスアローインジケーターMT5は、すべてのシンボル/商品(外国為替、商品、暗号通貨、インデックス、株式)で使用できる100%再描画されていないマルチタイムフレームインジケーターに続くユニークな10in1トレンドです。マトリックスアローインジケーターMT5は、初期段階で現在のトレンドを判断し、最大10の標準インジケーターから情報とデータを収集します。 平均方向移動指数(ADX) 商品チャネルインデックス(CCI) クラシック平研アシキャンドル 移動平均 移動平均収束発散(MACD) 相対活力指数(RVI) 相対力指数(RSI) 放物線SAR ストキャスティクス ウィリアムズのパーセント範囲 すべてのインジケーターが有効な買いまたは売りシグナルを与えると、対応する矢印がチャートに印刷され、次のろうそく/バーの開始時に強い上昇トレンド/下降トレンドを示します。ユーザーは、使用するインジケーターを選択し、各インジケーターのパラメーターを個別に調整できます。マトリックスアローインジケーターMT5は選択されたインディケーターからのみ情報を収集し、それらのデータのみに基づいてアローを印
The Volumebyprice.com Indicator for MetaTrader 5 features Volume Profile and Market Profile TPO (Time Price Opportunity). Volume and TPO histogram bar and line charts. Volume Footprint charts. TPO letter and block marker collapsed and split structure charts. Static, dynamic and flexible range segmentation and compositing methods with relative and absolute visualizations. Session hours filtering and segment concatenation with Market Watch and custom user specifications. Graphical layering, posit
ICT, SMC, SMART MONEY CONCEPTS, SMART MONEY, Smart Money Concept, Support and Resistance, Trend Analysis, Price Action, Market Structure, Order Blocks, BOS/CHoCH,   Breaker Blocks ,  Momentum Shift,   Supply&Demand Zone/Order Blocks , Strong Imbalance,   HH/LL/HL/LH,    Fair Value Gap, FVG,  Premium  &   Discount   Zones, Fibonacci Retracement, OTE, Buy Side Liquidity, Sell Side Liquidity, BSL/SSL Taken, Equal Highs & Lows, MTF Dashboard, Multiple Time Frame, BigBar, HTF OB, HTF Market Structure
Volatility Trend System - a trading system that gives signals for entries. The volatility system gives linear and point signals in the direction of the trend, as well as signals to exit it, without redrawing and delays. The trend indicator monitors the direction of the medium-term trend, shows the direction and its change. The signal indicator is based on changes in volatility and shows market entries. The indicator is equipped with several types of alerts. Can be applied to various trading in
Was: $299  Now: $99   Supply Demand uses previous price action to identify potential imbalances between buyers and sellers. The key is to identify the better odds zones, not just the untouched ones. Blahtech Supply Demand indicator delivers functionality previously unavailable on any trading platform. This 4-in-1 indicator not only highlights the higher probability zones using a multi-criteria strength engine, but also combines it with multi-timeframe trend analysis, previously confirmed swings
Gold TMAF MTF - これは最高の株式テクニカル指標です。指標のアルゴリズムは、資産の値動きを分析し、ボラティリティと潜在的なエントリーゾーンを反映しています。 最高の指標シグナル: - 売りの場合 = TMA2の赤い上限がTMA1の赤い上限の上にある場合 + 上記の赤いフラクタル指標 + 同じ方向に黄色のSRシグナル矢印。 - 買いの場合 = TMA2の青い下限線がTMA1の青い下限線より下にある場合 + 下からの青いフラクタル指標 + 同じ方向の水色のSRシグナル矢印。 このインディケータの利点 1. このインディケータは、高精度のシグナルを生成します。 2. 確定した矢印シグナルは再描画されませんが、フラクタルシグナルは半周期再描画されます。 3. どのブローカーのMetaTrader 5取引プラットフォームでも取引できます。 4. あらゆる資産(通貨、金属、暗号通貨、株式、指数など)を取引できます。 5. M30-H1タイムフレーム(中期取引)で取引するのがよい。 6. 各トレーダーがインディケータを自分用に簡単にカスタマイズできるよ
トレンドラインは、外国為替取引におけるテクニカル分析の最も重要なツールです。残念ながら、ほとんどのトレーダーはそれらを正しく描画していません。自動トレンドラインインジケーターは、市場のトレンドの動きを視覚化するのに役立つ本格的なトレーダー向けのプロフェッショナルツールです。 トレンドラインには、強気トレンドラインと弱気トレンドラインの2種類があります。 上昇トレンドでは、外国為替トレンドラインは価格変動の最低スイングポイントを介して描画されます。 少なくとも2つの「最低安値」を接続すると、トレンドラインが作成されます。 下降トレンドでは、トレンドラインは価格変動の最も高いスイングポイントを介して描画されます。 少なくとも2つの「最高値」を接続すると、トレンドラインが作成されます。 トレンドラインが壊れたとき? 弱気のろうそくが強気のトレンドラインの下で閉じ、ろうそくの高さがトレンドラインの上にあるとき、強気のトレンドラインは壊れます。 強気のろうそくが弱気のトレンドラインの上で閉じ、ろうそくの安値がトレンドラインの下にあるとき、弱気のトレ
TPA True Price Action indicator reveals the true price action of the market makers through 100% non-repainting signals strictly at the close of a candle! TPA shows entries and re-entries, every time the bulls are definitely stronger than the bears and vice versa. Not to confuse with red/green candles. The shift of power gets confirmed at the earliest stage and is ONE exit strategy of several. There are available now two free parts of the TPA User Guide for our customers. The first "The Basics"
** All Symbols x All Timeframes scan just by pressing scanner button ** ***Contact me after purchase to send you instructions and add you in "123 scanner group" for sharing or seeing experiences with other users. After 17 years of experience in the markets and programming, Winner indicator is ready. I would like to share with you! Introduction The 123 Pattern Scanner indicator with a special enhanced algorithm is a very repetitive common pattern finder with a high success rate . Interestingly,
Auto Order Block with break of structure based on ICT and Smart Money Concepts (SMC) Futures Break of Structure ( BoS )             Order block ( OB )            Higher time frame Order block / Point of Interest ( POI )    shown on current chart           Fair value Gap ( FVG ) / Imbalance   -  MTF      ( Multi Time Frame )    HH/LL/HL/LH  -  MTF      ( Multi Time Frame )  Choch  MTF      ( Multi Time Frame )  Volume Imbalance     ,  MTF          vIMB Gap’s Power of 3 Equal High
作者のその他のプロダクト
この小さなツールは、チャート上で線をドラッグするだけでリスク管理を定義するのに役立ちます。アカウント%または固定金額に基づいて計算された実際のロットサイズがラインで直接表示されます。 キーボードの「t」キーを押してラインをアクティブにし、ラインをストップロスポイントまでドラッグするだけです。それでおしまい。 設定では、線とテキストの色と幅、行と右側のテキストのスペースを定義でき、リスクを口座または固定金額のパーセントで設定できます。 ご質問やご希望がございましたら、お気軽にお問い合わせください。 この小さなツールは、チャート上で線をドラッグするだけでリスク管理を定義するのに役立ちます。アカウント%または固定金額に基づいて計算された実際のロットサイズがラインで直接表示されます。 キーボードの「t」キーを押してラインをアクティブにし、ラインをストップロスポイントまでドラッグするだけです。それでおしまい。 設定では、線とテキストの色と幅、行と右側のテキストのスペースを定義でき、リスクを口座または固定金額のパーセントで設定できます。 ご質問やご希望が
FREE
リアルタイムティック&1分データエクスポートレコーダー 残念ながら、ブローカーからの過去の価格データは正確ではありません。つまり、欠落データ (ギャップ) があり、価格が正しくなく、これが不正確なバックテスト結果につながります。 データレコーダーは、オプションのティック/1 分データ、またはその両方をリアルタイムで個別に CSV ファイルに保存します。毎月 1 ファイル。 すべて MT5 形式なので、このデータを簡単にインポートして、バックテスティング用にブローカーから正確なデータと実際のスプレッドを含むカスタムシンボルを作成できます。 記録したい1分チャートにインジケーターを追加し、記録モードを選択するだけで記録が開始されます。 他にご質問やご要望がございましたら、いつでも喜んでお手伝いさせていただきます。
ワンバーブレイクアウトEAシステムは、高い利益率により多くの可能性を秘めたブレイクアウト戦略です。 その日の最も強いトレンドに従い、革新的なトレーリング方法を通じて利益を最大化するように設計されています。 これにより、たとえ勝率が低くても、短期間で大きな利益を得ることができます。正しく設定すれば、数か月間利益を上げて運用できます。 これは、ES (US500)、NQ (NAS100) などの大規模市場、または金、銀などの商品に最適です。 機能や設定・バックテストについてご不明な点がございましたら、お気軽にお問い合わせください。ご購入前にメッセージをお送りいただくことも可能です。 あなたは、多くの設定および最適化オプションを備えた非常に柔軟なブレークアウト システムを購入しようとしています。 まず、NAS100 (NQ) と Gold の現時点での最適な設定を示します。また、バックテストの成功に関するヒントと、バックテストに最適なデータも提供されます。
フィルタ:
James Erasmus
1053
James Erasmus 2024.07.09 10:03 
 

Nice work on concept and indi. Some issues with like one dot, does one enter trade. Very cool that one can change the entry symbol! Some good entries some not, so it needs confirmation and some strategy, great free indi.

レビューに返信