• 概要
  • レビュー (24)
  • コメント (279)
  • 最新情報

Trend Hunter

4.77
トレンドハンターは、外国為替市場で働くためのトレンド指標です。インディケータの特徴は、価格がトレンドラインをわずかに突破した場合にシグナルを変更することなく、トレンドに合わせて自信を持って移動することです。
インジケーターは再描画されず、バーが閉じられた後に市場に参入するためのシグナルが表示されます。

トレンドハンターは公正な指標です。インジケーターシグナルの上にマウスを置くと、シグナルの潜在的な利益が表示されます。

短いストップロスで取引するために、トレンドに沿って移動するときに追加のインジケーターシグナルが提供されます。

トレンドハンタースキャナーは、他の通貨ペアと時間枠でのトレンドの方向性を評価するのに役立ちます。

インジケーターは、チャートの下にある便利なパネルを介して制御されます。


オプション
  • Alert -ターミナルに通知を表示します
  • EMail -Eメール通知を送信します
  • Push -スマートフォンにプッシュ通知を送信する
  • Style -インジケータの描画スタイル
  • Scanner -通貨ペアのスキャナーを有効にします
レビュー 20
Peter Maggen
1092
Peter Maggen 2021.11.02 14:12 
 

The problem is that trend changes like the wind. It's a good CCI based trend system. Nice programming too. Congrats. But one need more skills to win from the matket.

95M51fa
20
95M51fa 2021.07.14 08:48 
 

Excellent indicator, nice work!

Aravind Kolanupaka
8890
Aravind Kolanupaka 2021.03.19 16:25 
 

Very Good, specially with the new update this indicator is just what every one needs.

おすすめのプロダクト
This is a trend indicator without redrawing Developed instead of the binary options strategy (by the color of the Martingale candlestick) Also works well in forex trading When to open trades (binary options) A signal will appear in the place with a candle signaling the current candle It is recommended to open a deal for one candle of the current timeframe M1 and M5 When a blue dot appears, open a deal up When a red dot appears, open a trade down. How to open trades on Forex. When a signal is rec
Owl smart levels
Sergey Ermolov
4.63 (54)
MT5版  |   FAQ Owl Smart Levels Indicator   は、 Bill Williams   の高度なフラクタル、市場の正しい波構造を構築する Valable ZigZag、エントリの正確なレベルをマークする Fibonacci レベルなどの一般的な市場分析ツールを含む 1 つのインジケーター内の完全な取引システムです。 利益を得るために市場と場所に。 戦略の詳細な説明 インジケータを操作するための指示 顧問-取引助手 プライベートユーザーチャット ->購入後に私に書いて、私はプライベートチャットにあなたを追加し、あなたはそこにすべてのボーナスをダウンロードすることができます 力はシンプルさにあります! Owl Smart Levels   取引システムは非常に使いやすいので、専門家にも、市場を勉強し始めて自分で取引戦略を選択し始めたばかりの人にも適しています。 戦略と指標に秘密の数式や計算方法が隠されているわけではなく、すべての戦略指標は公開されています。 Owl Smart Levels を使用すると、取引を開始するためのシグナルをすばやく確認し、
Improved version of the free HMA Trend indicator (for MetaTrader 4) with statistical analysis. HMA Trend is a trend indicator based on the Hull Moving Average (HMA) with two periods. HMA with a slow period identifies the trend, while HMA with a fast period determines the short-term movements and signals in the trend direction. The main differences from the free version: Ability to predict the probability of a trend reversal using analysis of history data. Plotting statistical charts for analyz
The Th3Eng PipFinite indicator is based on a very excellent analysis of the right trend direction with perfect custom algorithms. It show the true direction and the best point to start trading. With StopLoss point and Three Take Profit points. Also it show the right pivot of the price and small points to order to replace the dynamic support and resistance channel, Which surrounds the price. And Finally it draws a very helpful Box on the left side on the chart includes (take profits and Stop loss
The Stepping Trend Indicator     The Steppi ng Trend indicator uses the  average true range  (ATR indicator) in its calculation. This gives you control to set your own average true range period, I set the Default as 10.   Indicator Details. Green Arrow Up: This means you are at the starting point of a new bullish trend, it’s time to buy.   Red  Arrow  Down : This means you are at the starting point of a new  bearish  trend, it’ s time to sell .   What if you miss the Arrow Signal?   No
Heiken Ashi candle chart is an improved version of The Japanese candle chart, which can effectively filter the market "noise" of the Japanese candle chart. It is favored by many traders for its simplicity and intuition. For trend traders, the HA candle chart is a magic tool. Unlike the traditional Japanese candle chart, Heikenashi does not reflect the opening price, high price, low price and closing price of the market. Instead, Heikenashi calculates the value of a single K line in the dominant
The Point61 indicator is the result of many years of monitoring of price behavior of currency pairs and metals. It is not a secret, that in times of uncertainty, traders are looking for possible levels of support and resistance - the point, where price should stop its movement. There are 2 possible scenarios at these points: 1. Reverse (correction) to the opposite direction; 2. Breakthrough to continue movement. Very often these points are used to set stop orders - TakeProfit or
PipFinite Trend PRO
Karlo Wilson Vendiola
4.9 (2778)
Breakthrough Solution For Trend Trading And Filtering With All Important Features Built Inside One Tool! Trend PRO's smart algorithm detects the trend, filters out market noise and gives entry signals with exit levels. The new features with enhanced rules for statistical calculation improved the overall performance of this indicator. Important Information Revealed Maximize the potential of Trend Pro, please visit www.mql5.com/en/blogs/post/713938 The Powerful Expert Advisor Version Automa
This unique multi-currency strategy simultaneously determines the strength of trends and market entry points, visualizing this using histograms on the chart. The indicator is optimally adapted for trading on the timeframes М5, М15, М30, Н1. For the convenience of users, the indicator renders the entry point (in the form of an arrow), recommended take profit levels (TP1, TP2 with text labels) and the recommended Stop Loss level. The take profit levels (TP1, TP2) are automatically calculated for
Noize Absorption Index - is the manual trading system that measures the difference of pressure between bears forces and bulls forces. Green line - is a noize free index that showing curent situation. Zero value of index shows totally choppy/flat market.Values above zero level shows how powerfull bullish wave is and values below zero measures bearish forces.Up arrow appears on bearish market when it's ready to reverse, dn arrow appears on weak bullish market, as a result of reverse expectation. S
"The trend is your friend" is one of the best known sayings in investing, because capturing large trendy price movements can be extremely profitable. However, trading with the trend is often easier said than done, because many indicators are based on price reversals not trends. These aren't very effective at identifying trendy periods, or predicting whether trends will continue. We developed the Trendiness Index to help address this problem by indicating the strength and direction of price trend
[ZhiBiCCI]インディケータは全てのサイクル使用に適しており、そして全ての市場品種にも適しています。 [ZhiBiCCI]緑色の実線は強気の発散の逆転です。緑色の点線は古典的な強気の発散です。 [ZhiBiCCI]赤への実線は逆弱気の発散である。赤い点線は古典的な弱気の発散です。 [ZhiBiCCI]はパラメータ(アラート、メール送信、通知送信)で設定でき、(true)に設定するとインスタント信号をアラームウィンドウに送信し、Eメール、インスタントメッセージを送信できます。 パラメータ設定の説明 [displayAlert]:これはアラームスイッチで、trueに設定され、矢印が表示されればプロンプトに自動的に警告され、falseに設定されれば警告されません。 [sendmail_NO_OFF]:これはメールを送信するためのスイッチで、trueに設定します。矢印が表示されていればMT4で設定したメールボックスにメールを送信し、falseに設定されていればメールを送信しません。 [sendnotification_NO_OFF]:これはインスタントメッセー
Signal trend indicator. Detects the direction of the trend and is coloured accordingly.  Has built in audible and visual alerts when trends change. Can send notifications to your phone or email. Allows Trend and Counter-Trend trading. Works on all timeframes, all currency pairs, metals, indices and cryptocurrencies. Can be used with binary options. Distinctive features No re-drawing; Simple and clear settings; Four types of alerts; Works on all timeframes and all trading tools; Su
Trade with Gann on your side!! MASTER CIRCLE 360 CIRCLE CHART, originally created by Gann admitted that this is “The Mother of all charts”. It is one of the last studies that this great trader left for us. The numeric tab le is apparently quite simple like all the tables and is based on square numbers, the SQUARE OF 12 and is by evolution, one of the most important square numbers. Here we can find CYCLE, PRICE AND TIME thanks to angles and grades, to show past and future support and resistance.
We present you the indicator "Candle closing counter", which will become your indispensable assistant in the world of trading. That’s why knowing when the candle will close can help: If you like to trade using candle patterns, you will know when the candle will be closed. This indicator will allow you to check if a known pattern has formed and if there is a possibility of trading. The indicator will help you to prepare for market opening and market closure. You can set a timer to create a p
For sure, this indicator has become very popular amongst traders. Through coding this indicator will give you the most accurate levels possible for your trading analysis. We have also added in the ability for you to receive alerts when the price breaks above or below a Support or Resistance lines! HOW TO USE The red rectangles represent your resistance/supply zone. The green rectangles represent your support/demand zone.  BONUS FEATURES We coded this indicator with the ability to switch between
矢印を再描画しない外国為替スキャルピング インジケーター。 M5、M15、M30、H1 の時間枠で最適に機能します。デフォルト設定は M5 時間枠用です。下の図は、「期間 = 0.35」パラメーター値を使用して H1 チャートで作業する例を示しています。デモ版をダウンロードして、自分でテストできます。現在、ほとんどすべてのスキャルピング戦略でこのインジケーターのシグナルを使用しています。私たちの計算によると、そのシグナルの精度は時間枠に応じて約 95% です。このインジケーターは、すべての通貨ペアで機能します。すべての主要通貨ペアと金属でテストしました。どこでも±95%のほぼ同じ精度が得られました。 インジケーターの利点: 矢印を再描画しません すべての通貨ペアで動作します 高い信号精度 スキャルピングに良い インジケーターの設定: period - 信号精度を計算するための期間。 price - インジケーターにどの価格を使用するかを指示します: CLOSE、OPEN、HIGH、LOW。デフォルトでは、インディケータは CLOSE 価格で動作します。
Forex Gump
Andrey Kozak
2.83 (6)
Forex Gump is a fully finished semi-automatic trading system. In the form of arrows, signals are displayed on the screen for opening and closing deals. All you need is to follow the instructions of the indicator. When the indicator shows a blue arrow, you need to open a buy order. When the indicator shows a red arrow, you need to open a sell order. Close orders when the indicator draws a yellow cross. In order to get the most effective result, we recommend using the timeframes H1, H4, D1. There
Distinctive is a forex trending arrow indicator for identifying potential entry points. I like it, first of all, because it has a simple mechanism of work, adaptation to all time periods and trading tactics. Created on the basis of a regression channel with filters. Plotting the Lawrence indicator signals on a price function chart using a mathematical approach. How it works - when the price breaks out in the overbought / oversold zone (channel levels), a buy or sell signal is generated. Every
フィボナッチリトレースと拡張ラインツール DiNapoliポイント取引方法とゴールデンセクション取引を使用するトレーダーにとって理想的なMT4プラットフォームのフィボナッチリトレースと拡張ラインツール 主な特長: あなたはフィボナッチリトレースメントの複数のセットを直接描くことができ、重要なリターンポイント間の関係は一目瞭然です。 2.フィボナッチ拡張を描画することができます。 3.フィボナッチフォールドバックとラインの延長は、簡単な観察と数値表示のために左右に動かすことができます。 4.チャートは非常に爽やかな 5.数字キーでサイクルを切り替えることができます。 ファンクションキー: 1。 [戻るを押す、要求に応じて描画する、最大8つのグループにする 2。拡張]を描くには[押す] 3。 \を押すと、現在のサイクルの下にあるすべての拡張機能と折り畳みが削除されます 4。フォールドバックを移動して削除して展開する (1)最初のフォールドバックセットのF5行をクリックします。 一度クリックすると(黄色に変わります)、キーボードのDel
Trend Monitor
Pavel Zamoshnikov
4.2 (5)
The indicator generates early signals basing on ADX reading data combined with elements of price patterns. Works on all symbols and timeframes. The indicator does not redraw its signals. You see the same things on history and in real time. For better visual perception signals are displayed as arrows (in order not to overload the chart). Features Easy to use. Filter configuration only requires selection of sensitivity in the " Sensitivity of the indicator " input. Signals can be filtered usin
This indicator is good for small time frames like 1 and 5 minutes and made for day trading. The indicator never repaints or recalculates. The indicator works is for trading swing points in day trading, following bulls or bears.  Its a simple to use, non cluttered indicator with a high success rate.  This indicator works well to capture ranges.  All indicators come with limitations and no indicator or system is always accurate. Use money management for long term trading success.   Place in backte
The indicator displays the data of the Stochastic oscillator from a higher timeframe on the chart. The main and signal lines are displayed in a separate window. The stepped response is not smoothed. The indicator is useful for practicing "manual" forex trading strategies, which use the data from several screens with different timeframes of a single symbol. The indicator uses the settings that are identical to the standard ones, and a drop-down list for selecting the timeframe. Indicator Parame
Taurus All4 Taurus All4 is a high-performance indicator, it will tell you the strength of the trend, and you will be able to observe the strength of the candle. Our indicator has more than 4 trend confirmations. It is very simple and easy to use. Confirmation Modes Candle Trend Confirmations: When the candle switches to light green the trend is high. When the candle switches to light red the trend is reverting down. When the candle changes to dark red the trend is low. Trendline Trend Conf
Heiken Ashi Smoothed Strategy is a very simple but powerful system to get forex market trend direction. This indicator is actually 2 indicators in 1 pack, Heiken Ashi and Heiken Ashi Smoothed Moving Average both included. Because HA (Heiken Ashi) and HAS (Heiken Ashi Smoothed) are calculated in the same one system event with necessary buffers and loop only, so it is the FAST, OPTIMIZED and EFFICIENT HA having the combined indicator of MetaTrader 4. You can choose to display HA and HAS in the sam
トレンドトレーディング は、タイミングのプルバックとブレイクアウトにより、市場で起こっているトレンドから可能な限り利益を得るように設計された指標です。確立されたトレンドの中で価格が何をしているかを分析することにより、取引の機会を見つけます。 [ インストールガイド | 更新ガイド | トラブルシューティング | よくある質問 | すべての製品 ] 自信を持って効率的に金融市場を取引する むち打ちにならずに確立されたトレンドから利益を得る 収益性の高いプルバック、ブレイクアウト、早期の逆転を認識する この指標は、独自の品質とパフォーマンスを分析します 複数時間枠のダッシュボードを実装します インジケーターは再描画されていません 電子メール/音声/視覚アラートを実装します 確立されたトレンドは多くの取引機会を提供しますが、ほとんどのトレンド指標はそれらを完全に無視しています。インジケーターの解釈はかなり簡単です: (1) トレンドの変化 (2) トレンドの方向への後退 (3) トレンドの方向へのブレイクアウト 赤いダッシュ は下降トレンド中の修正です 青いダッシュ は上昇ト
PABT Pattern Indicator - it's classical system one of the signal patterns. Indicator logic - the Hi & Lo of the bar is fully within the range of the preceding bar, look to trade them as pullback in trend. In the way if indicator found PABT pattern it's drawing two lines and arrow what showing trend way.  - First line - it's entry point and drawing at: 1. On the high of signal bar or on middle of the signal bar (depending from indicator mode) for buy; 2. On the low of signal bar or on middle of t
This indicator is another variant of the famous powerful indicator Fibonacci-SS https://www.mql5.com/en/market/product/10136 but has different behaviour in placing Pending Order and TP Line. Automatically places Fibonacci retracement lines from the last highest and lowest visible bars on the chart with: An auto Pending Order (Buy/Sell). Taking Profit 1, Taking Profit 2 is pivot point and Taking Profit 3 for extended reward opportunity. The best risk and reward ratio. Simple and powerful indica
Chart Patterns Detect 15 patterns (Ascending Triangle, Descending Triangle, Rising Wedge, Falling Wedge, Bullish Flag, Bearish Flag, Bullish Rectangle, Bearish Rectangle Symmetrical triangle, Head and Shoulders, Inverted Head and Shoulders, Triple top, Triple Bottom, Double Top, Double Bottom) Use historical data to calculate the probability of each pattern to succeed (possibility to filter notification according to the chance of success) gives graphic indication about the invalidation level and
このプロダクトを購入した人は以下も購入しています
Reversal First Impulse levels (RFI)    INSTRUCTIONS        RUS       -       ENG              R ecommended to use with an indicator   -   TREND PRO -  Version MT5 A key element in trading is zones or levels from which decisions to buy or sell a trading instrument are made. Despite attempts by major players to conceal their presence in the market, they inevitably leave traces. Our task was to learn how to identify these traces and interpret them correctly. Main functions: Displaying active zones
TPSpro TRENDPRO  - is a trend indicator that automatically analyzes the market and provides information about the trend and each of its changes, as well as giving signals for entering trades without redrawing! The indicator uses each candle, analyzing them separately. referring to different impulses - up or down impulse. Exact entry points into transactions for currencies, crypto, metals, stocks, indices!  -  Version MT5               DETAILED DESCRIPTION                R ecommended to use with
Enigmera
Ivan Stefanov
5 (3)
エニグメラ:市場の中核 https://www.enigmera.com はじめに このインディケータと取引システムは、金融市場に対する驚くべきアプローチです。ENIGMERAは、フラクタルサイクルを使用して、サポートとレジスタンスレベルを正確に計算します。本格的な蓄積局面を示し、方向性と目標を示します。 トレンド中でも調整中でも機能するシステムです。 どのように作動するのか? ENIGMERAは、支持線・抵抗線、目標線、乖離線の3つのラインで構成されています。このシステムは、過去のデータを現在と未来に外挿する典型的な市場指標とは異なり、現在の完全な画像を提供します。支持線上にある場合、それは本当の支持を意味し、抵抗線上にある場合、それは本当の抵抗を意味する。ある水準が破られた場合、それはトレンドの変化を意味する。再描画はしない。 市場は常に進化しているため、ENIGMERAはその評価ツールを適応させ、定期的に戦略を修正しています。  これにより、すべてのシナリオが徹底的に評価されることが保証されます。この市場指標の独自性は、その能力を見れば明らかです。  ENIGM
まず第一に、この取引インジケーターは再描画されず、再描画されず、遅延しないことを強調する価値があります。これにより、手動取引とロボット取引の両方に理想的なものになります。 ユーザーマニュアル:設定、入力、戦略。 アトミックアナリストは、価格の強さとモメンタムを利用して市場でより良いエッジを見つけるためのPA価格アクションインジケーターです。ノイズや誤ったシグナルを除去し、取引ポテンシャルを高めるための高度なフィルターを備えています。複雑なインジケーターの複数のレイヤーを使用して、アトミックアナリストはチャートをスキャンし、複雑な数学的計算をシンプルなシグナルと色に変換します。これにより、どのような初心者トレーダーでも理解して使用し、一貫した取引の決定を行うことができます。 「アトミックアナリスト」は、新規および経験豊富なトレーダー向けにカスタマイズされた包括的な取引ソリューションです。プレミアムインジケーターとトップノッチの機能を1つの取引戦略に組み合わせ、すべてのタイプのトレーダーにとって汎用性のある選択肢にします。 デイリートレーディングとスキャルピング戦略:高
An exclusive indicator that utilizes an innovative algorithm to swiftly and accurately determine the market trend. The indicator automatically calculates opening, closing, and profit levels, providing detailed trading statistics. With these features, you can choose the most appropriate trading instrument for the current market conditions. Additionally, you can easily integrate your own arrow indicators into Scalper Inside Pro to quickly evaluate their statistics and profitability. Scalper Inside
現在20%OFF! 初心者やエキスパートトレーダーのためのベストソリューション! このダッシュボードソフトウェアは、28の通貨ペアで動作しています。それは私達の主要な指標(高度な通貨の強さ28と高度な通貨インパルス)の2に基づいています。それは全体の外国為替市場の大きい概観を与えます。それは、すべての(9)時間枠で28の外国為替ペアのための高度な通貨の強さの値、通貨の動きの速度と信号を示しています。チャート上で1つのインディケータを使用して市場全体を観察し、トレンドやスキャルピングの機会をピンポイントで見つけることができたら、あなたのトレードがどのように改善されるか想像してみてください。 このインディケータには、強い通貨と弱い通貨の識別、潜在的な取引の識別と確認がより簡単になるような機能が搭載されています。このインディケータは、通貨の強さや弱さが増加しているか減少しているか、また、すべての時間枠でどのように機能しているかをグラフィカルに表示します。 新機能として、現在の市場環境の変化に適応するダイナミックなマーケットフィボナッチレベルが追加され、すでに当社のAdvan
FX Volume
Daniel Stein
4.6 (35)
mql5と Telegramの モーニング・ブリーフィングで、詳細とスクリーンショットを含む毎日のマーケット・アップデートをご覧 ください! FX Volumeは、ブローカーの視点から市場のセンチメントをリアルに洞察する、最初で唯一の出来高インジケーターです。 ブローカーのような機関投資家が外国為替市場でどのようなポジションをとっているか、COTレポートよりもはるかに速く、素晴らしい洞察を提供します。 この情報をチャート上で直接見ることは、あなたの取引にとって真のゲームチェンジャーであり、画期的なソリューションです。 以下のようなユニークなマーケットデータ洞察から利益を得てください。 比率は 、通貨のロングポジションとショートポジションの比率をパーセントで表示します。 比率の変化は 、選択した期間内のロング比率とその変化率を表示します。 Volumes Totalは 、通貨の取引量(ロングとショート)の合計をロット単位で表示します。 Volumes Long :全通貨のロングポジションの取引量を表示します。 Volumes(ショート )は、全通貨のショートポジションの取引量を表示
このインディケータは、当社の2つの製品 Advanced Currency IMPULSE with ALERT  +   Currency Strength Exotics . のスーパーコンビネーションです。 このインジケーターは全ての時間枠で作動し、8つの主要通貨と1つのシンボルの強弱のインパルスをグラフで表示します。 このインジケータは、金、エキゾチックペア、商品、インデックス、先物など、あらゆるシンボルの通貨強度の加速度を表示することに特化されています。金、銀、原油、DAX、US30、MXN、TRY、CNHなどの通貨強度の加速度(インパルスまたは速度)を表示するために、任意のシンボルを9行目に追加できる、この種の最初のものです。 新しいアルゴリズムに基づいて構築され、潜在的な取引の特定と確認がさらに容易になりました。これは、通貨の強さや弱さが加速しているかどうかをグラフィカルに表示し、その加速の速度を測定するためです。加速すると物事は明らかに速く進みますが、これはFX市場でも同じです。つまり、反対方向に加速している通貨をペアリングすれば、潜在的に利益を生む取
TrendMaestro
Stefano Frisetti
5 (3)
note: this indicator is for METATRADER4, if you want the version for METATRADER5 this is the link:  https://www.mql5.com/it/market/product/108106 TRENDMAESTRO ver 2.4 TRENDMAESTRO recognizes a new TREND in the bud, he never makes mistakes. The certainty of identifying a new TREND is priceless. DESCRIPTION TRENDMAESTRO identifies a new TREND in the bud, this indicator examines the volatility, volumes and momentum to identify the moment in which there is an explosion of one or more of these data a
もちろんです。以下は、提供いただいたテキストの日本語への翻訳です: MT4用の天文学指標をご紹介します:究極の天体トレーディングコンパニオン トレーディング体験を天空の高みに高める準備はできていますか?私たちの革命的なMT4用の天文学指標をご紹介します。この革新的なツールは、複雑なアルゴリズムの力を借りて、類まれなる天文学的洞察と精密な計算を提供します。 あなたの指先で宇宙の情報を: 宝のような天文学的データが明らかになる包括的なパネルをご覧ください。惑星の地理的/太陽中心座標、太陽と地球の距離、星の大きさ、伸び、星座、黄道座標および赤道座標、さらには水平座標まで、それぞれが綿密に計算され美しく表示されています。指標によって生成される垂直線は時間値に対応し、トレーディングの旅に宇宙の視点を提供します。 惑星のラインと関係: グラフを飾る惑星のラインの魔法を体験し、スケールと角度をカスタマイズできます。直感的なコントロールパネルを介して各惑星のラインの表示を簡単に切り替えることができます。指定された時刻範囲内での合会、六分会、四分会、三分会、対会、逆行の指標で天体の関係の芸術を発見してく
ご紹介   クォンタム トレンド スナイパー インジケーターは 、トレンド反転を特定して取引する方法を変革する画期的な MQL5 インジケーターです。 13年以上の取引経験を持つ経験豊富なトレーダーのチームによって開発されました。     クォンタムトレンドスナイパーインジケーター   は、非常に高い精度でトレンドの反転を識別する革新的な方法で、あなたのトレーディングの旅を新たな高みに押し上げるように設計されています。 ***Quantum Trend Sniper Indicatorを購入すると、Quantum Breakout Indicatorを無料で入手できます!*** クォンタム ブレイクアウト インジケーターは、トレンドの反転を特定するとアラートを発し、矢印を示し、3 つのテイクプロフィットレベルを提案します。 初心者トレーダーにもプロのトレーダーにも適しています。 量子EAチャネル:       ここをクリック MT5のバージョン:       ここをクリック 推奨事項: 期間: すべての時間枠。最良の結果を得るには、
The indicator " ZigZag on Trend " is an assistant in determining the direction of price movement, as well as a calculator of bars and points. It consists of a trend indicator, which follows the price direction by the trend line presented in the form of a zigzag and a counter calculating the number of bars traversed in the direction of the trend and the number of points on the vertical scale. (calculations are carried out by the opening of the bar) The indicator does not redraw. For convenience,
How to use Pair Trading Station Pair Trading Station is recommended for H1 time frame and you can use it for any currency pairs. To generate buy and sell signal, follow few steps below to apply Pair Trading Station to your MetaTrader terminal. When you load Pair Trading Station on your chart, Pair Trading station will assess available historical data in your MetaTrader platforms for each currency pair. On your chart, the amount of historical data available will be displayed for each currency pai
Step into the realm of Forex trading with confidence and precision using XQ, a cutting-edge Forex indicator designed to elevate your trading game to unprecedented heights. Whether you're a seasoned trader or just stepping into the world of currency exchange,   XQ Forex Indicator   empowers you with the insights and signals needed to make informed trading decisions. The signal conditions are a combination of three indicators, and XQ Forex Indicator only display  medium and long-term trends . The
現在20%OFF! 初心者やエキスパートトレーダーに最適なソリューションです。 このインディケータは、エキゾチックペア・コモディティ・インデックス・先物など、あらゆるシンボルの通貨の強さを表示することに特化したインディケータです。金、銀、原油、DAX、US30、MXN、TRY、CNHなどの通貨の強さを表示するために、9行目にどのシンボルでも追加することができます。独自の機能を多数搭載し、新しい計算式を採用したため、ユニークで高品質、かつ手頃な価格のトレーディングツールとなっています。新しいトレンドやスキャルピングチャンスのトリガーポイントを正確に把握することができるため、あなたのトレードがどのように改善されるか想像してみてください。 ユーザーマニュアル:ここをクリック   https://www.mql5.com/en/blogs/post/708876 すべての時間枠に対応します。あなたはすぐにトレンドを見ることができるようになります! 新しいアルゴリズムに基づいて設計されているため、潜在的な取引の特定と確認がより簡単になります。これは、8つの主要通貨と1つのシンボ
現在20%OFF! このダッシュボードは、複数のシンボルと最大9つのタイムフレームで動作するソフトウェアの非常に強力な部分です。 このソフトは、弊社のメインインジケーター(ベストレビュー:Advanced Supply Demand)をベースにしています。    Advanced Supply Demand ダッシュボードは、素晴らしい概要を提供します。それは示しています。  ゾーン強度評価を含むフィルタリングされた需給値。 ゾーン内/ゾーンへのPips距離。 ネストされたゾーンがハイライトされます。 選択されたシンボルの4種類のアラートを全ての(9)時間枠で提供します。 それはあなたの個人的なニーズに合わせて高度に設定可能です。 あなたの利益! すべてのトレーダーにとって最も重要な質問です。 市場に参入するのに最適なレベルはどこか? 成功のチャンスとリスク/リターンを得るために、強力な供給/需要ゾーン内またはその近くで取引を開始します。 損切りの最適な位置はどこですか? 最も安全なのは、強力な供給/需要ゾーンの下/上にストップを置くことで
Max Payneは、矢印の形でシグナルを与える反転/トレンドシグナルインジケーターです。このインジケーターは、同じバーの終値でシグナルを出します。このインジケーターは、異なる期間でチャート上に複数回ドロップして、シグナルの2倍/3倍の確認を取得できます。 このインジケーターは、あらゆる取引スタイルに合わせて高度に調整できますが、再描画やバックペイントは一切行われません。購入後には、使用したテンプレートとともにスクリーンショットに表示される完全なシステムが表示されます。 ----------------- 取引方法: トレンドフィルター(購入後に得られるペイントレンド)が方向に一致している間、同じバーでトリプル確認が得られるまで待ちます 取引を開始し、買い取引の場合は金色の矢印 (テンプレート) より下、売り取引の場合は金色の矢印 (テンプレート) より上にストップロスを設定します。終了シグナルは最初の反対側の白い点のシグナル (テンプレート) です。 ----------------- パラメーター : 信号周期:矢印周期 フィルター: 信号フィルター 距離 : ローソクからの矢印
Please send me Direct message on MQL5 CHAT after purchasing the Indicator for Training and Installation Support There are some additional files that is important to use with the Indicator . So be sure to contact me after purchasing the Indicator So that I can add you for training and support . If you find any difficulty with installation then send me Direct message here So that I can connect with you via Anydesk or Teamview for the product installation. " Smart Order Block Indicator " to find
The All-in-One Trade Indicator (AOTI) determines daily targets for EURUSD, EURJPY, GBPUSD, USDCHF, EURGBP, EURCAD, EURAUD, AUDJPY, GBPAUD, GBPCAD, GBPCHF, GBPJPY, AUDUSD, and USDJPY. All other modules work with any trading instruments. The indicator includes various features, such as Double Channel trend direction, Price channel, MA Bands, Fibo levels, Climax Bar detection, and others. The AOTI indicator is based on several trading strategies, and created to simplify market analysis. All-in-One
SNR LEVEL INDICATOR Accurate Snr level indicator will only display Fresh Levels that are close to the Current Market Price. This indicator is very accurate in mapping Support & resistance levels. there is an alert feature when the price TOUCHES the SNR LEVEL, WHEN CLOSE CANDLE BREAK/REJECT SNR LEVEL. INDICATOR MARKING :: - SUPPORT LEVEL == V SHAPE - RESISTANCE LEVEL == APEX LEVEL - GAP RESISTANCE & GAP SUPPORT == OPEN CLOSE CANDLE - SUPPORT BECAME RESISTANCE & RESISTANCE BECAME SUPPORT INDIC
NAM Order Blocks
NAM TECH GROUP, CORP.
5 (1)
MT4マルチタイムフレームオーダーブロック検出インジケーター。 特徴 -チャートコントロールパネルで完全にカスタマイズ可能で、完全な相互作用を提供します。 -必要な場所でコントロールパネルを表示および非表示にします。 -複数の時間枠でOBを検出します。 -表示するOBの数量を選択します。 -さまざまなOBユーザーインターフェイス。 -OBのさまざまなフィルター。 -OB近接アラート。 -ADRの高線と低線。 -通知サービス(画面アラート|プッシュ通知)。 概要 注文ブロックは、金融機関や銀行からの注文収集を示す市場行動です。著名な金融機関と中央銀行が外国為替市場を牽引しています。したがって、トレーダーは市場で何をしているのかを知る必要があります。市場が注文ブロックを構築するとき、それは投資決定のほとんどが行われる範囲のように動きます。 注文の構築が完了すると、市場は上向きと下向きの両方に向かって急激に動きます。注文ブロック取引戦略の重要な用語は、機関投資家が行っていることを含むことです。それらは主要な価格ドライバーであるため、機関投
Volatility Trend System - a trading system that gives signals for entries. The volatility system gives linear and point signals in the direction of the trend, as well as signals to exit it, without redrawing and delays. The trend indicator monitors the direction of the medium-term trend, shows the direction and its change. The signal indicator is based on changes in volatility and shows market entries. The indicator is equipped with several types of alerts. Can be applied to various trading
"The Squeeze indicator attempts to identify periods of consolidation in a market. In general the market is either in a period of quiet consolidation or vertical price discovery. By identifying these calm periods, we have a better opportunity of getting into trades with the potential for larger moves. Once a market enters into a "squeeze," we watch the overall market momentum to help forecast the market direction and await a release of market energy." Modified TTM Squeeze Indicator is a modifica
これはMT4のインジケーターで、再描画なしで取引に参入するための正確なシグナルを提供します。 外国為替、暗号通貨、金属、株式、インデックスなど、あらゆる金融資産に適用できます。かなり正確な見積もりを提供し、取引を開始して終了するのに最適な時期を教えてくれます。1つのシグナルを処理しただけでインジケーターの元が取れた例の 動画 (6:22)をご覧ください。Entry PointsPro インジケーターの助けを借りたほとんどのトレーダーの最初の1週間の結果が改善しています。 Telegramグループ に登録してください。Entry Points Proインジケーターのメリットは次の通りです。 再描画のないエントリーシグナル 再描画されるインジケーターでは一度表示されたシグナルが削除されて大きな金銭的損失につながることがありますが、これと異なり、表示されて確認されたシグナルは消えることがありません。 エラーなしの取引開始 インジケーターアルゴリズムによって取引を開始する(資産を売買する)理想的な瞬間を見つけることができます。それを使用するすべてのトレーダーの成功率が向上します。
This indicator is based on the mathematics of the great trader W.D. Ganna. With its help, you can easily find strong levels by analyzing swings to find the optimal entry point. The indicator works on all instruments and all timeframes. The indicator is fully manual and has control buttons. All you need to do is press the NEW button, a segment will appear, which you can place on any movement, swing or even 1 candle that you want to analyze. By placing the segment, press the OK button. A grid (th
Limitless MT4は、すべての初心者と経験豊富なトレーダーに適したユニバーサルインジケーターです。 すべての通貨ペア、暗号通貨、生の株式で動作します 無制限のMT4-構成済みで、追加の構成は不要 そして今、主なもの なぜ無制限のMT4なのか? 1再描画の完全な欠如 2トレーディングの最高のスペシャリストによる2年間のテスト 3正しい信号の精度が80%を超える 4ニュースリリース中の取引で好調 取引ルール 1買いシグナル-青い上向き矢印の出現 下向きの赤い矢印の外観を販売するシグナル シグナル後の次のローソク足で取引を開始するには2 3テイクプロフィット チャート上 М1-40ピップ М5-50ピップ М15-55-60ピップ 4ストップロスは利益をとる 5誤った信号をフィルタリングするために、 パラボリックSAR-トレンドとのトレードへの参入を除外する移動平均または同様のトレンドインジケーター。 
Cycle Sniper
Elmira Memish
4.39 (36)
NEW YEAR SALE PRICE FOR LIMITED TIME!!! Please contact us after your purchase and we will send you the complimentary indicators to complete the system Cycle Sniper is not a holy grail but when you use it in a system which is explained in the videos, you will feel the difference. If you are not willing to focus on the charts designed with Cycle Sniper and other free tools we provide, we recommend not buying this indicator. We recommend watching the videos about the indiactor and system before pu
This indicator scans for you up to 30 trading instruments and up to 8 timeframes for occurrences of the high probability reversal patterns: Double Tops/Bottoms with fake breakouts . Please read also the blog post " Professional Trading With Double Tops/Bottoms And Divergences! " which explains the concepts behind the ULTIMATE Double Top/Bottom indicator and how you can use a professional top-down approach. You can get alerts via MetaTrader 4, email and push notifications at the moment when a sig
ご紹介     Quantum Breakout PRO は 、ブレイクアウト ゾーンの取引方法を変革する画期的な MQL5 インジケーターです。 13年以上の取引経験を持つ経験豊富なトレーダーのチームによって開発された Quantum Breakout PROは 、革新的でダイナミックなブレイクアウトゾーン戦略により、あなたの取引の旅を新たな高みに押し上げるように設計されています。 クォンタム ブレイクアウト インジケーターは、5 つの利益ターゲット ゾーンを備えたブレイクアウト ゾーン上のシグナル矢印と、ブレイクアウト ボックスに基づいたストップロスの提案を提供します。 初心者トレーダーにもプロのトレーダーにも適しています。 量子EAチャネル:       ここをクリック MT5バージョン:   ここをクリック 重要!購入後、インストールマニュアルを受け取るためにプライベートメッセージを送ってください。 推奨事項: 時間枠: M15 通貨ペア: GBPJPY、EURJPY、USDJPY、NZDUSD、XAUUSD アカウントの種類: ECN、Raw、また
Currently Price 20% OFF ( for unlimited use )   BONUS  AUX VIP Club 2024 : Include  EA Airbag  and  Load Data History  to enhance the performance of this tool to its maximum potential  Click Here to Download Files   ( for users only )   Hello World! Introducing.. SMCpro VIP tool and Indicator for MetaTrader 4, designed to revolutionize your trading experience with the ICT Smart Money Concept. This system is meticulously crafted to empower traders with advanced insights and precision in
作者のその他のプロダクト
ZigZag Fibo EA MT5
Andrey Tatarinov
4.8 (5)
アドバイザーはトレンドに合わせてトレードします。 トレンドの方向はジグザグインジケーターによって決定されます。 フィボナッチ グリッドはトレンドの方向に重ねられます。 特定のフィボナッチ レベルで、トレンドの方向に指値注文が出されます。 注文には次のレベルが利用可能です。 23.6 38.2 50.0 61.8 78.6 ストップロスは Fibo レベル 100 に設定されるか、アドバイザー設定でユーザーによって指定されます。 利食いは Fibo レベル 0 に設定されるか、アドバイザー設定でユーザーによって指定されます。 MT4のバージョン   https://www.mql5.com/ja/market/product/113060 設定: Lot Size   - ロットサイズ TakeProfit    - 固定TPを選択した場合のテイクプロフィット値。 0 - TP を無効にする TP Type   - 利益確定タイプ: 固定またはフィボ 0 StopLoss   - 固定回線を選択する場合のストップロス値。 0 - 幹線切断 SL Type   - ス
FREE
News Robot MT4
Andrey Tatarinov
4.48 (42)
News Robot 4.0 経済ニュースの発表中、発表後の最初の1分だけで価格が数十ポイントを超えることがあります。 急速に変化する相場や最新のニュースリリース指標に迅速に対応することが難しいため、ボラティリティが高いときに手動で取引することは非常に危険です。 ニュースに基づいて取引するには、事前にシナリオを準備し、最大のリスクを規定する必要があります。 専門のプロロボットを使用してニュースを取引します。     News Robot  は、未決注文と成行注文の両方を使用してニュース取引戦略を実装します。 未決のストップ注文を使用する戦略は、ニュースに基づいて取引する場合の古典です。 データがリリースされる直前に、 buy-stop と sell-stop の注文が出されます。 EA は、実際のデータが現在の価格から特定のレベルでリリースされるまで注文を保留できます。 取引は 1 つの注文または注文のグリッドによって実行されます。 成行注文戦略では、最新のニュースリリースデータに基づいて取引できます。 事前にデータを分析し、取引シナリオを作成する必要があります。 N
このインジケーターは、チャート上の重要なテクニカル レベルを表示します。 これらのレベルは、価格変動のサポートまたはレジスタンスとして機能します。 最も重要なレベルは 100 ポイントと 50 ポイントの倍数です。 レベルを 25 ポイントの倍数で表示することもできます。 価格がそのレベルに達すると、アラートまたはプッシュ通知が表示されます。 MT4のバージョン https://www.mql5.com/ja/market/product/69486 設定 Show Levels 100 pips - レベルを 100 pips の倍数で表示します。 Show Levels 50 pips - レベルを 50 ピップスの倍数で表示します Show Levels 25 pips - レベルを 25 ピップの倍数で表示します Color Levels 100 pips - 100 ピップで割り切れるレベルの線の色 Color Levels 50 pips - 50 ピップスで割り切れるレベルの線の色 Color Levels 25 pips - 25 ピップで割り切れるレベル
FREE
アドバイザーはトレンドに合わせてトレードします。 トレンドの方向はジグザグインジケーターによって決定されます。 フィボナッチ グリッドはトレンドの方向に重ねられます。 特定のフィボナッチ レベルで、トレンドの方向に指値注文が出されます。 注文には次のレベルが利用可能です。 23.6 38.2 50.0 61.8 78.6 ストップロスは Fibo レベル 100 に設定されるか、アドバイザー設定でユーザーによって指定されます。 利食いは Fibo レベル 0 に設定されるか、アドバイザー設定でユーザーによって指定されます。 MT5のバージョン https://www.mql5.com/ja/market/product/113194 設定: Lot Size - ロットサイズ TakeProfit  - 固定TPを選択した場合のテイクプロフィット値。 0 - TP を無効にする TP Type - 利益確定タイプ: 固定またはフィボ 0 StopLoss   - 固定回線を選択する場合のストップロス値。 0 - 幹線切断 SL Type - ストップロス タイプ:
FREE
親愛なる友人、ご清聴ありがとうございました。 異なる通貨ペアの動きが相互に関連していることを観察したい場合は、インジケーター   Visual Correlation   に注目してください。 異なる通貨ペアの動きは相互に関連しています。   Visual Correlation   インジケーターを使用すると、スケールを維持しながら 1 つのチャート上にさまざまな金融商品を表示できます。 正の相関、負の相関、または相関なしを定義できます。 親愛なる友人、あなたは、いくつかの楽器が他の楽器よりも先に動くことをご存知でしょう。 このような瞬間は、グラフを重ね合わせることで判断できます。 親愛なる友人へ、チャート上に商品を表示するには、Symbol フィールドに商品名を入力する必要があります。 Version for MT4  https://www.mql5.com/ja/market/product/33063
FREE
親愛なる友人、ご清聴ありがとうございました。 異なる通貨ペアの動きが相互に関連していることを観察したい場合は、インジケーター Visual Correlation に注目してください。 異なる通貨ペアの動きは相互に関連しています。 Visual Correlation インジケーターを使用すると、スケールを維持しながら 1 つのチャート上にさまざまな金融商品を表示できます。 正の相関、負の相関、または相関なしを定義できます。 親愛なる友人、あなたは、いくつかの楽器が他の楽器よりも先に動くことをご存知でしょう。 このような瞬間は、グラフを重ね合わせることで判断できます。 親愛なる友人へ、チャート上に商品を表示するには、Symbol フィールドに商品名を入力する必要があります。 Version for MT5  https://www.mql5.com/ja/market/product/109155
FREE
このインジケーターは、チャート上の重要なテクニカル レベルを表示します。 これらのレベルは、価格変動のサポートまたはレジスタンスとして機能します。 最も重要なレベルは 100 ポイントと 50 ポイントの倍数です。 レベルを 25 ポイントの倍数で表示することもできます。 価格がそのレベルに達すると、アラートまたはプッシュ通知が表示されます。 MT5用バージョン https://www.mql5.com/ja/market/product/69740 設定 Show Levels 100 pips - レベルを 100 pips の倍数で表示します。 Show Levels 50 pips - レベルを 50 ピップスの倍数で表示します Show Levels 25 pips - レベルを 25 ピップの倍数で表示します Color Levels 100 pips - 100 ピップで割り切れるレベルの線の色 Color Levels 50 pips - 50 ピップスで割り切れるレベルの線の色 Color Levels 25 pips - 25 ピップで割り切れるレベル
FREE
The Expert Advisor opens orders using Stochastic Oscillator . All parameters can be customized and optimized. The EA features three strategies for working with the oscillator: Open deals when the main indicator reaches oversold/overbought levels. Open deals when the main line forms a reversal pattern within oversold/overbought areas. Open deals when the main and signal lines intersect within oversold/overbought areas. The number of buy and sell orders opened simultaneously is set separately. Thi
AVT RSI EA
Andrey Tatarinov
5 (1)
エキスパートアドバイザーは、古典的な指標である相対力指数(RSI)に基づいています この指標に関する3つの作業戦略が実施されました。 買われ過ぎ/売られ過ぎのレベルに達したときに直接取引を開始します。 買われ過ぎ/売られ過ぎゾーンのインディケータチャートに反転パターンが形成されたときに取引を開始します。 インジケーター値が買われ過ぎ/売られ過ぎのゾーンから戻ったときに取引を開始します。 同時に開かれる買い注文と売り注文の数は別々に設定されます。このおかげで、EAはトレンドの方向にしか使用できません。また、資金管理、トレーリングストップ、移動平均によるフィルター、損益分岐点への注文の撤回、通知の機能を実装しました。 Expert Advisorは、4桁と5桁の引用符を自動的に認識します。 パラメータの説明 Money management   -お金の管理のパラメータ UseMoneyManagement-固定ロットまたは残高のパーセンテージを使用します。 Lot -FixedLotが選択されている場合のロットサイズ Percent -ロットを計算するためのパーセンテージ
The Expert Advisor is based on the indicator - DeMarker . The Demark indicator was developed by Thomas R. Demark. Demark tried to create an overbought / oversold indicator, which would not have most of the shortcomings of the traditional indicators, the purpose of which was to identify the potential minimums and maximums of the market, based on the demand for the asset and an indication of the extent of riskiness of buying and selling the asset in the current situation. The EA implements two str
The advantage of the Price Surfing indicator is the search algorithm for the extremes of the price of the instrument. Most indicator signals are located at local maximums and minimums of the price . For the convenience of the trader, the potential profit of each signal is displayed on the chart. The indicator does not repainting, the signal appears after the bar is closed. MT5 version  https://www.mql5.com/en/market/product/47179 Parameters SendAlert - enable alert of a new signal SendEMail - e
Trend Hunter は、外国為替、仮想通貨、CFD 市場におけるトレンド指標です。 このインジケーターの特別な特徴は、価格がトレンドラインをわずかに突き抜けたときにシグナルを変更することなく、自信を持ってトレンドに従うことです。 インジケーターは再描画されず、バーが閉じた後に市場に参入するシグナルが表示されます。 トレンドに沿って移動すると、インジケーターにはトレンドの方向に追加のエントリーポイントが表示されます。 これらのシグナルに基づいて、小さなストップロスで取引できます。 トレンドハンターは正直な指標です。 インジケーター信号の上にマウスを置くと、信号の潜在的な利益と可能なストップが表示されます。 新しい信号が表示されると、次の通知を受け取ることができます。 アラート プッシュ通知 メールによる通知 電報での通知 チャートのスクリーンショットも Telegram に送信されるため、取引を決定するために端末を開く必要はありません。 インジケーターシグナルは、電報チャネル https://www.mql5.com/ja/market/product/11085
The advantage of the Price Surfing indicator is the search algorithm for the extremes of the price of the instrument. Most indicator signals are located at  local maximums  and  minimums  of the price . For the convenience of the trader, the potential profit of each signal is displayed on the chart. The indicator does not repainting, the signal appears after the bar is closed. MT4 version  https://www.mql5.com/en/market/product/46054 Parameters SendAlert - enable alert of a new signal SendEMail
EAはストキャスティクスオシレーターインジケーターに基づいて注文を開始します。すべてのインジケーターパラメーターを構成および最適化できます。 EAは、このインジケーターを操作するための2つの戦略を実装しています。 インディケータのメインラインが買われ過ぎ/売られ過ぎのレベルに達するとすぐに取引を開始します。 買われ過ぎ/売られ過ぎゾーンのインジケーターチャートのメインラインによって反転パターンが形成されたときに取引を開始します。 同時に開かれる買い注文と売り注文の数は別々に設定されます。このおかげで、EAはトレンドの方向にしか使用できません。 オプション TRADING TIME -取引時間管理 UseTradingTime -取引時間を有効にする TimeStartTrading -取引開始時間 TimeEndTrading -取引終了時間 MONEY MANAGEMENT -お金の管理パラメータ Lot   -ロットサイズ MaxBuyOrders -同時に開いている買いポジションの最大数 MaxSellOrders -同時にオープンしている売りポジションの最大数 TAKEP
フィルタ:
ClovisPerniciotti62
29
ClovisPerniciotti62 2022.06.14 13:17 
 

Indicador muito bom , segue a tendência do mercado com muita precisão . Eu recomendo à todos os traders.

Peter Maggen
1092
Peter Maggen 2021.11.02 14:12 
 

The problem is that trend changes like the wind. It's a good CCI based trend system. Nice programming too. Congrats. But one need more skills to win from the matket.

Andrey Tatarinov
24000
開発者からの返信 Andrey Tatarinov 2021.11.02 14:23
Thanks!
I am constantly improving the indicator and expanding its functionality.
Indicator signals are not based on oscillators.
Best regards
phisit_jn
162
phisit_jn 2021.07.24 14:00 
 

Ok good

95M51fa
20
95M51fa 2021.07.14 08:48 
 

Excellent indicator, nice work!

Aravind Kolanupaka
8890
Aravind Kolanupaka 2021.03.19 16:25 
 

Very Good, specially with the new update this indicator is just what every one needs.

weesoh88
658
weesoh88 2021.03.17 04:02 
 

This is one of the best trend indicators in the market. The author takes pride in his work by constantly improving it. The latest version (3.0) has a very informative and easy-to-use interface. Love it!

Yocrz
304
Yocrz 2020.11.04 09:19 
 

good indicator, well done!

cascav11
23
cascav11 2020.04.13 21:25 
 

Have had great success with the Trend Hunter indicator! I recommend this indicator to people who want clear and efficient trades.

Ntshauba Elikana
49
Ntshauba Elikana 2018.11.19 16:42 
 

superb indicator i have ever meet!!!!!

since i bought this indicator around mid year i make a lot of profit that i manage to cover many things, now im on the way of building my 15 room house. i dont know how i can thank you Andrey Tatarinov.

hkarram
288
hkarram 2018.09.17 20:18 
 

Excellent indicator for trending markets ....... best to be used with H4 ..... it needs other filters of course for exact entry after a correction ....... be careful when you enter a side way territory ..... it will not work well .. but it will appear as a horizontal line and not trending up or down ......... five stars for sure

sunnychow
8902
sunnychow 2018.03.10 16:51 
 

The Signal is good, but you should confirm the support and resistance firstly.

dimonatal
193
dimonatal 2017.11.21 16:43 
 

Отличная работа Андрея! Индикатор очень хорош, а советник представляет большие возможности для оптимизации и мультивалютных торгов.

Danis Khaziakhmetov
246
Danis Khaziakhmetov 2017.11.02 15:20 
 

ユーザーは評価に対して何もコメントを残しませんでした

Berk Turker
417
Berk Turker 2017.08.26 18:35 
 

Very good indicator. Very helpful

Farooq Majoka
1817
Farooq Majoka 2017.07.25 21:13 
 

I have been trading since August 1991 and have been working and testing automated systems since 1995. I have liked. Tatarinov's product incredibly well. More so because the price is very very affordable and the EA bundled with it for free makes the use of Trend Hunter breeze...

Many thanx for this Indi and the free EA brother Tatarinov.. I find the signals from the Indi very helpful and ea makes life so easy for me!

Oleg Poliakov
534
Oleg Poliakov 2016.12.28 18:45 
 

Индикатор работает четко, можно добавить еще фильтр на ваше усмотрение. Спасибо автору за техподдержку и за работу. Пять звезд.

purelife173
41
purelife173 2016.10.17 02:37 
 

8/23/2016 - 3 stars

This indicator is great for slower traders however when it comes to sideways price action the indicator tends to oscillate between up and down. In my opinion that's a pretty black and white way to look the market prices because prices move up down and sideways. I rather make no trades than trade every potential set up. With that being said a sideways parameter would increase the chances of trading with the trend and thus a higher chance of winning.

Another thing, don't expect to catch many 200+ pip moves or the big profits to cover the number of losses on false trends(too many false trends). To test this i created an EA to buy and sell on the indicator trend changes in order to see the number of false trends.

I will continue to test this indicator and update this review with my findings

9/5/2016 - 2 stars

This indicator isn't worth buying if your using it for an EA... creating EAs using multiple trend time frames sometimes wouldn't open one trade (i tried setting it to buy only when 1Day is trending up and there's a buy signal on the 5m... if you've tested this indicator you would think it would buy several times but it didn't even buy once however when i change it from 5m to 1hr it did buy???) if you're planning to automate your trading don't bother using this indicator

I should note Andrey does say this indicator was meant for manual trading. I strongly agree and believe this indicator would be great for manual trading! But the dilemma is working smart not hard if i can create an ea that trades for me ill have more time to do other things.

If and when the indicator is updated i will review it again :)

10/16/2016-3 starts

Andrey gave me the update a week or two ago it now works on the daily chart!

11/13/2022 - 4 star

Due to many inquiries about this indicator I'm writing here again. It's a more capable indicator with new functionalities. No I do not use it today but I do use it as a baseline to compare other indicators because it has the right speed and not affected by noise too much.

Emon
562
Emon 2016.08.31 12:44 
 

Very helpful indicator for trend trading and great support. Andrey always answer my questions kindly.

Highly recommended indicator for trend trader.

Richard Jehl
1703
Richard Jehl 2016.08.30 17:23 
 

I like the News Robot by Andrey but I must admit I regret having bought this indicator. There are too many false signals. I did not succeed in finding a good way to filter the entries, even with multitimeframe consideration. I will update the review if I find a satisfying way to use this indicator and/or the robot trading it.

Saulius Urbonavicius
118
Saulius Urbonavicius 2016.08.27 13:22 
 

Spasiba

12
レビューに返信
バージョン 3.3 2023.11.24
- 通知の信号タイプの選択を追加しました
- タイマーのバグを修正
バージョン 3.2 2023.11.06
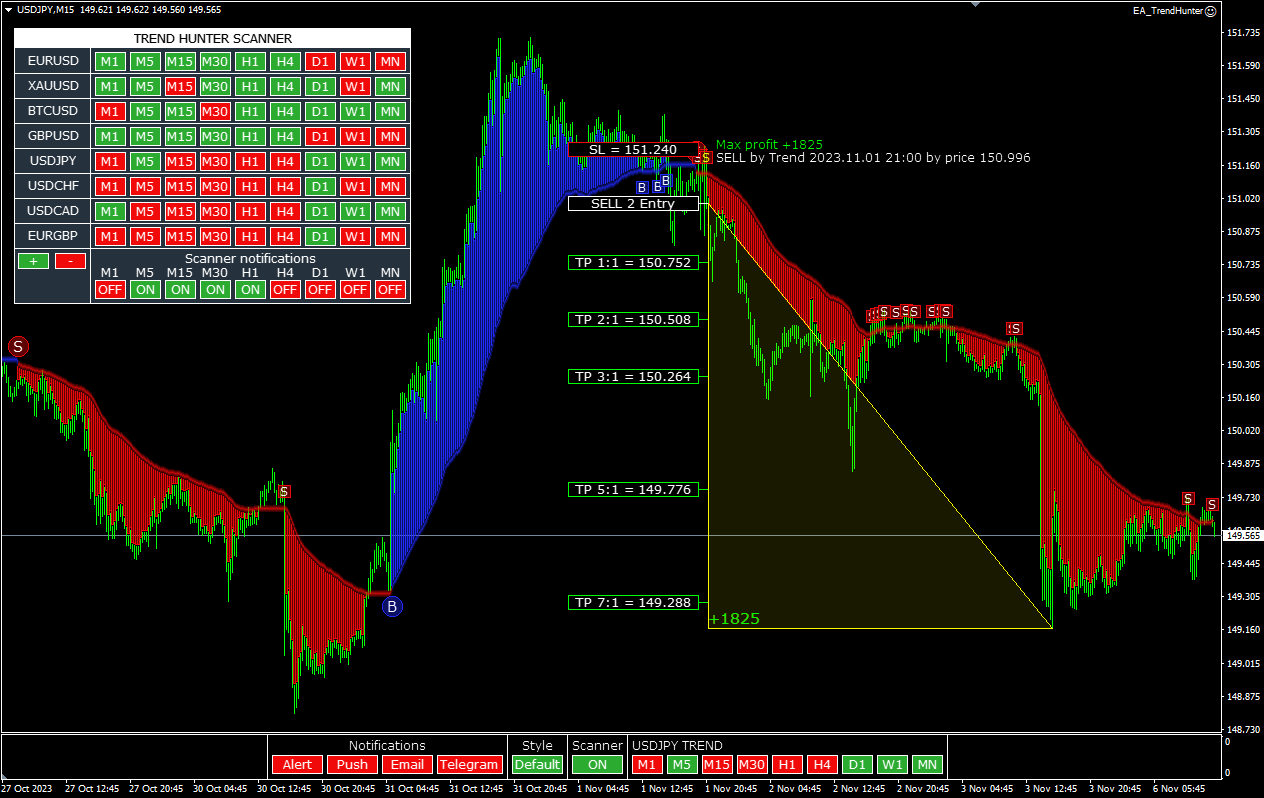
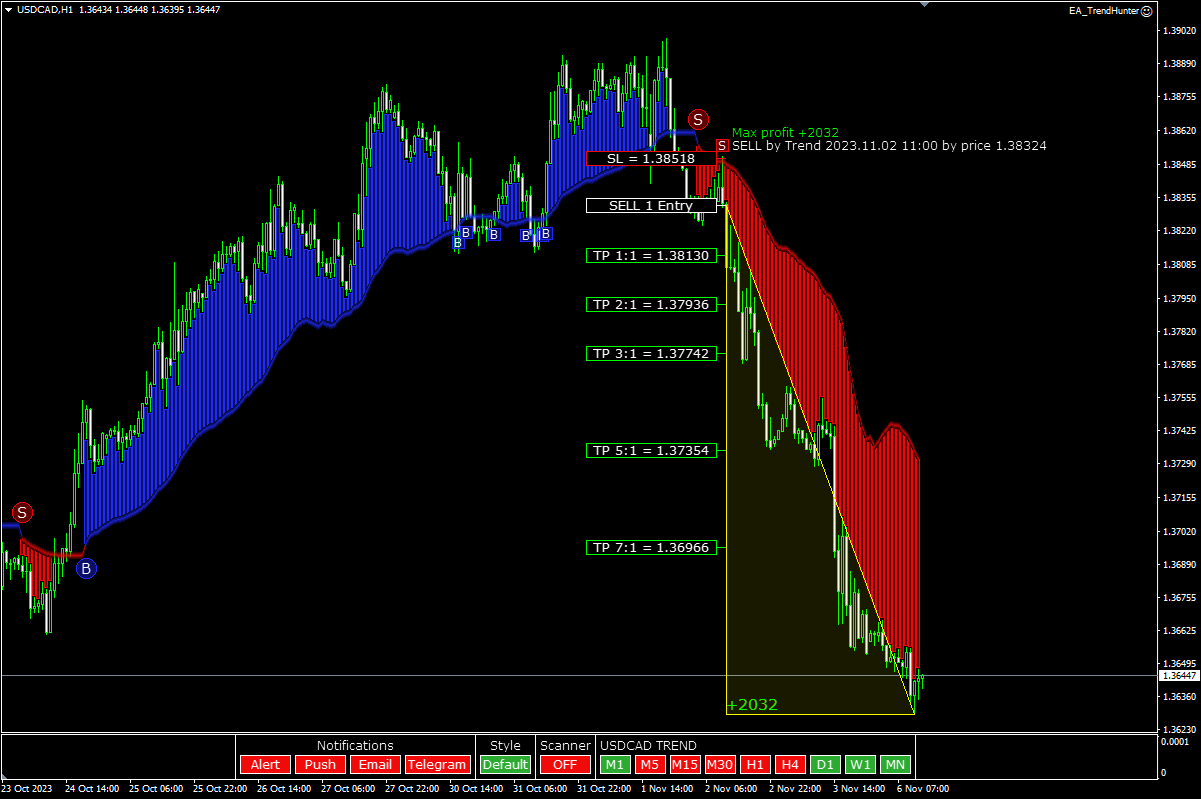
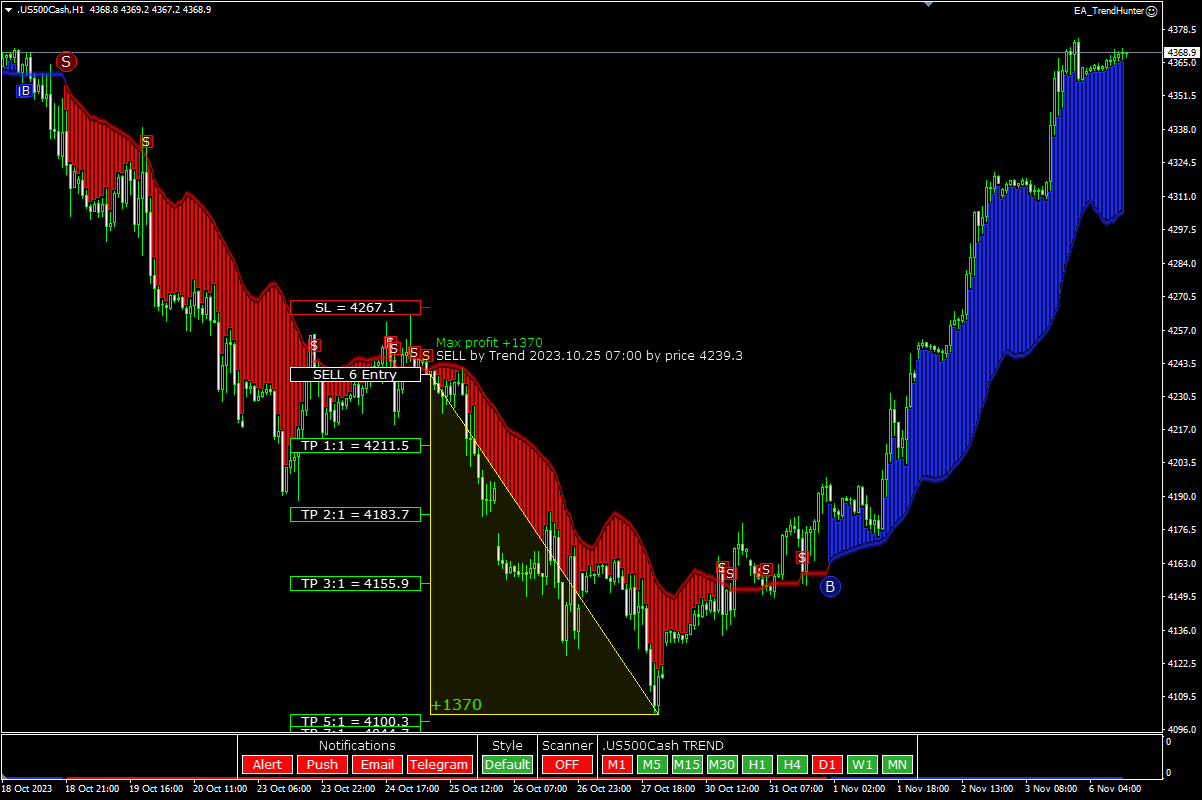
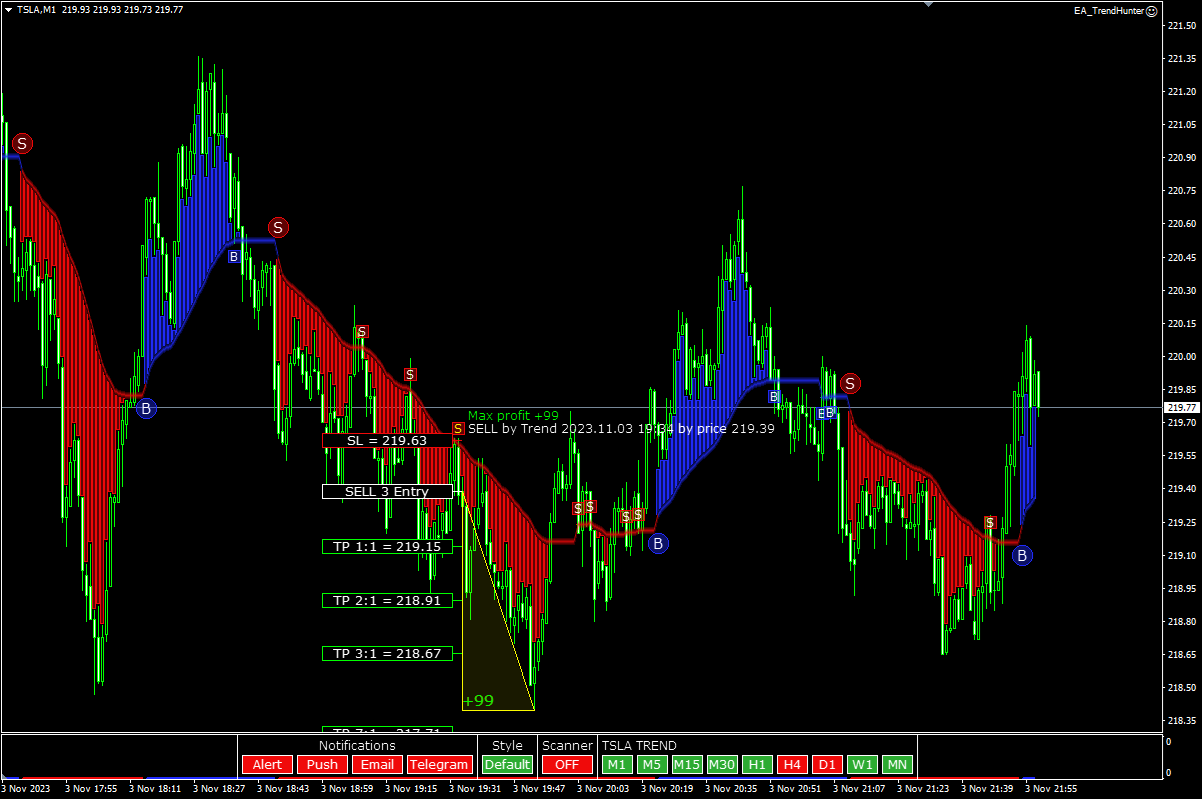
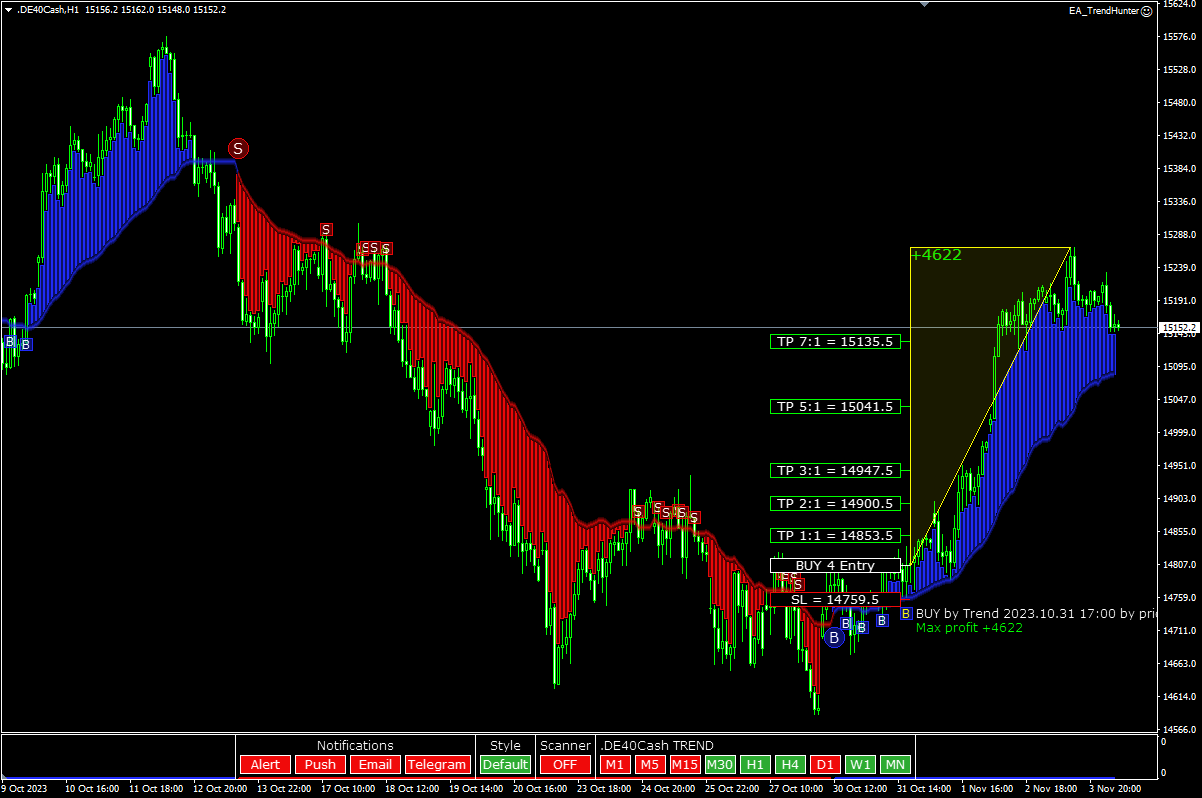
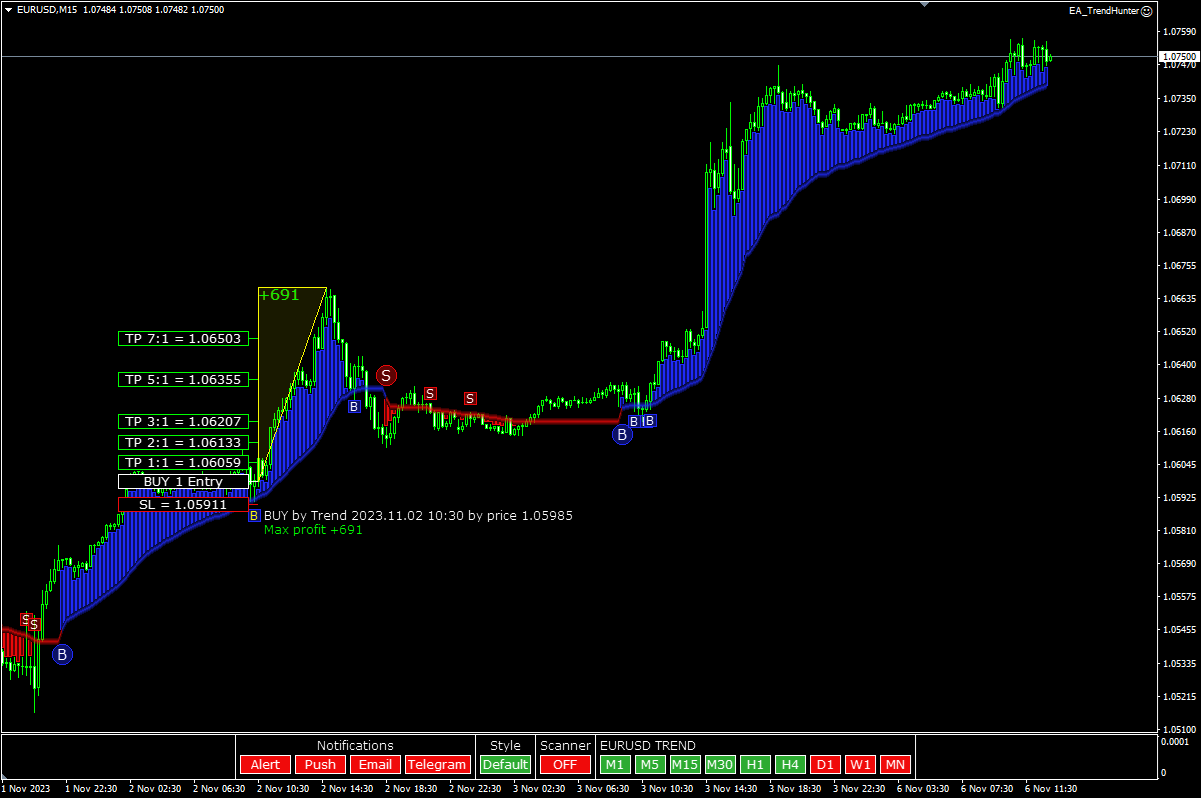
- 最適化された信号。 このインジケーターはあらゆる商品 (通貨ペア、暗号通貨、指数、株式) で機能します。
- 各シグナルに StopLoss、TakeProfit バッファーが追加されました
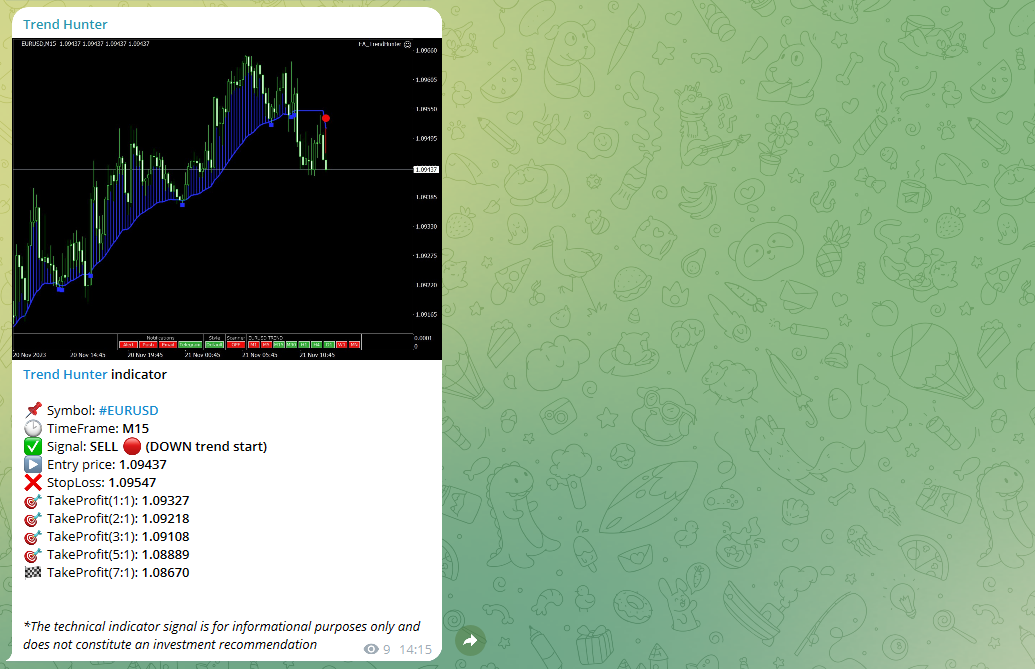
- Telegram チャネルに信号を送信する機能を追加しました
バージョン 3.1 2021.06.30
- code optimization
- Added parameter VisualBars - the number of bars for calculating and visualizing the indicator
バージョン 3.0 2021.03.14
-Updated interface
-Optimized signals
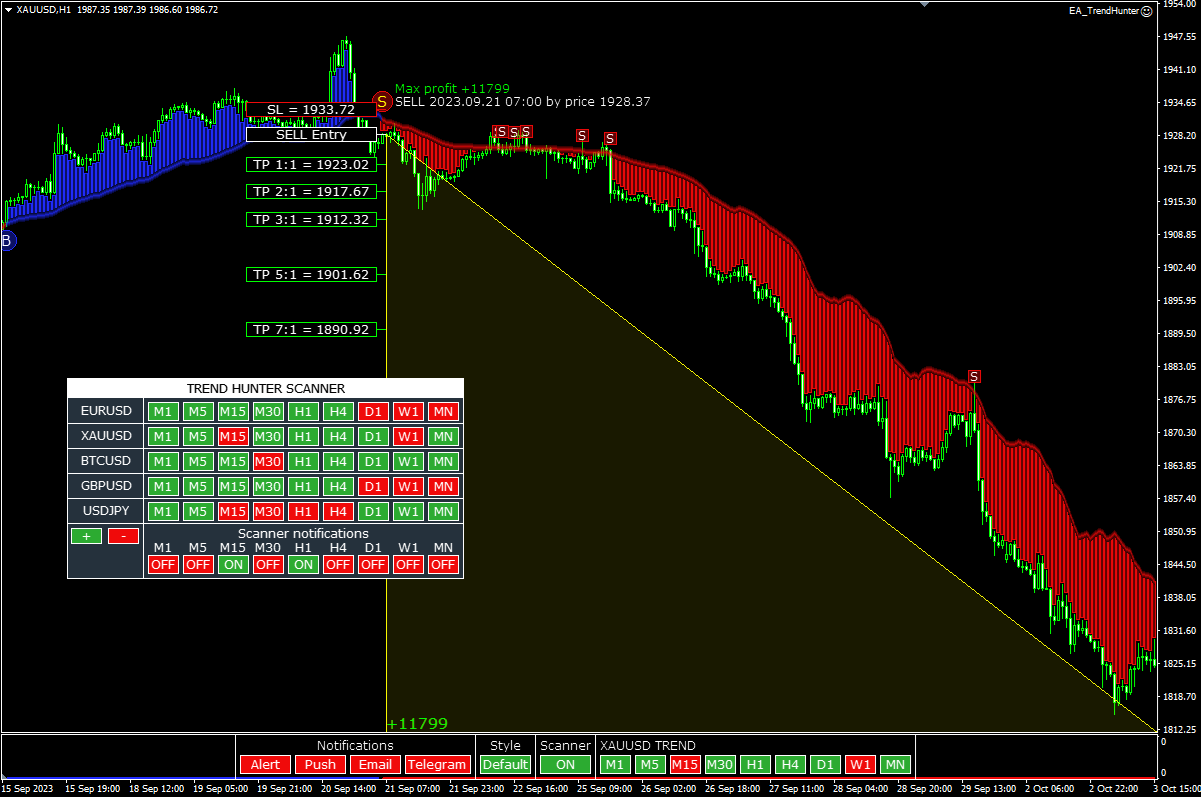
-Added signals for trend trading
-Added a scanner for indicator signals on other currencies and timeframes
バージョン 2.6 2020.04.16
Added support for SPX500, DowJones30, Germany30, HongKong50 indexes
バージョン 2.5 2020.03.15
indicator code optimization
バージョン 2.4 2020.01.21
Added new options
- DownTrendColor - color of the uptrend line and buy arrows
- UpTrendColor - color of the downtrend line and sell arrows
- ArrowSize - arrow size
バージョン 2.3 2018.10.18
Added new options
ProfitPointer - display current profit pointer
ShowHistogram - display of the histogram of the signal
バージョン 2.2 2017.03.06
- Improve the performance of the indicator signals.
- Added the function "MAX PROFIT" - the maximum amount of profit that can be received by opening an order according to the indicator signal. With this feature, you can evaluate the quality of the indicator signals on the history.
バージョン 2.1 2016.03.14
Added an additional indicator buffer storing a value of the profit obtained at the last indicator signal (triangle indicating the profit points).