RMI Indicator
- インディケータ
- Matthias Effler
- バージョン: 1.0
- アクティベーション: 5
The underlying strategy of this indicator is based on identifying momentum in the market and attempting to capture the direction of the trend through transitions between bullish and bearish moments. Utilizing bands around the RWMA allows for identifying potential overbought and oversold situations in the market.
1. Calculation of the Range Momentum Index (RMI):
- The RMI is based on a combination of the Relative Strength Index (RSI) and the Money Flow Index (MFI), both of which are momentum indicators.
- First, changes in the closing price are calculated. Then, positive and negative movements are separately calculated and smoothed using a Recursive Moving Average (RMA).
- This smoothing is a method for reducing noise in the data.
- Subsequently, the RSI and MFI are calculated and averaged to obtain the RMI.
2. Definition of bullish and bearish moments:
- Conditions are defined to identify bullish and bearish moments. These conditions are based on the relationship between the RMI, predefined thresholds (pmom and nmom), and the change in the Exponential Moving Average (EMA) of the closing price.
3. Calculation of the band and the Range Moving Averages (RWMA):
- A custom band is calculated based on the Average True Range (ATR), which is defined around the RWMA. This band serves to define the range around the RWMA.
- The RWMA is calculated by dividing the range (High - Low) of the current candle by a weighted Moving Average (MA) of the closing prices. This is then displayed around the band.
3. Plotting and visualization:
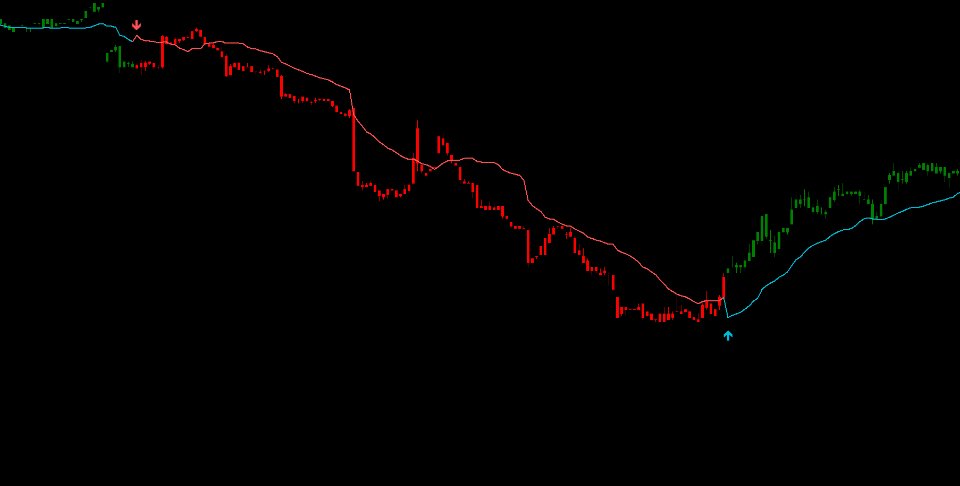
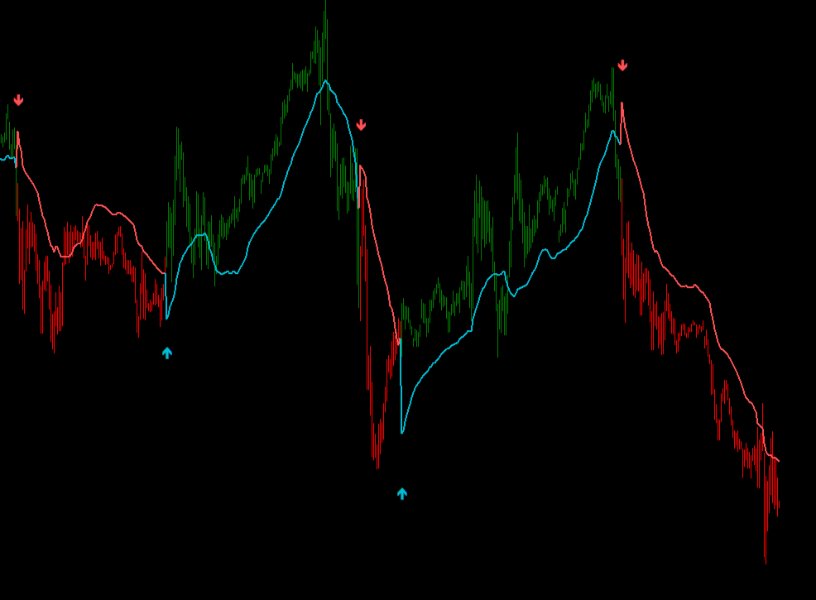
- The RWMA is plotted and colored according to the previously defined bullish and bearish moments.
- In addition, fills are created to mark the range around the RWMA.
- The candlesticks are colored based on the bullish and bearish moments.
4. Trading signals:
- Trading signals are generated when the sign of the RWMA changes. A "BUY" signal is generated when the sign changes from negative to positive, and vice versa for a "SELL" signal.





Well not so bad, but you need to think about upgrading your indicator because false signals and on top of that kindly add signals checklist for someone to follow before taking a trade.