FVG Watcher
- インディケータ
- Crispin Tibilla
- バージョン: 1.0
- アクティベーション: 10
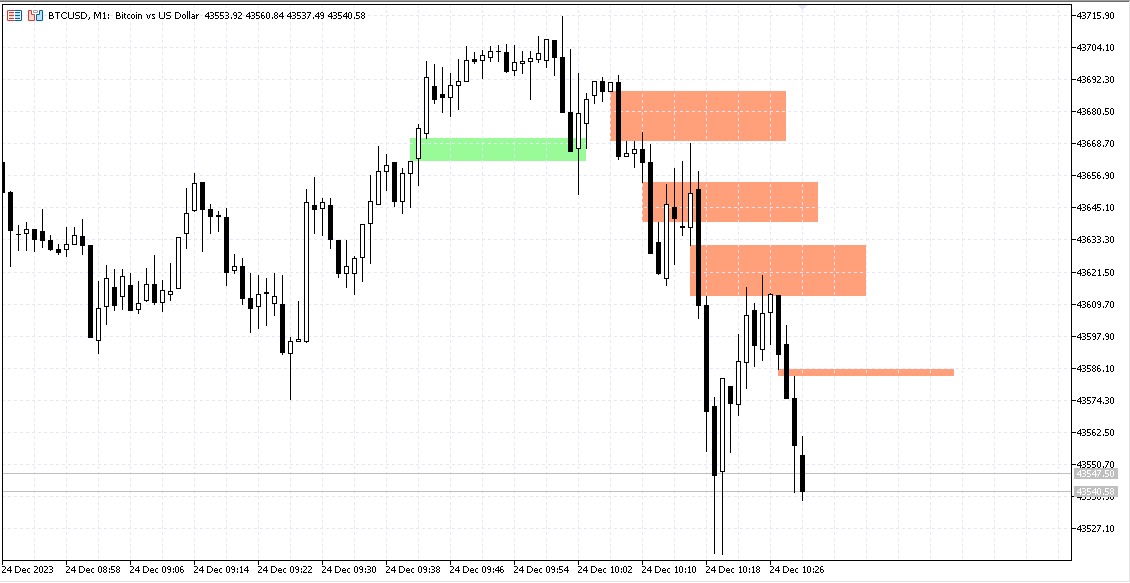
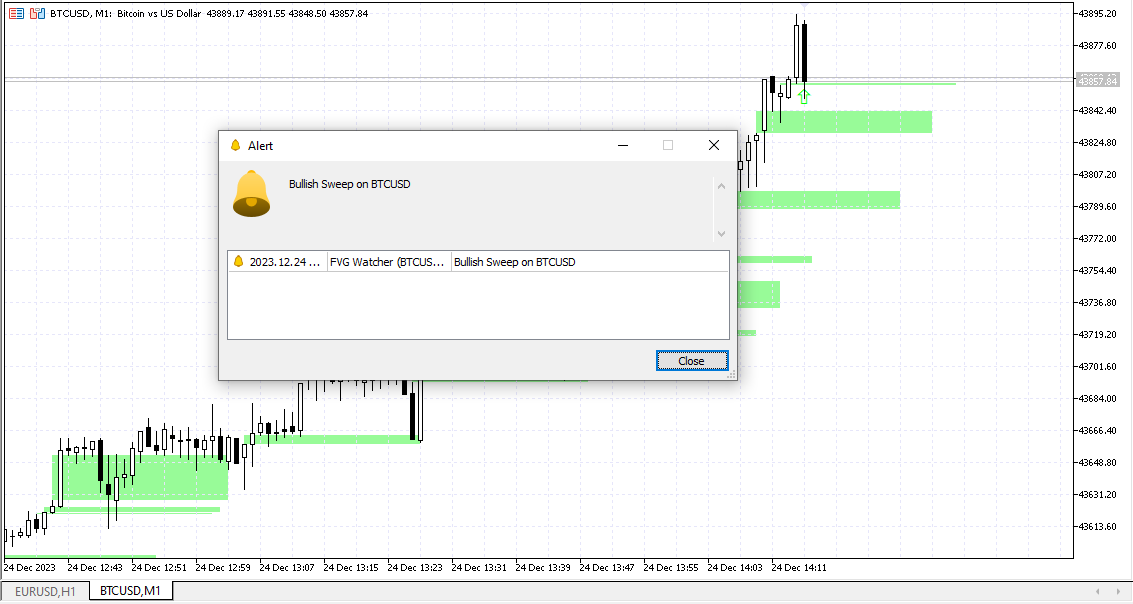
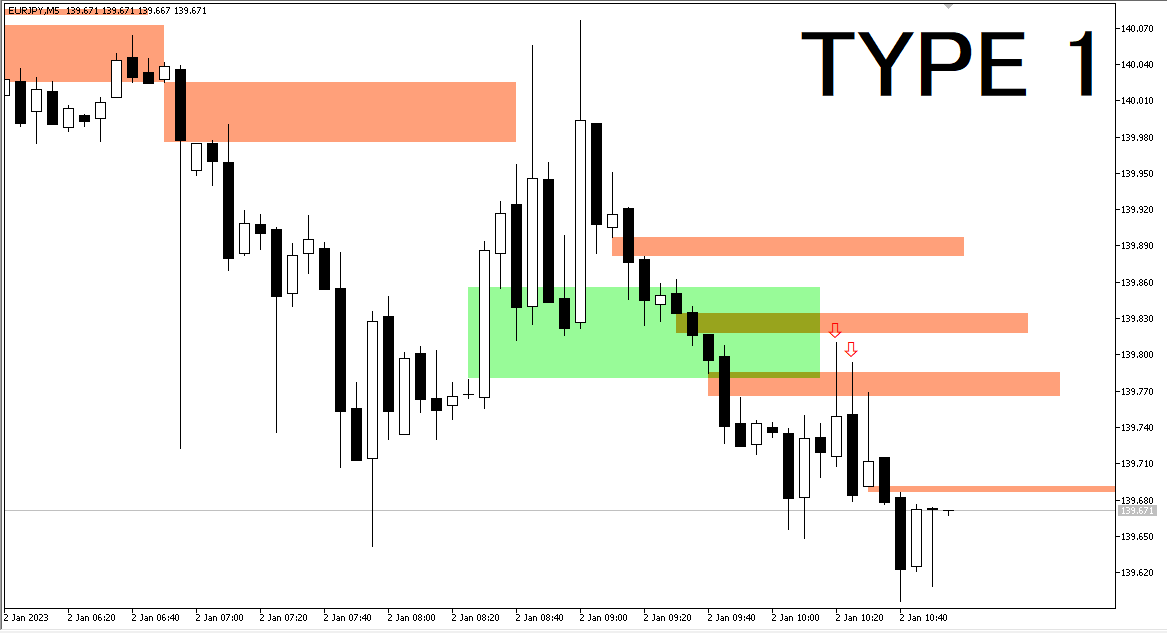
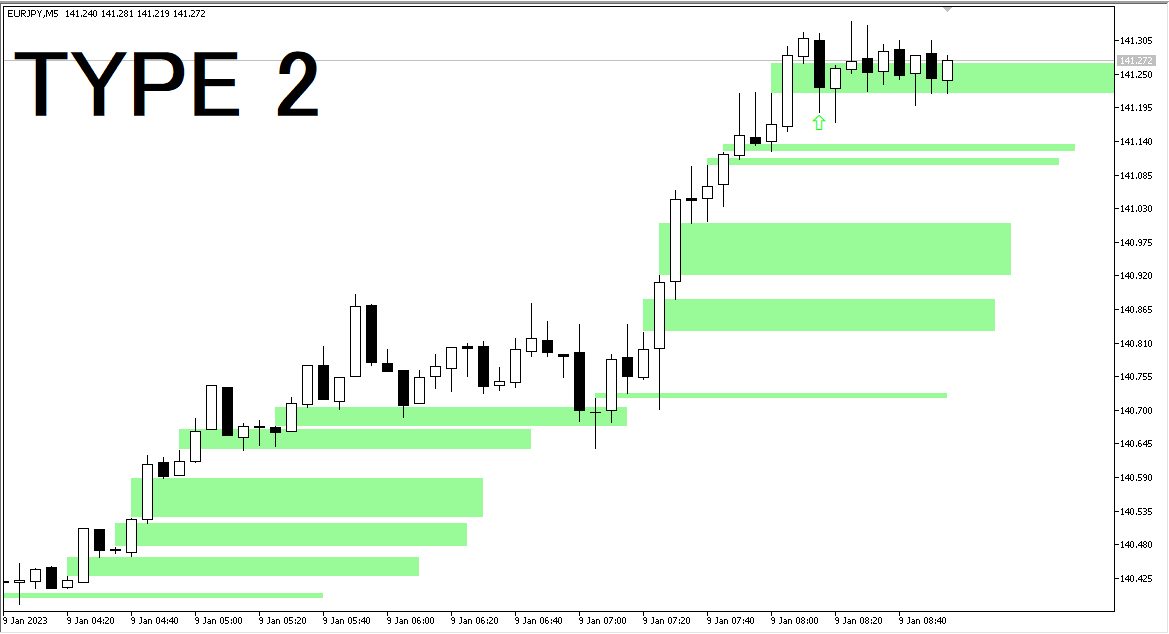
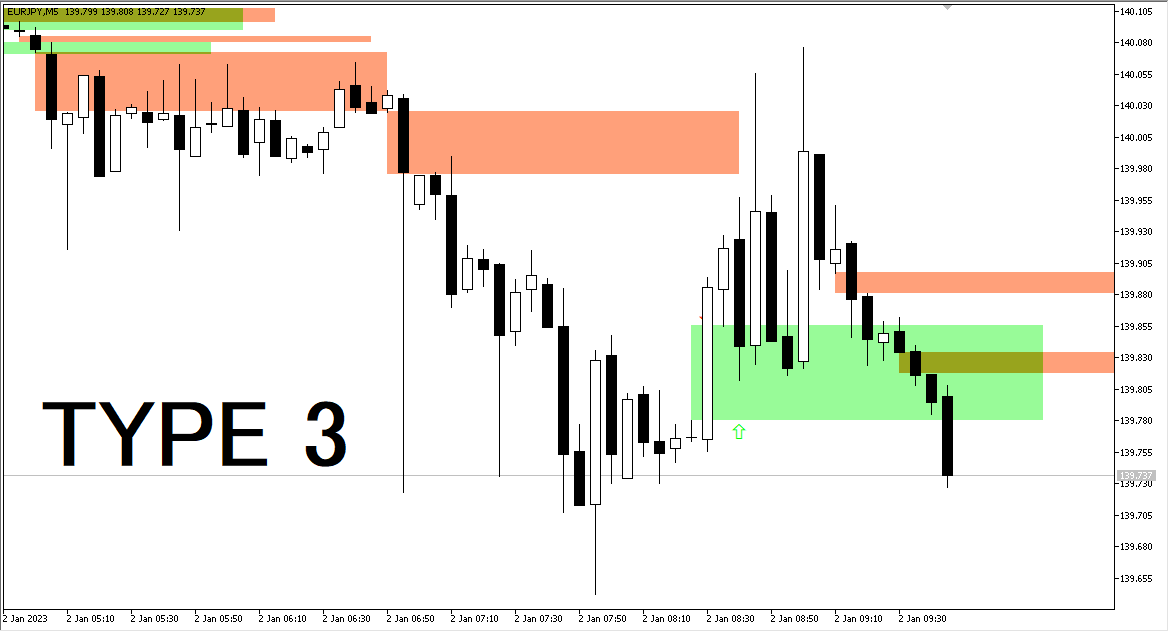
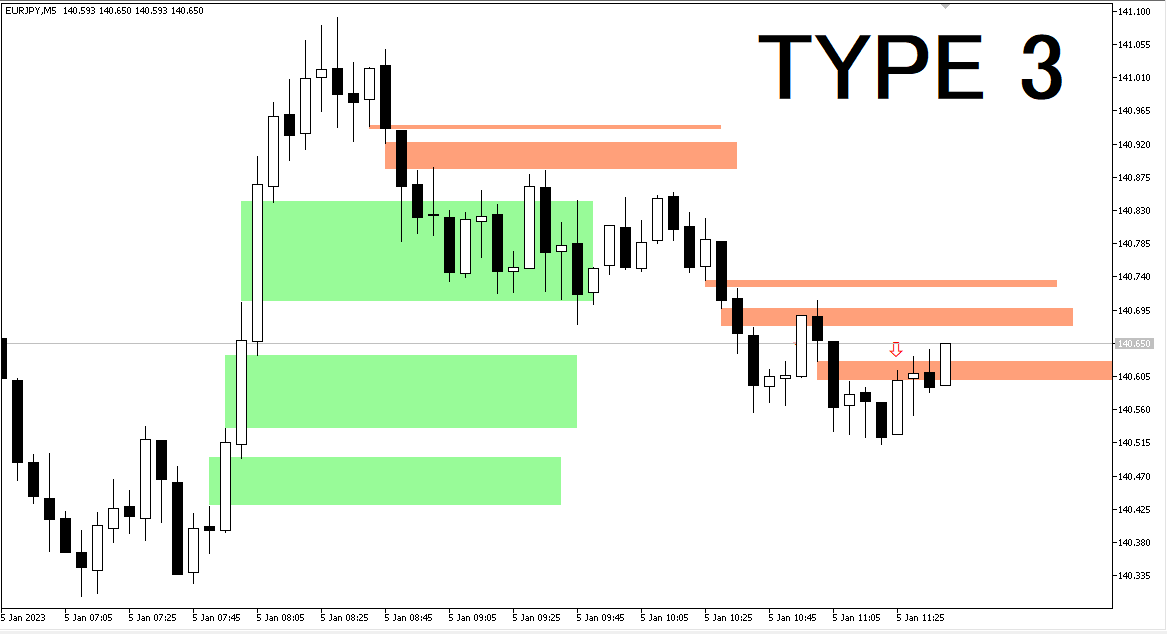
FVG WATCHER is an indicator that helps traders identify fair value gaps in the market. The indicator draws fair value gaps and alerts the user when the fair value gap has been swept.
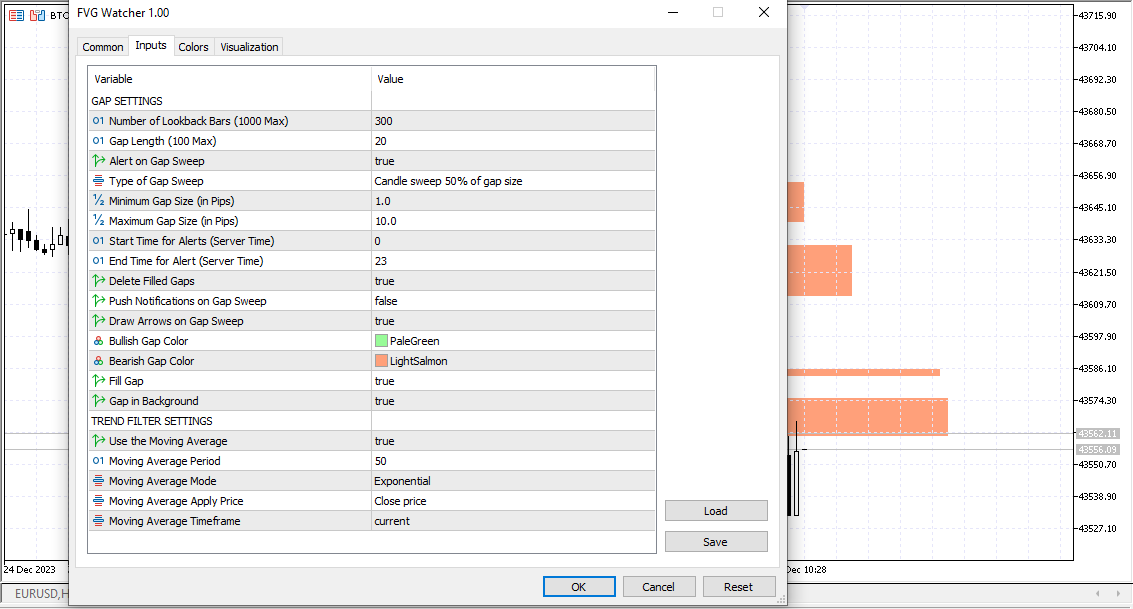
It allows users to specify how it should be swept, what time range to alert, and the size of the fair value gap to alert. It also allows the user to apply a moving average trend filter for better choice of alerts.
The indicator also allows push mobile notifications.
What makes FVG Watcher special is that it can be used together with personal trading strategies for better trading experience