SterlingSniperBot
- エキスパート
- Diego Trigueros Makabe
- バージョン: 1.0
SterlingSniperBot is an advanced trading algorithm meticulously designed for the GBP/USD currency pair, specifically tailored to operate on 4-hour bars and synchronize seamlessly with brokers in the UTC+2 time zone. This sophisticated bot stands out as a precision instrument in the world of forex trading.
Key Features:
-
Timeframe Optimization: Operating exclusively on 4-hour bars, SterlingSniperBot focuses on capturing strategic trading opportunities within this specific time frame, aligning with the unique characteristics of the GBP/USD pair.
-
Market Insight: The bot's decision-making process is initiated during the opening of a new 4-hour bar, where it meticulously analyzes market conditions. Its discerning eye is tuned to rising highs and falling opens, enabling it to identify potential entry points with precision.
-
Strategic Entry Execution: SterlingSniperBot executes long entry signals with surgical precision. It calculates optimal entry, stop-loss, and profit-target prices, leveraging indicators meticulously tuned for the GBP/USD pair. This strategic approach ensures that the bot captures potential upside movements while effectively managing risk.
-
Tailored for GBP/USD: SterlingSniperBot is specifically calibrated for the GBP/USD pair, considering its unique behavior and characteristics. This targeted approach enhances the bot's effectiveness in navigating the intricacies of this particular currency pair.
-
Precision Instrument: The name SterlingSniperBot reflects its character as a precision instrument in forex trading. It embodies accuracy, discipline, and a calculated approach to capitalize on market opportunities.
Traders utilizing SterlingSniperBot benefit from a comprehensive solution that combines strategic trading, precision execution, and risk management excellence, all geared towards maximizing success in the ever-evolving forex market.
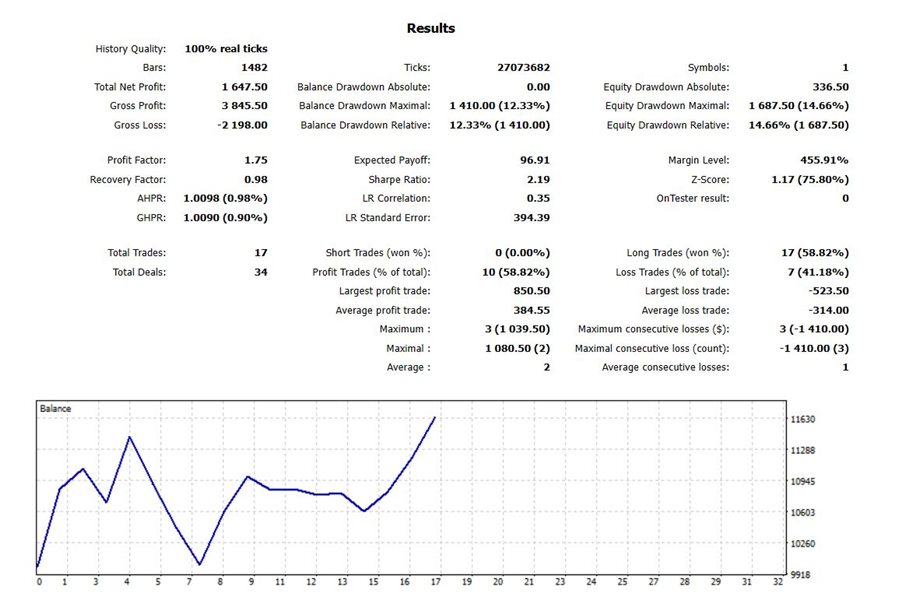
We have tested this strategy from 2010 until 2023 December with UTC+2 broker. with a lot of 0.5 in an account of 10 000 USD.
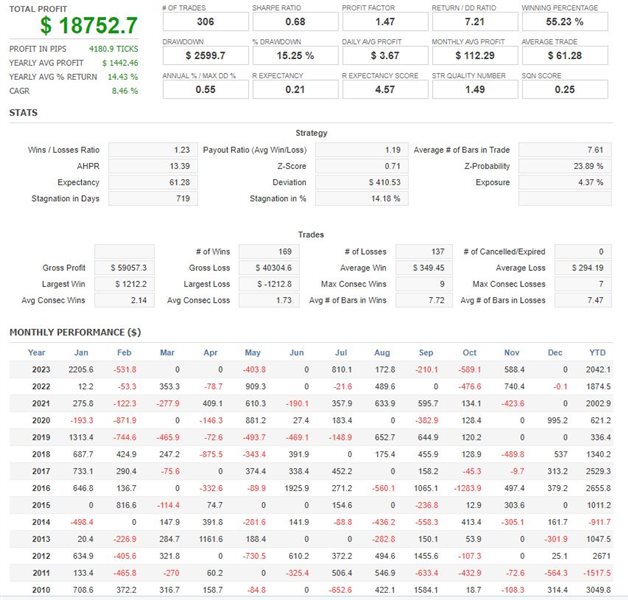
The provided test results reveal the performance metrics of a trading strategy. Here's an analysis of the key statistics , see the screenshots attached:
Profitability:
- Total Profit: $18,752.7
- Profit in Pips: 4,180.9
- Yearly Average Profit: $1,442.46
- Yearly Average % Return: 14.43%
- Compound Annual Growth Rate (CAGR): 8.46%
Trade Metrics:
- Number of Trades: 306
- Winning Percentage: 55.23%
- Profit Factor: 1.47
- Return/Drawdown Ratio: 7.21
Risk and Drawdown:
- Drawdown: $2,599.7
- % Drawdown: 15.25%
Average Profits:
- Daily Average Profit: $3.67
- Monthly Average Profit: $112.29
Trade Size and Expectancy:
- Average Trade: $61.28
- Annual % / Max DD %: 0.55
- R Expectancy: 0.21
- R Expectancy Score: 4.57
Advanced Metrics:
- Sharpe Ratio: 0.68
- SQN Score: 0.25
Trade Analysis:
- Wins/Losses Ratio: 1.23
- Payout Ratio (Avg Win/Loss): 1.19
- Average # of Bars in Trade: 7.61
- Largest Win: $1,212.2
- Largest Loss: -$1,212.8
- Max Consecutive Wins: 9
- Max Consecutive Losses: 7
Expectancy and Exposure:
- Expectancy: $61.28
- Exposure: 4.37%
Stagnation:
- Stagnation in Days: 719
- Stagnation in %: 14.18%
These metrics collectively provide a comprehensive overview of the trading strategy's performance, including its profitability, risk management, and trade characteristics. The strategy demonstrates a positive profit trajectory, albeit with fluctuations, and additional insights can be gained by further examining metrics like the Sharpe Ratio, Expectancy, and trade analysis details.

