SSn Buy Sell Signal
- インディケータ
- Ongkysetiawan
- バージョン: 2.4
- アップデート済み: 16 6月 2024
- アクティベーション: 10
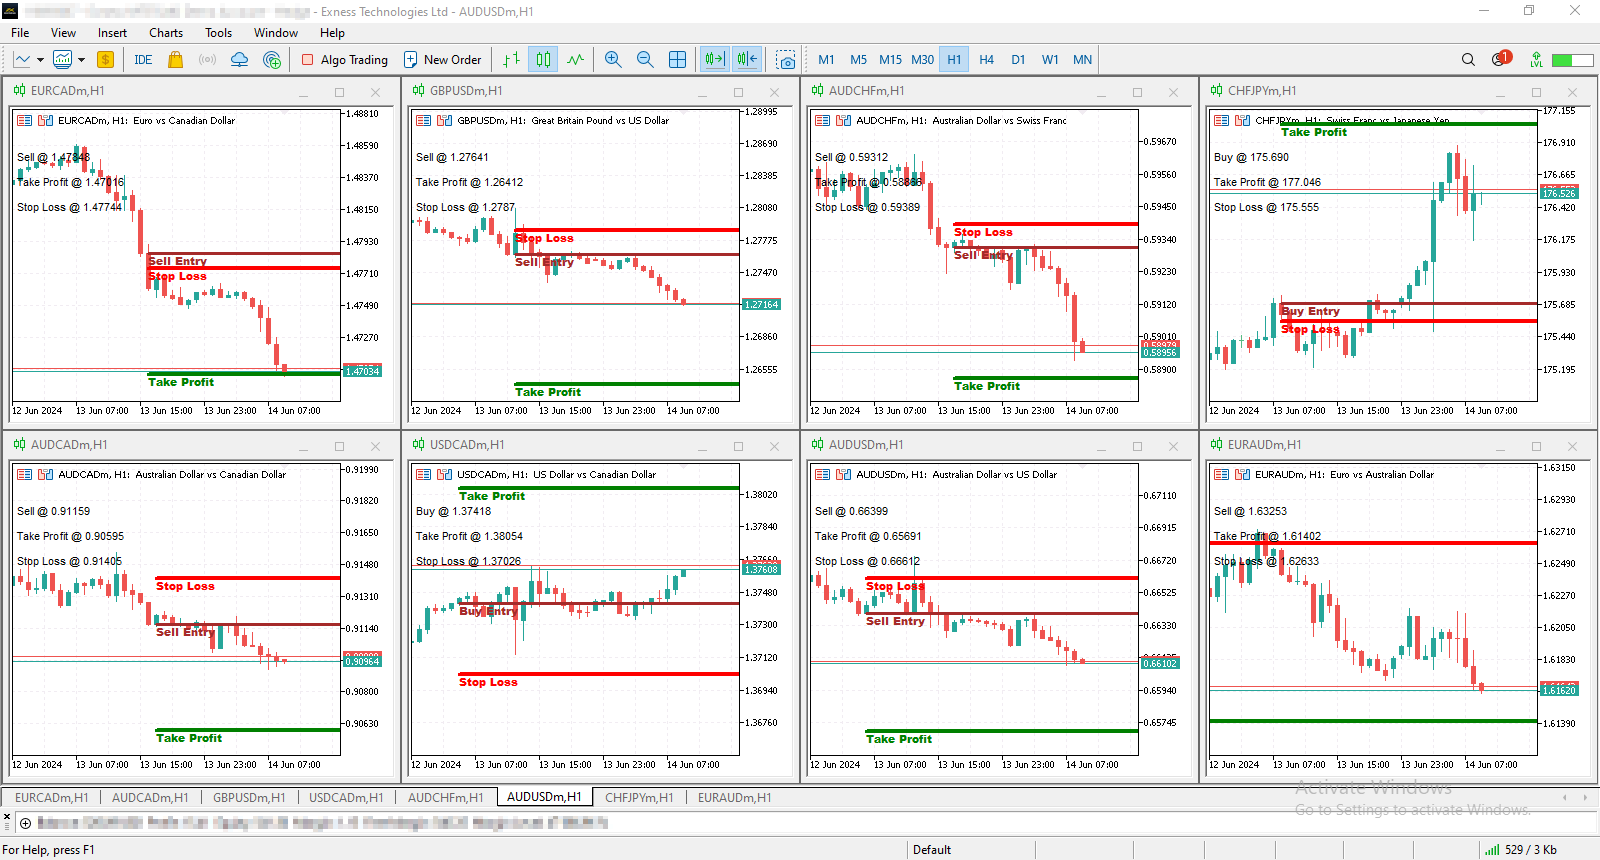
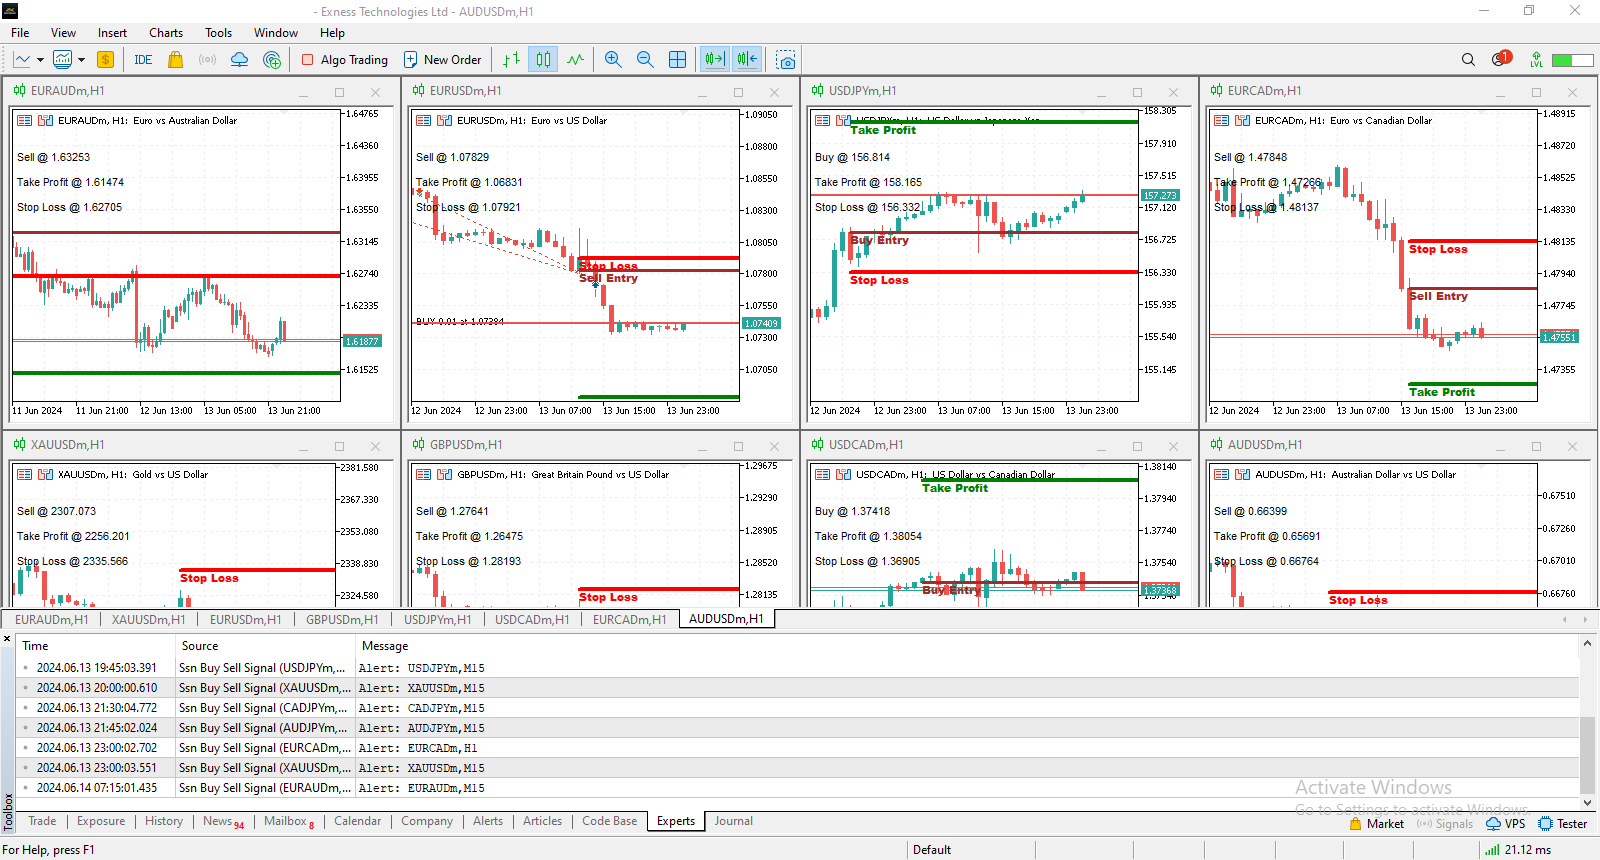
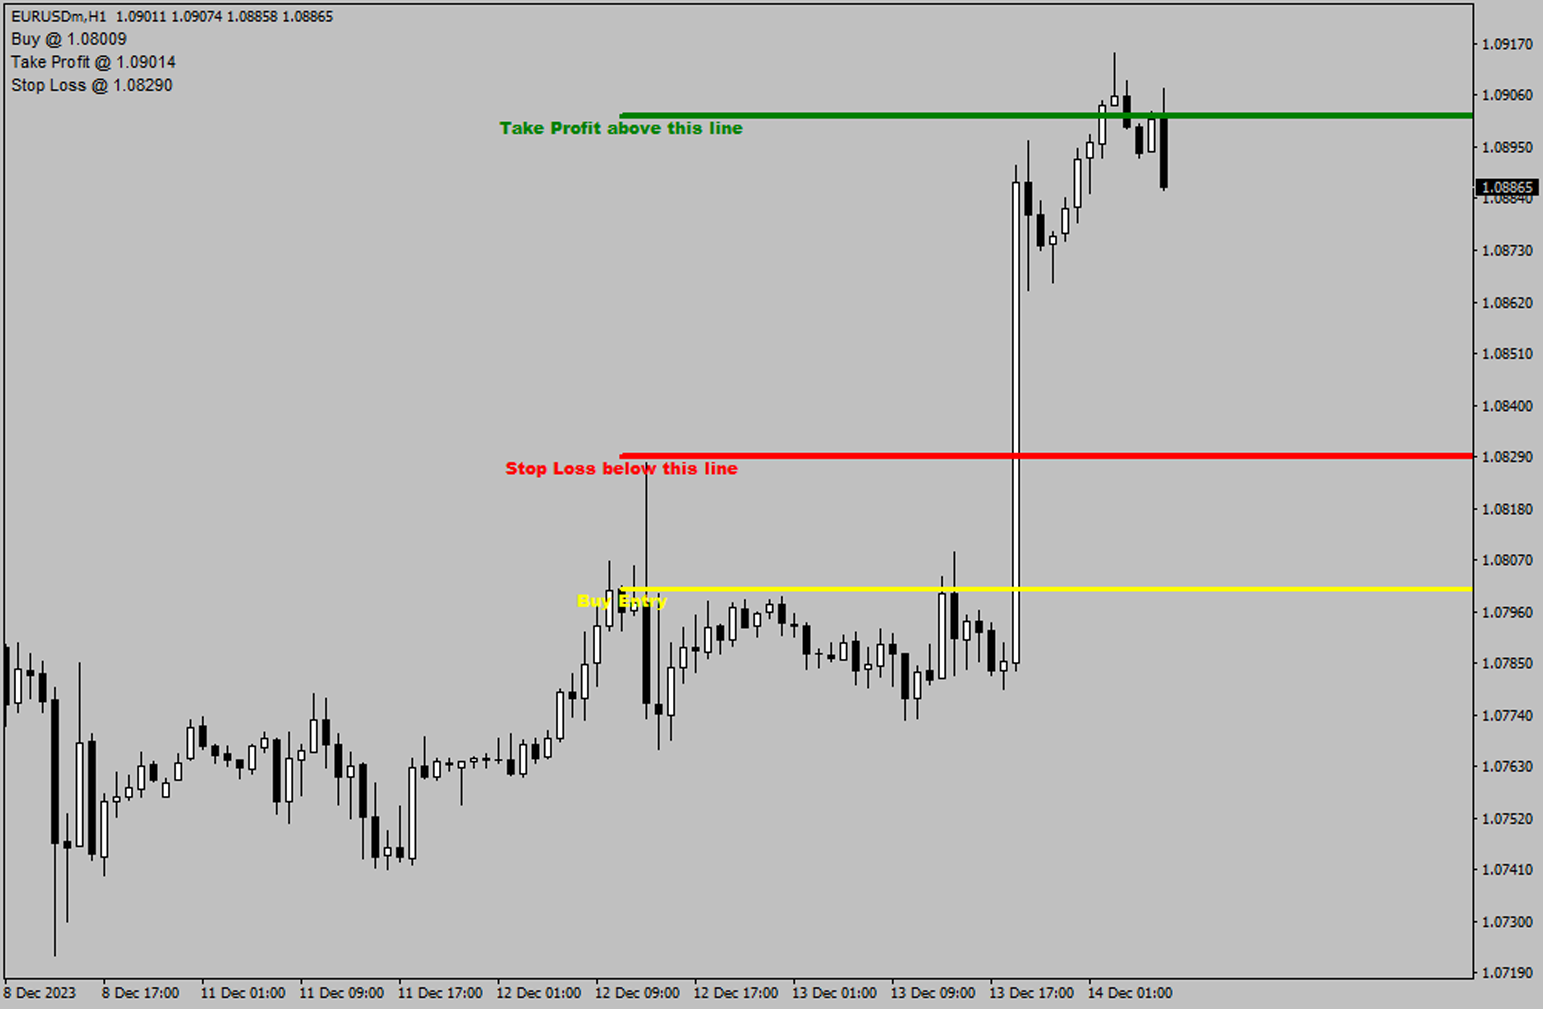
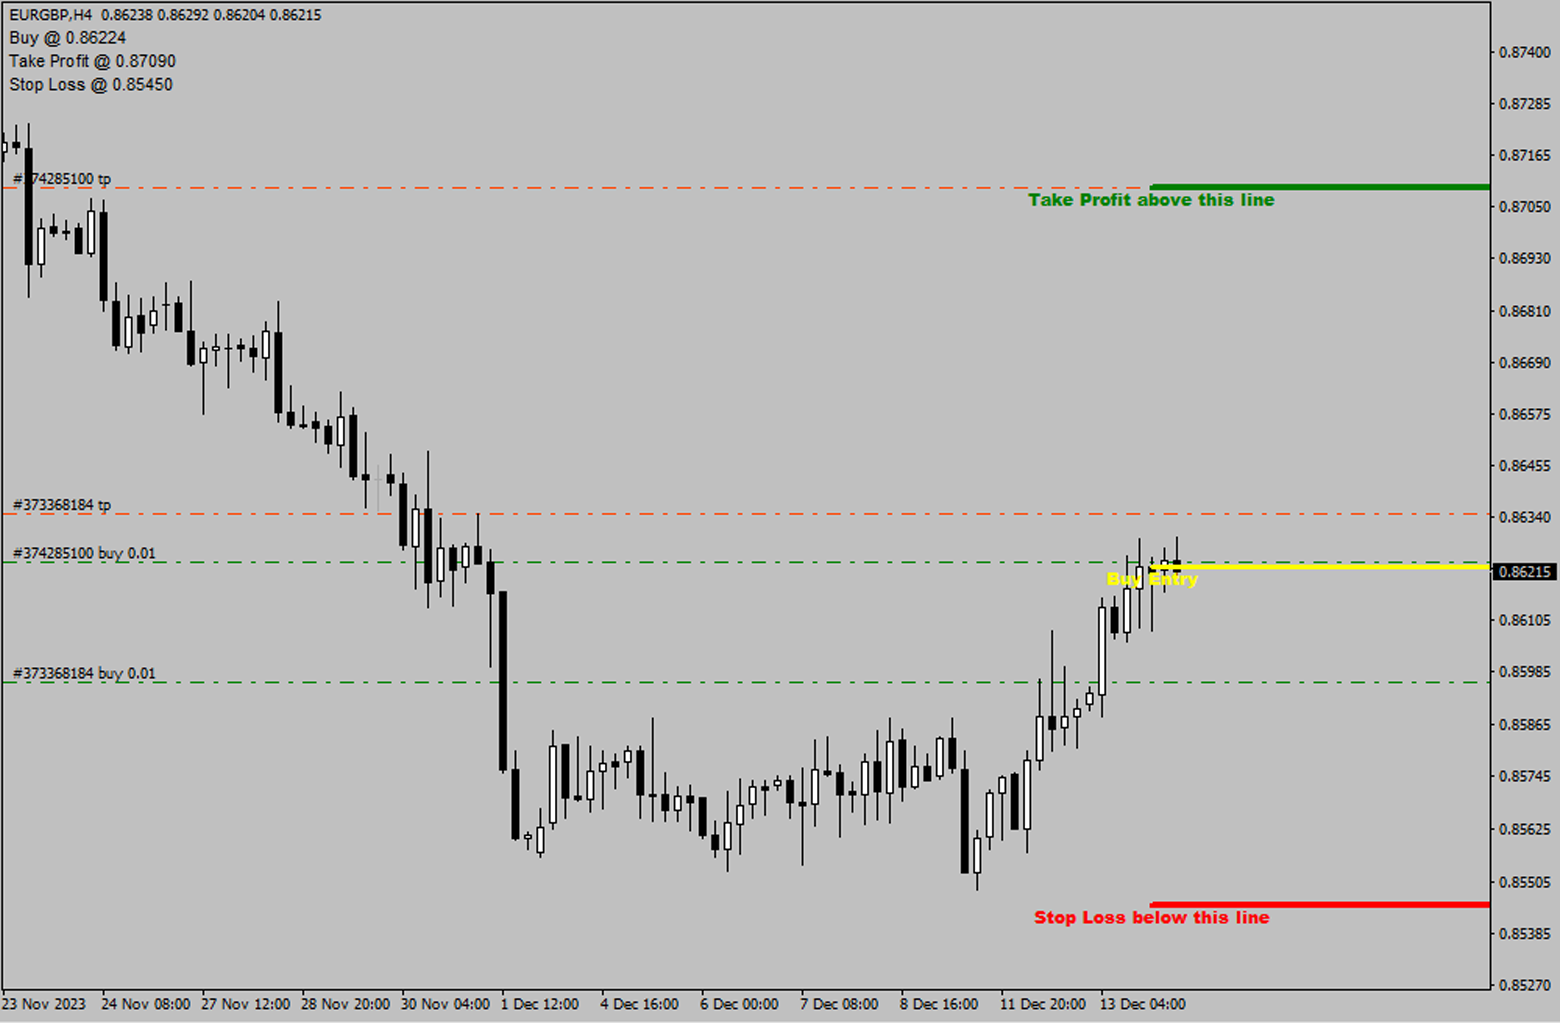
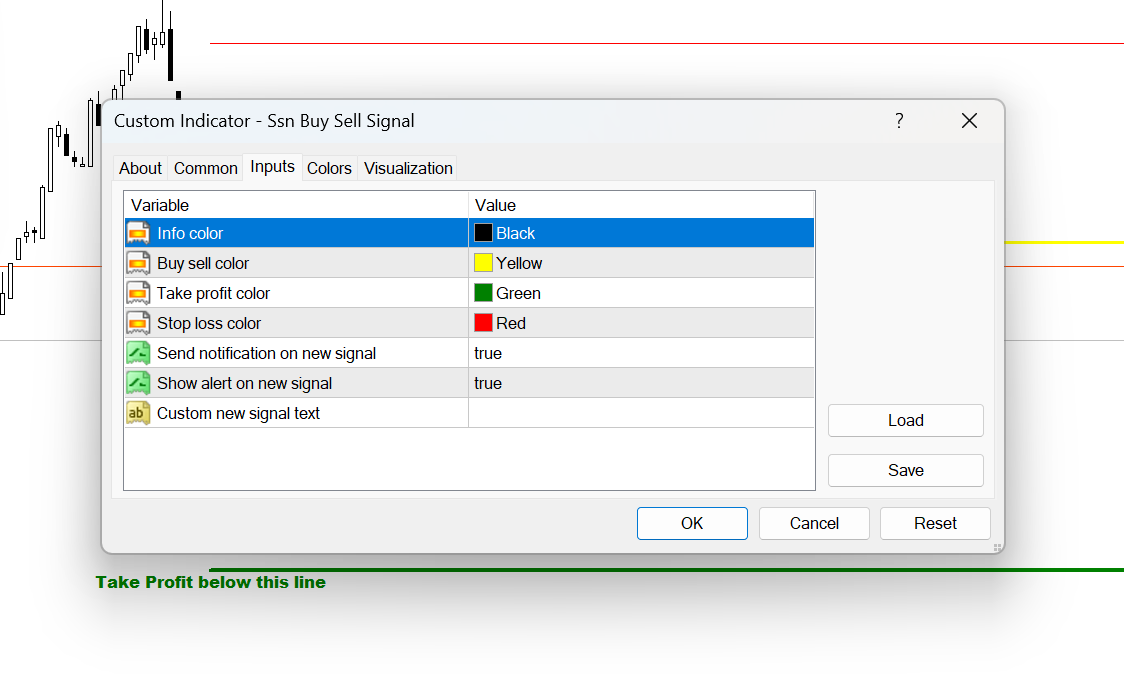
A MUST HAVE - NON REPAINT INDICATOR - that will help you to make the decision whether to Buy or Sell, including where to set the Take Profit and Stop Loss.
The Buy/Sell signal will not redraw nor repaint until new signal occurs.
The Take Profit and Stop Loss will change following the market conditions.
Our indicator will give alert to your mobile/handphone when new buy/sell signal arrive.
For best result, combine this indicator with your knowledge on price action and support & resistance, also don't forget to watch for the high impact news.
Recommended timeframe: M15 and above.