ADX Color Indicator
- インディケータ
- Adrian Hernandez Castellanos
- バージョン: 2.1
- アップデート済み: 29 2月 2024
- アクティベーション: 20
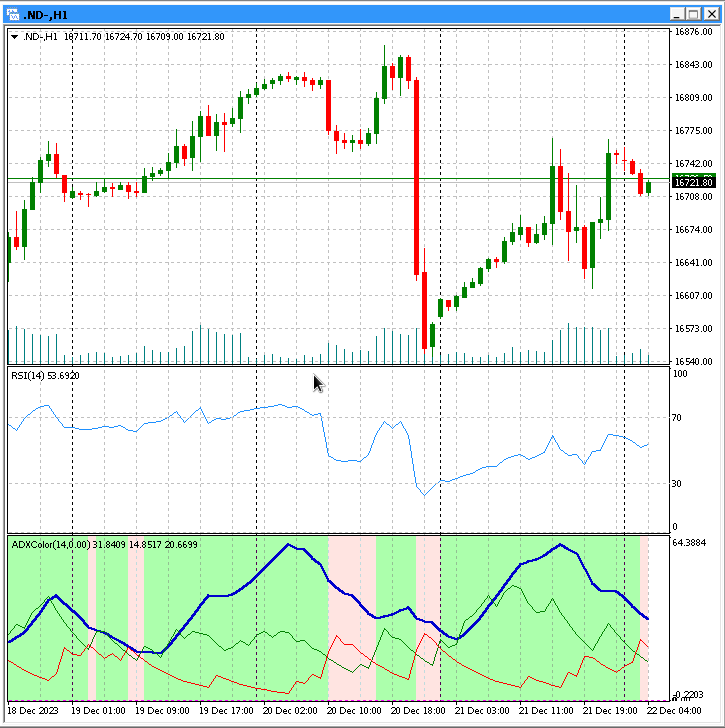
平均方向指数 ( Average Directional Movement Index - ADX) インジケーターは、トレンドの方向に応じて背景を色付けします。
ADXColor インジケーターは、トレンドの強さを測定するために使用されるテクニカル インジケーターです。インジケーターの背景色は、そのパラメータによって決定され、最後の 400 バーのみを描画します。
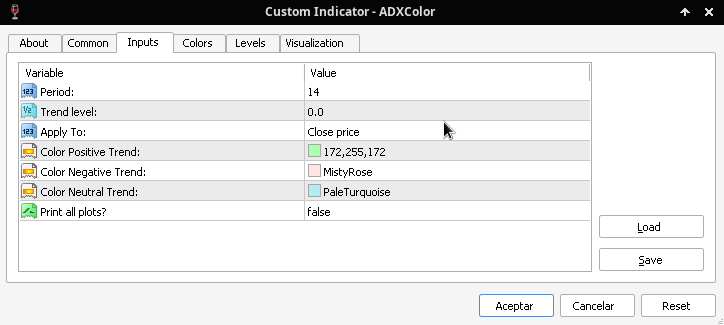
変更できるパラメータは次のとおりです。
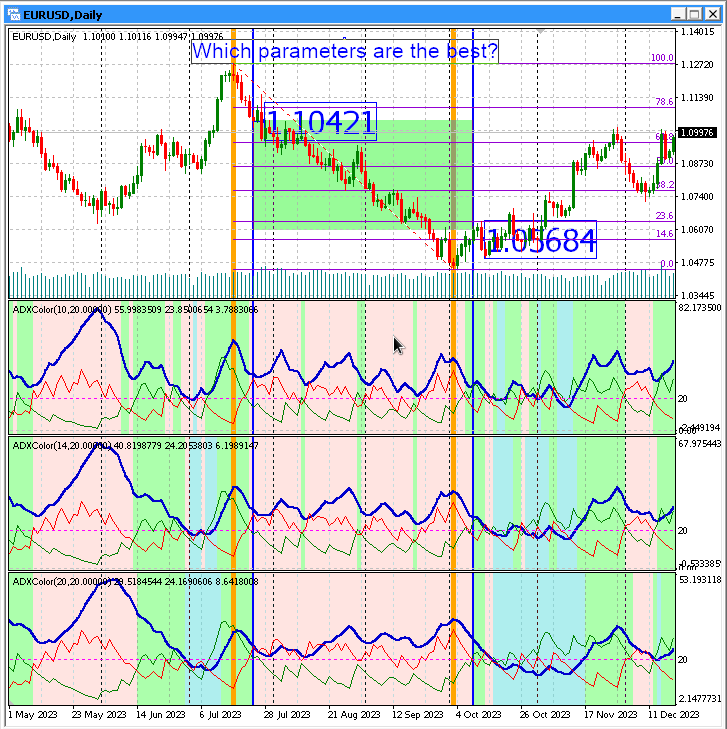
- Period:ADX インジケーターの期間。
- Trend Level:ADX インジケーターが上昇トレンドまたは下降トレンドと見なされるために到達する必要のある最低レベル (デフォルトでは 0.0)。
- Apply To:インジケーターを適用する価格 (Close price, Open price, High price, Low price, Median price, Typical price, Weighted price)。
- Color Positive Trend:上昇トレンドの背景色。
- Color Negative Trend:下降トレンドの背景色。
- Color Neutral Trend:中立トレンドの背景色。
- Print all plots?:デフォルトでは、インジケーターは過去 2 週間の値のみを描画します。グラフの最初から値を描画するには、このパラメーターを「true」に設定します。
使用方法
インジケーターを使用するには、単にそれをチャート上にドラッグアンドドロップします。MetaTrader で使用した他のインジケーターと同じように機能します。
結論
このインジケーターは、ADX インジケーターを使用する市場トレーダーにとって便利なツールです。リアルタイムで上昇トレンド、下降トレンド、および中立トレンドの識別を容易にします。
注意事項
- 市場アナリストまたは異なる時間枠で取引する場合は、次の無料ツールを使用することをお勧めします:https://www.mql5.com/ja/market/product/109888
- リソースの使用量と実行速度が高いため、パラメーター「Print all plots?」を「false」に設定することをお勧めします。これにより、インジケーターによって取得された値は最大 2 週間に制限されます。
- 400 バーのみを使用する理由は、市場トレーダーが通常、迅速な視覚データを必要とするからです。この件に関するご意見は、該当部門までお問い合わせください。ただし、一時的にこの制限を超える必要がある場合は、最初の注意事項で言及した無料ツールを使用することもできます。両方のツールは互換性があります。