Golden Gate Algo MT5
- インディケータ
- James David Lane
- バージョン: 3.20
- アップデート済み: 1 3月 2024
- アクティベーション: 10
クリスマスセール!40% OFF!1月1日に価格が$250に値上がり!
GoldenGate Entriesをご紹介します:最先端のトレーディングソリューション!
GoldenGate Entries(GGE)を使用して取引する革新的なアプローチを発見しましょう。GGEは、取引体験を向上させるために設計された先進的なインジケーターで、ユーザーに正確性と自信を持たせるための包括的な機能を提供します。
通貨ペア:Any(FX - 商品 - 株式 - 株式 - クリプト)
タイムフレーム:15分からH1
主な特徴:
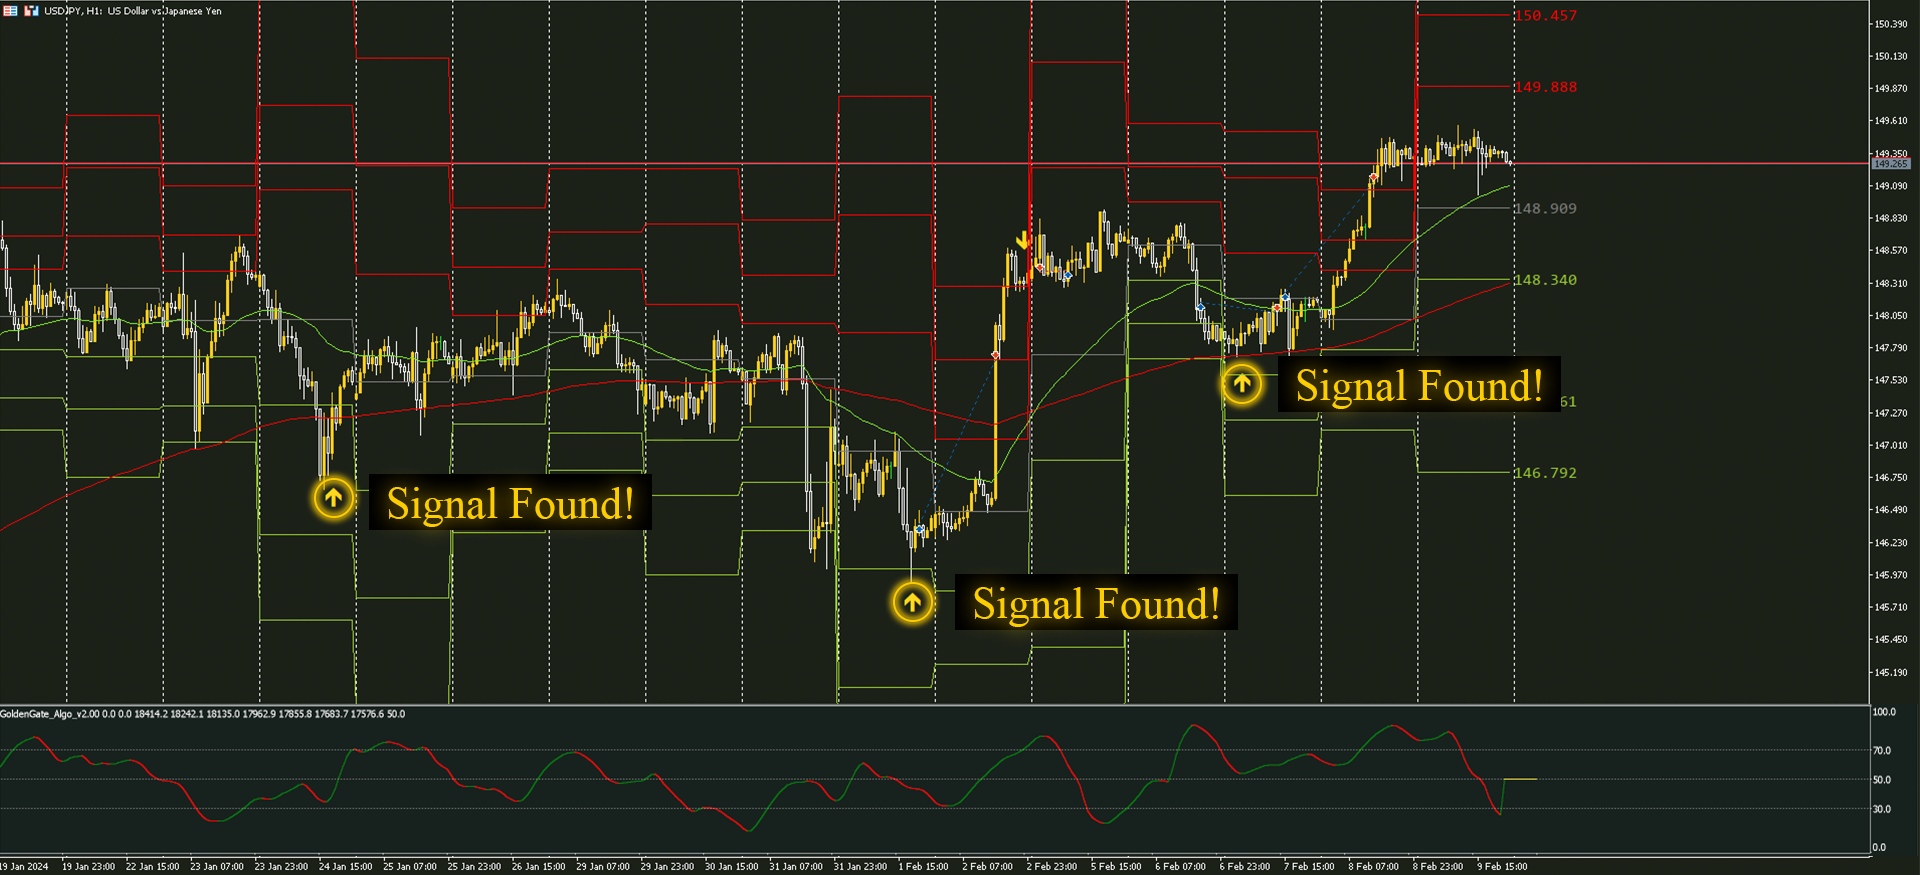
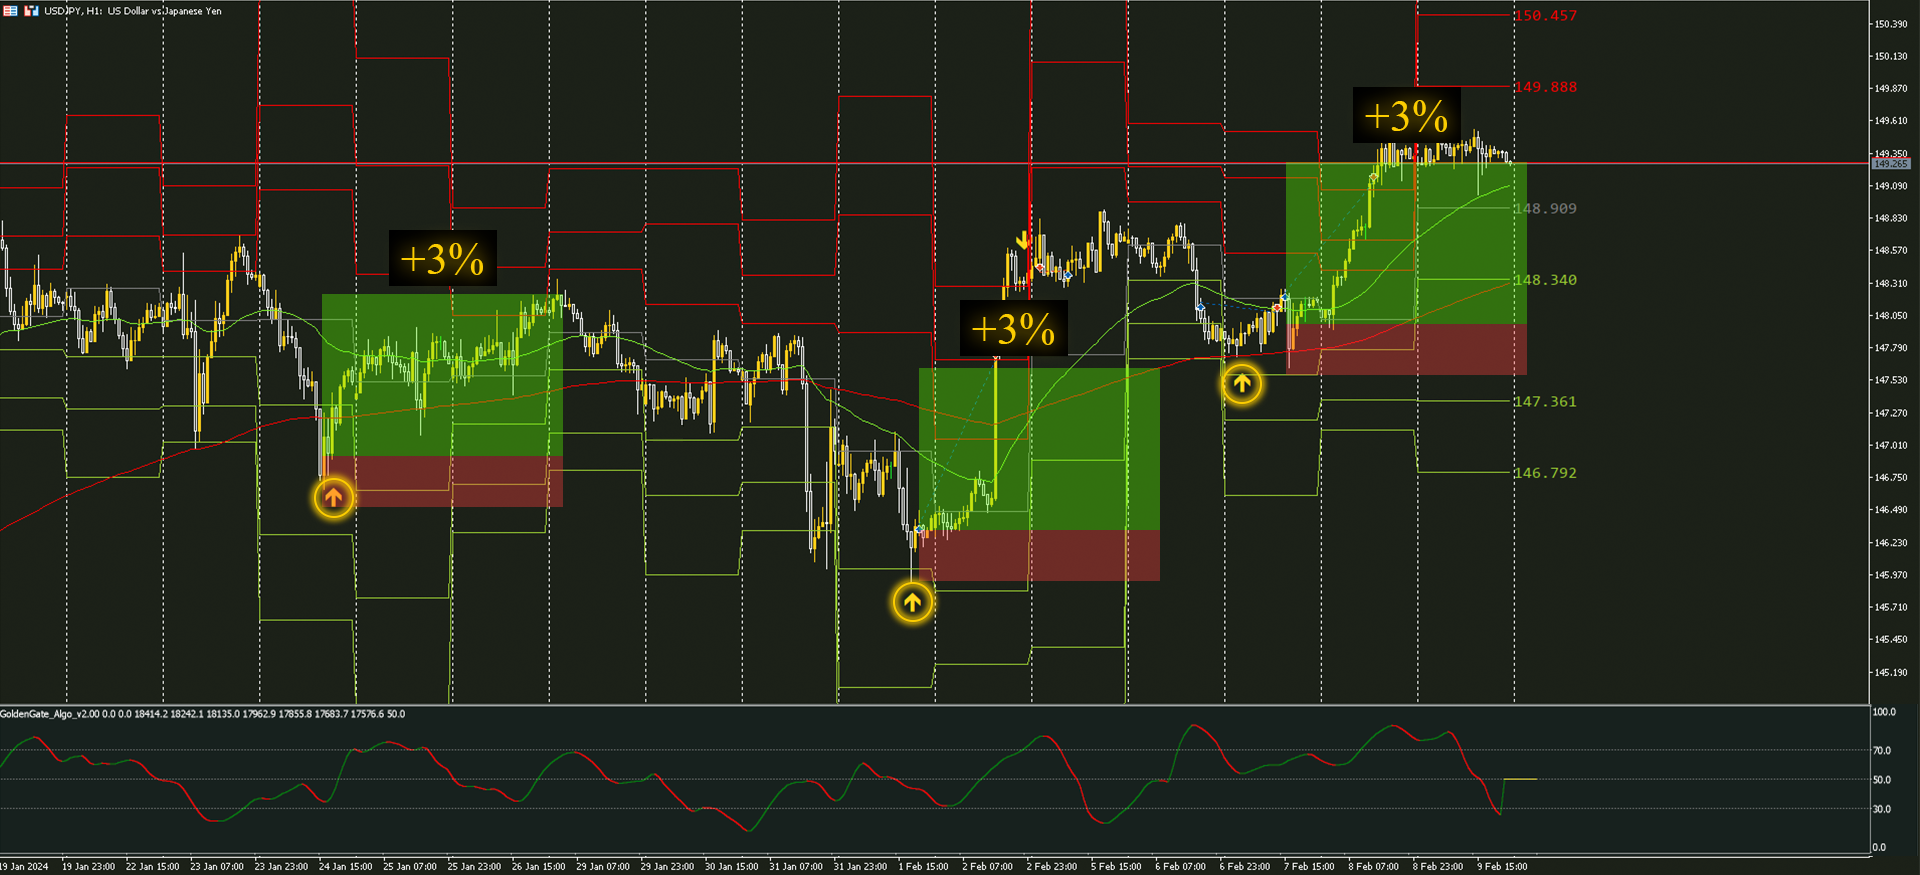
買いと売りの矢印の指示:常に情報を受け取るために、買いと売りの矢印の指示をポップアップアラートとともに受け取ります。
GoldenGate_Algo:GoldenGate_Algoを使用して市場の状況を把握し、市場が「売り過ぎ」または「買い過ぎ」かどうかを評価する強力なツールです。
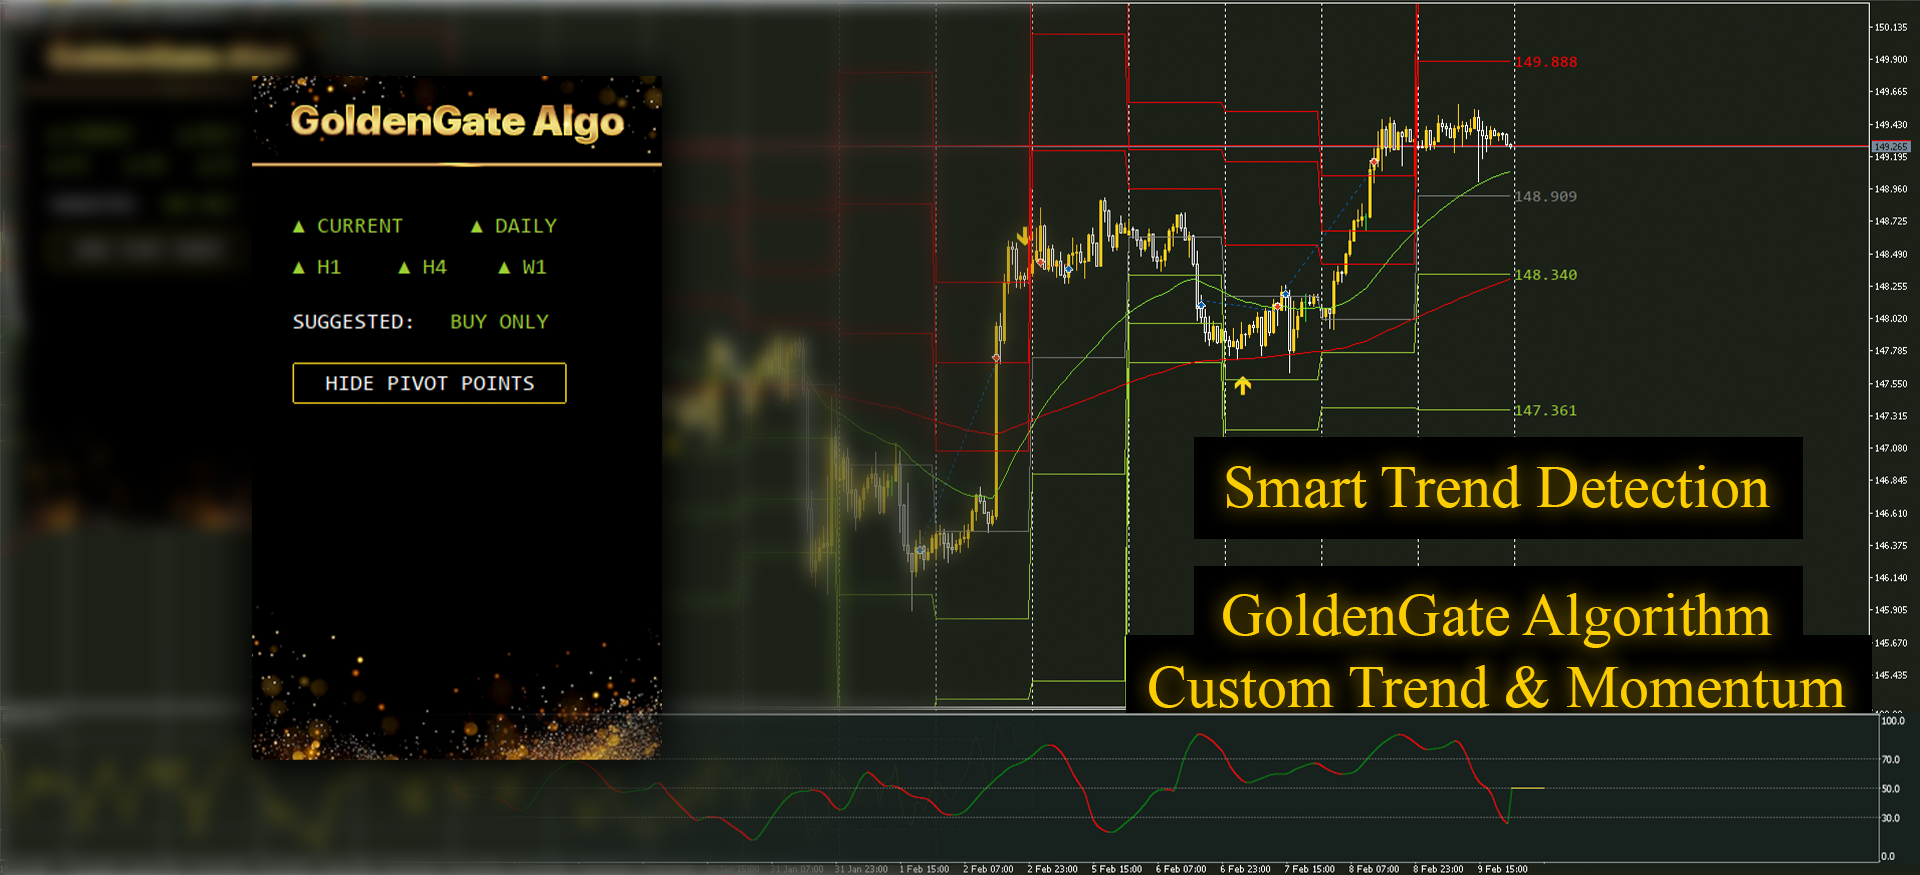
現在のトレンド分析:視聴中のタイムフレームで現在のトレンドにアクセスして、取引を市場の主流方向に合わせることができます。
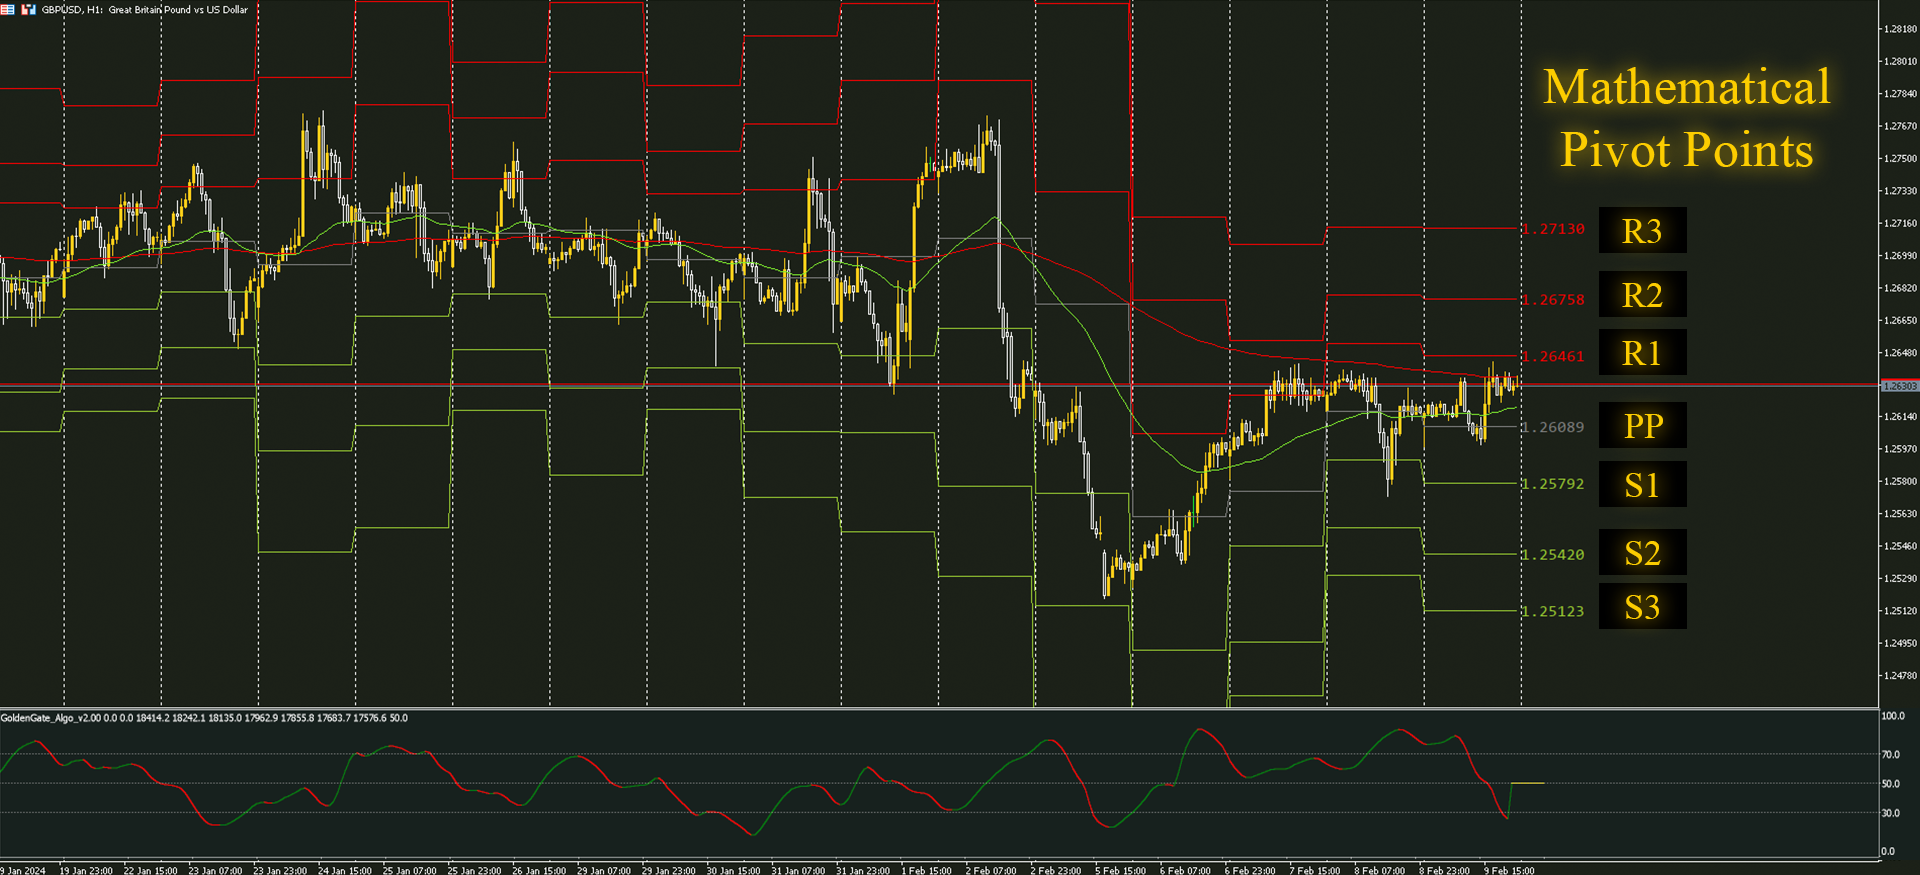
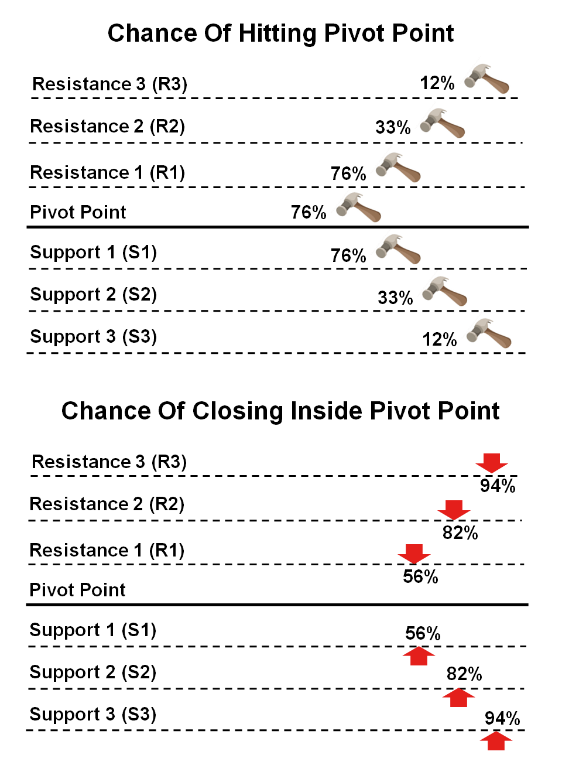
組み込みのピボットポイント:組み込まれたピボットポイントを使用して、主要な市場のポイントを簡単に特定し、価値あるサポートおよびレジスタンスレベルを提供します。
キャンドルスキャナー:キャンドルの形状やパターンを分析して、最適なエントリーポイントを見つけ、低確率のエントリーをフィルタリングします。
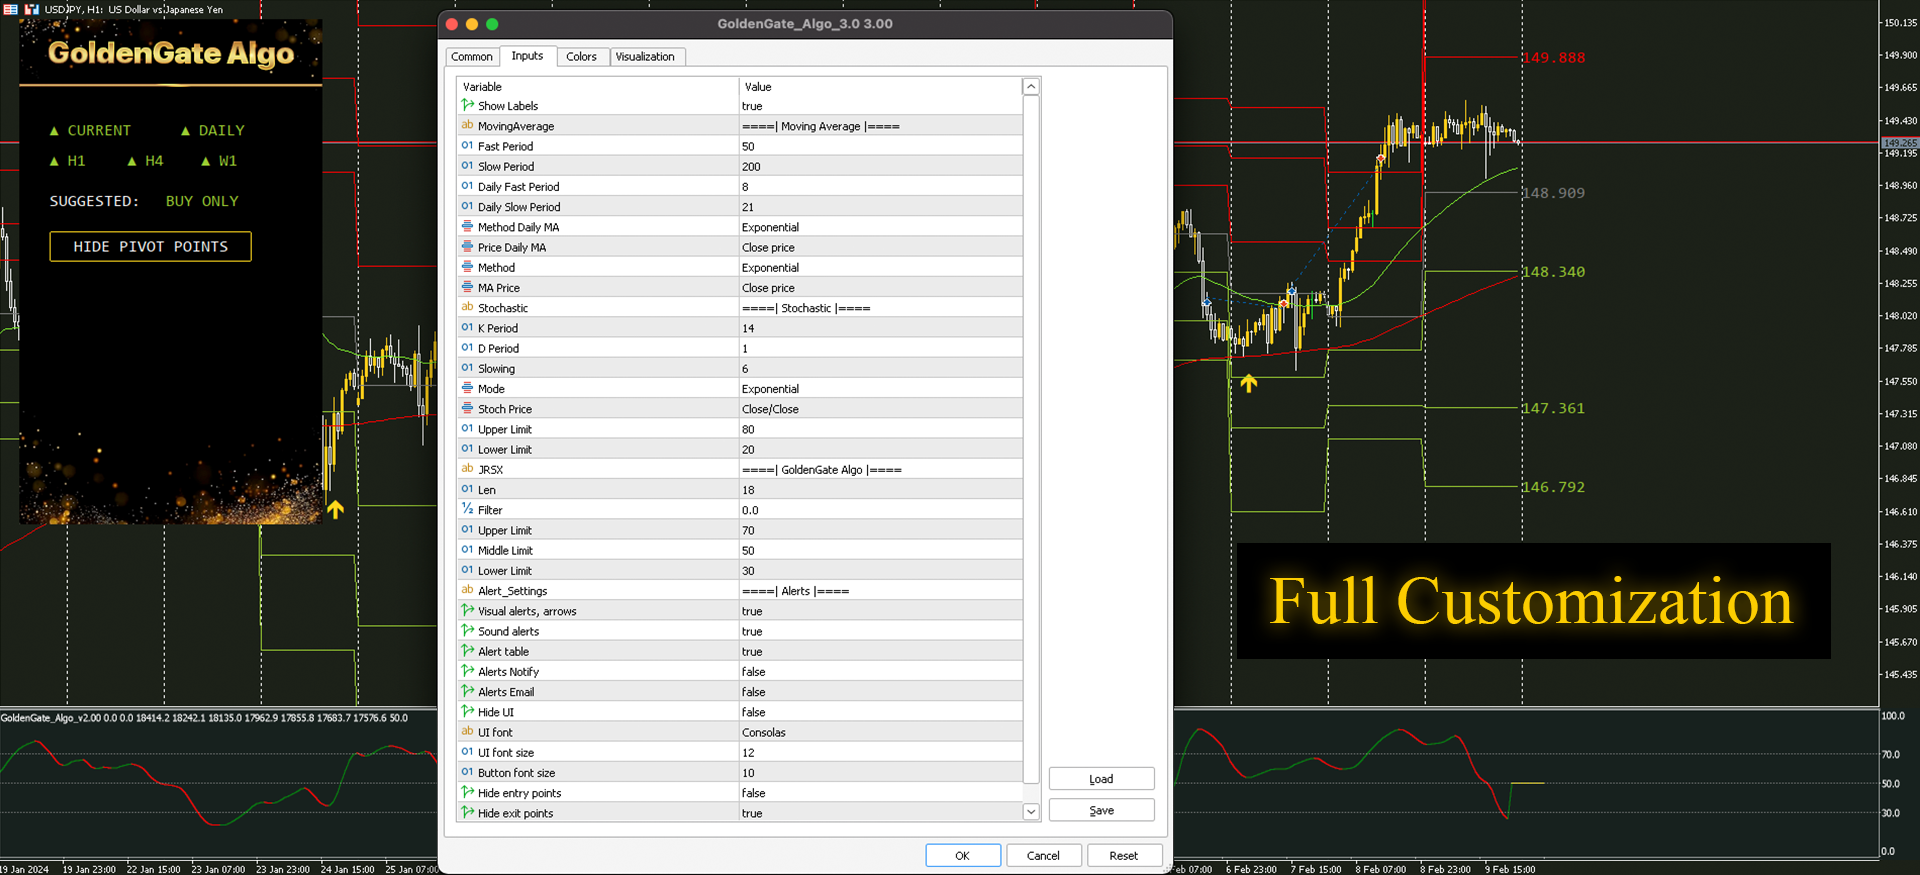
完全なカスタマイゼーション:カラーからエントリーポイントの計算に使用されるデータポイントまで、トレーディング体験に完全な制御を楽しむことができるカスタマイゼーションオプションがあります。
動作原理:GoldenGate Entriesは、さまざまな条件を組み合わせて虚偽のエントリーと低確率の取引を最小限に抑えるための洗練されたルールに基づいて動作します。現在のトレンドを考慮しながら、取引量、モメンタム、キャンドルの形状、パターンを分析することで、GGEはユーザーが積極的な市場の動きやニュースによる動きを避け、資本を守るようにします。
GoldenGate Entriesは単なる取引ツールではありません。それは金融市場のダイナミックな世界での戦略的な優位性です。今日、GGEで取引ゲームを引き上げましょう。


Great Algo when combined with a fundamental approach.