RS Zone
- インディケータ
- Chayakorn Rakwongthai
- バージョン: 1.0
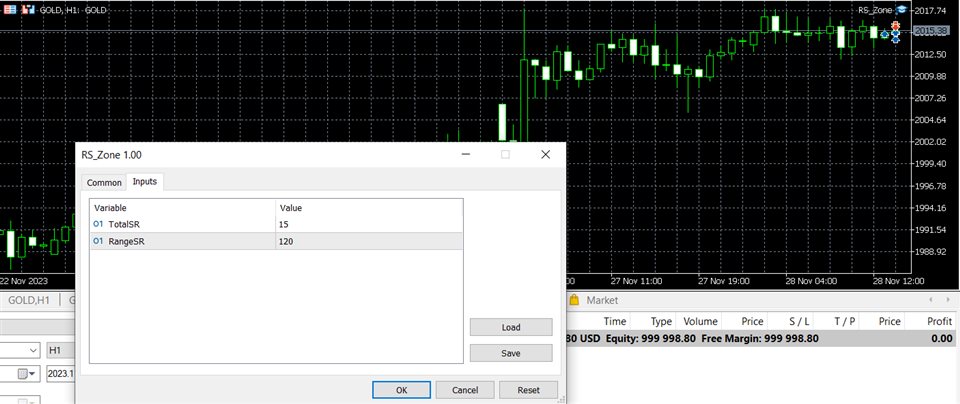
RS Zone is an Indicator used to plot the support and resistance levels of each asset. and each time period as we determine The principle for calculating support and resistance levels is based on the price range (Range SR) to see if there are points where the price repeatedly reverses at that price level or not. The total pot will be equal to the Total SR that we set.
Example
If Range SR is equal to 120, the system will choose to look at data going back 120 candlesticks to find whether there is a reversal point or not. If Total SR is equal to 15, the system will look at prices going back all 120*15 to find support and support points. Resistance is 15 points each.
Input
Total SR = Total number of support or resistance levels that we will pot.
Range SR = Range of data that will be used to find the reversal point.
More Products
| Product Name | EA/Indicator | Type | Description | Dowloads |
| Advanced BB | EA | Scalping , Level Trading , Grid | Advanced BB is an EA whose trading strategy is to use Bollinger Band to measure price imbalances. Along with using Price Patterns | Click |
| Monte Carlo Simulation | EA | Trend , Neural Networks , Hedging | Monte Carlo simulation is an EA that uses a Monte Carlo model to calculate the probability of the price going up or down. Add ADX for determining trade entry points | Click |
| Monte Carlo Simulation Indicators | Indicator | Trend , Neural Networks , Hedging | Monte Carlo simulation is an Indicator that uses a Monte Carlo model to calculate the probability of the price going up or down. | Click |


ユーザーは評価に対して何もコメントを残しませんでした