Control Trading Intraday Zones
- インディケータ
- Expert Lims S.L
- バージョン: 1.2
- アップデート済み: 20 11月 2017
- アクティベーション: 5
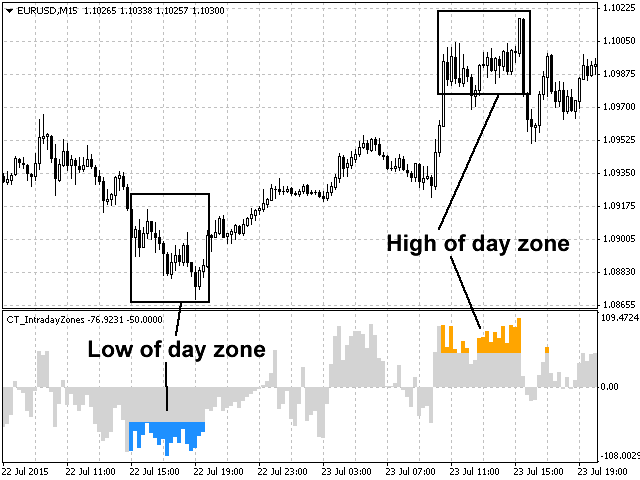
Shows maximum of the day and minimum of the day zones, adaptable to each symbol, gives you a guide to know the best zones to make the best intraday trades.
Indicator goes from -100 (lowest of the day) to 100 (highest of the day), when 0 is middle price of the day.
For example, when price reaches high of the day the indicador will continue showing max levels even the price continue rising, because indicator limits to 100 when price is on highest achieved during the day at this specific moment.
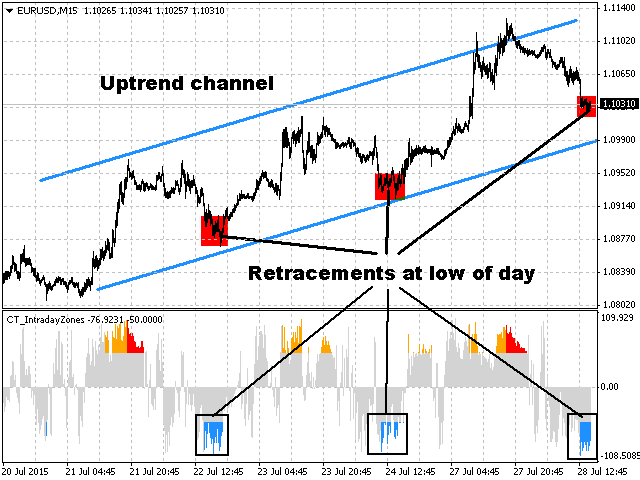
We recomend this indicator to jump into trends on retracements on extreme zones.
You can use it to have best exit zones to already opened trades.
You can also use it to trade trend reversals, divergences or even to measure if a breakout will be likely to succeed.
Parameters
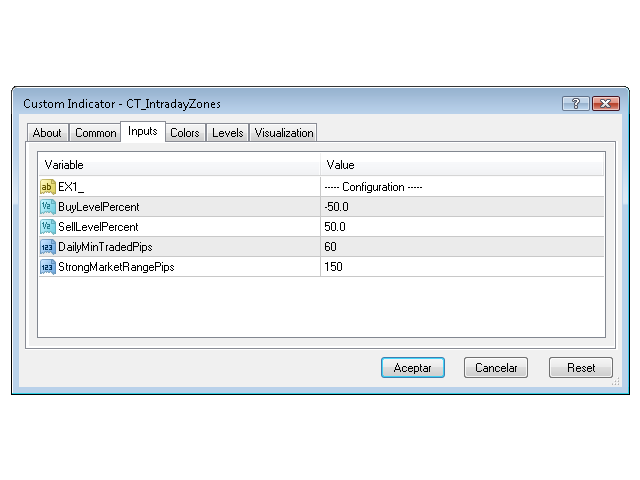
- BuyLevelPercent - Level (negative) so lower values will be shown as "Buy/Low Zone" in a bullish color.
- SellLevelPercent - Level (positive) so higher values will be shown as "Sell/High Zone" in a bearish color.
- DailyMinTradedPips - Minimun daily range pips during the current day so indicator starts to draw zones.
- StrongMarketRangePips - Level of daily range in pips so the indicator will show Strong Zones in different color.



This indicator doesn't update. You have to keep refreshing the chart.