• 概要
  • レビュー (2)
  • コメント
  • 最新情報

Big Player Range

5

「BigPlayerRange」の力を発見:市場のテクニカル分析におけるあなたの味方 📈🔍

BigPlayerRangeをご紹介します。これは市場での機関投資家の関心エリアを明らかにするために設計された先進的なテクニカル分析ツールです。このツールを使えば、主要な市場参加者がどこで積極的に関与しているかを正確に特定し、これがあなたの取引戦略にどのように影響するかを理解することができます。

主な特徴:

  • 機関投資家の関心エリアのマッピング 📊: BigPlayerRangeは、機関投資家の活動が高いゾーンを強調表示し、市場の潜在的な動きについて貴重な洞察を提供します。

  • 出口参考の予測 🎯: インジケーターは、2段階での可能な出口を提案するために予測を使用し、将来の価格動向に基づいた戦略の計画をサポートします。

  • リトレースメントの確率 🔄: 価格が特定された範囲に戻ったときのリトレースメントの可能性を評価します。この機能は、リスク管理や戦略の調整に役立ちます。

BigPlayerRangeの使い方:

  1. 関心エリアの特定 📍: インジケーターを使用して、機関投資家の活動が高いエリアを特定し、市場の重要な動きを予測します。

  2. 出口の予測 🏁: インジケーターが提供する予測に基づいて出口の決定を行い、ポジションを閉じる際に戦略的アプローチを確保します。

  3. リトレースメントの確率の評価 📉: 価格が関心エリアに戻るときのリトレースメントの可能性を監視し、必要に応じて戦略を調整します。

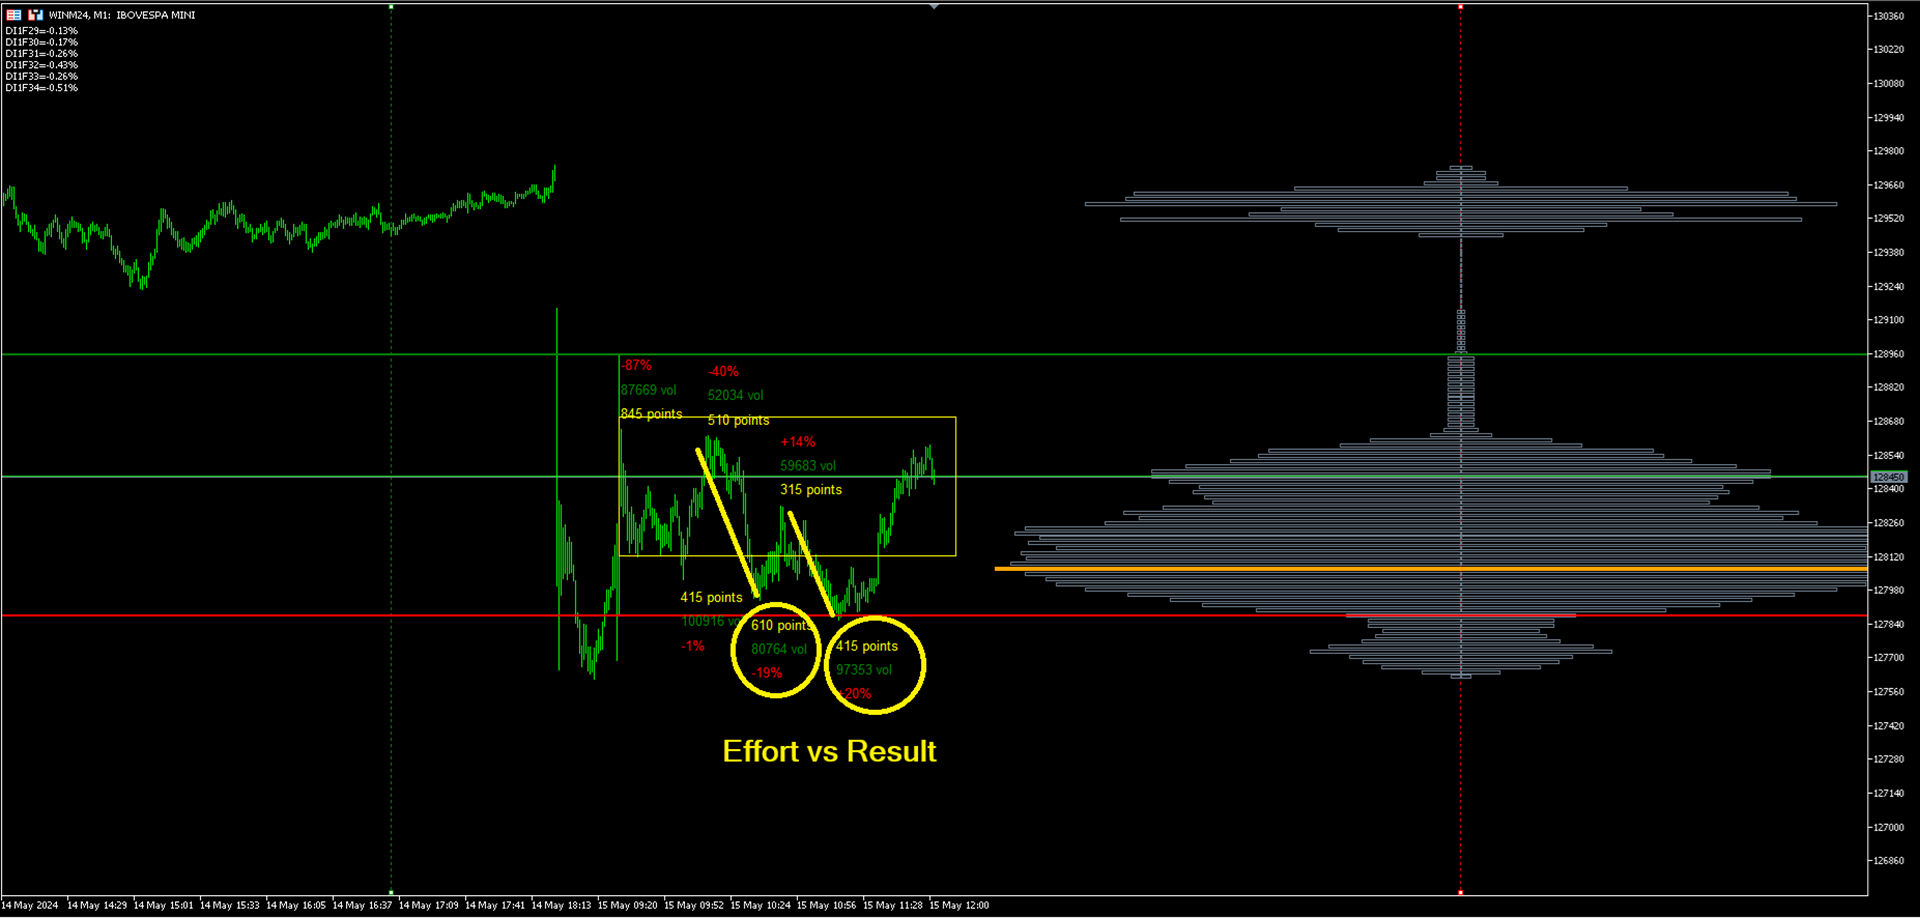
主なトリガー:価格の緑線と赤線に対する監視 🔍

BigPlayerRangeを使用する際の主な注目ポイントは、価格が中央の矩形上の緑線または赤線の上または下で閉じる領域です。この領域は重要で、機関投資家のエネルギーが集まります。以下は、この情報をどのように活用するかです:

  • 緑線の上でのクローズ 📈: 価格が緑線の上でクローズすると、強い買い圧力が示唆され、上昇の可能性があることを示すかもしれません。

  • 赤線の下でのクローズ 📉: 価格が赤線の下でクローズすると、強い売り圧力が示唆され、下降の可能性があることを示すかもしれません。

エントリー確認と出口 🎯

エントリーを確認するために、Swing VolumeProfileの組み合わせを考慮し、BigPlayerRangeの追加分析と併用します。これらの追加ツールはシグナルの確認とより情報に基づいた意思決定を支援します。

  • 出口: Targets 12を出口の参考として常に使用し、インジケーターが提供する予測や分析に基づいて構造化された戦略的なアプローチを確保します。

分析の調整とカスタマイズ:

  • 時間と取引量のタイプの選択 ⏰📊: 分析をカスタマイズし、提供されるデータの精度を最適化するために、時間と取引量のタイプ(tick または Real Volume)を選択します。

  • データの解釈 🧠: インジケーターの情報を使用して戦略を洗練し、より情報に基づいた意思決定を行います。

BigPlayerRangeは柔軟で適応可能なアプローチを提供し、特定のニーズに応じて分析を調整できます。この先進的なツールを使用すれば、情報に基づいた意思決定を一歩先取りできます! 🚀📈


レビュー 2
fabioa333
19
fabioa333 2024.01.23 15:19 
 

Ótimo indicador, para quem já possui um operacional, desenvolvedor sempre disponível para esclarecimento de eventuais dúvidas.

おすすめのプロダクト
インジケーターは、各チャート時間の6つの信号に基づいて、同じ資産の5つの異なるチャート時間のトレンドを追跡します。 指標の主な目的は、それが置かれた金融資産の大多数の傾向を示すことです。 システムは数回のグラフィカルな時間で傾向の情報を送信します。これにより、ユーザーは資産の動きの広い視野を持つことができます。このタイプのツールは、オペレーターが注文を実行するのを支援することで、ユーザーのヒット率を高めます トレンドを支持して。 Injikētā wa, kaku chāto jikan no muttsu no shingō nimotozuite, onaji shisan no itsutsu no kotonaru chāto jikan no torendo o tsuiseki shimasu. Shihyō no omona mokuteki wa, sore ga oka reta kin'yū shisan no dai tasū no keikō o shimesu kotodesu. Shisutemu wa sū-kai no gurafikaruna
Limitless MT5 is a universal indicator suitable for every beginner and experienced trader. works on all currency pairs, cryptocurrencies, raw stocks Limitless MT5 - already configured and does not require additional configuration And now the main thing Why Limitless MT5? 1 complete lack of redrawing 2 two years of testing by the best specialists in trading 3 the accuracy of correct signals exceeds 80% 4 performed well in trading during news releases Trading rules 1 buy signa
Go Binary
Fabio Oliveira Magalhaes
The main idea of this product is to generate statistics based on signals from 5 different strategies for the Binary Options traders, showing how the results would be and the final balance based on broker's payout. Strategy 1: The calculation is secret. Strategy 2: The signal is based on a sequence of same side candles (same color). Strategy 3: The signal is based on a sequence of interspersed candles (opposite colors). Strategy 4: The signal consists of the indicators bollinger (we have 3 typ
TrendOnCloseは、特定のローソク足サイクル内のトレンドとカウンター トレンドの統計分析に焦点を当てた、バイナリー市場投資家向けの高度 なインディケータです。 各サイクル は、ローソク足の終値によって定義され、次のサイクルが始まるまでの間、トレン ド方向(UP/DOWN - BULL/BEAR)を確立します。統計分析は2つの構成で行われます: ⦁ SUBSEQUENT CANDLEとしての統計目標: アルゴリズムは、サイクル内の後続のローソク足に焦点を当てます。 ⦁ INTERCYCLESとしての統計ゴール: アルゴリズムは、各サイクル間のすべてのローソク足を考慮する。 選択された統計目標に基づき、各ローソク足のトレンドがCYCLEローソク足のトレンドと比較され、同一方向の場合はTREND-Percent(TD)とTrend-Occurrences(N-TD)が増加し、トレンドが乖離している場合はCOUNTER-TREND(CTとN-CT)が増加します。さらに、このインジケータは、日足、週足、月足の統計的な合計を提供し、これらの期間中、各サイクル の「トレンド」ま
Our BOOM SELL ALERT indicator is specifically engineered to   take candles on BOOM 1000 , BOOM 500 is tool is optimized for M1 (1-minute) timeframe, ensuring you receive timely and actionable insights.   The indicator is a combination of   many indicators. -        AO Oscillator -        Stochastic   HOW TO USE THIS INDICATOR To use well this indicator , it   need to use SCHAFF TREND RSX ( 5 MIN OR M5) IF SCHAFF trend RSX is GREEN and you have a signal then SELL when you have ENTRY and out with
Compared to simple or exponential moving averages, slow adaptive trend lines might offer a more nuanced view of the trend by adjusting their sensitivity based on market conditions. However, their slow nature might also mean they are late in signaling reversals when market conditions change rapidly - and that is the difference between them and our SlowAMA . SlowAMA was designed to be a better long-term trend indicator than EMA and other Moving Averages. It uses our JurMA calculations, reducing
A powerful oscillator that provide Buy and Sell signals by calculating the investor liquidity. The more liquidity the more buy possibilities. The less liquidity the more sell possibilities. Please download the demo and run a backtest! HOW IT WORKS: The oscillator will put buy and sell arrow on the chart in runtime only . Top value is 95 to 100 -> Investors are ready to buy and you should follow. Bottom value is 5 to 0 -> Investors are ready to sell and you should follow. Alert + sound will app
Strong Candle Indicates the size of each candlestick with the text value above it and indicates which candlestick has a body larger than the one specified in the parameters in percentage, that is, a strong candlestick (between Size_Min and Size_Max) with at least x% of body. The candlestick size is placed in the buffer and that is the buy or sell indication, where: value > 0 = bullish candle or value < 0 bearish candle, value = 0 means no indication (the candle did not match the desired pattern
The Smooth Price technical indicator is used for plotting a smoothed line as close to the price of the financial instrument as possible, and serves to eliminate its noise components. The indicator is part of the Monarch trading system, but here it is presented as an independent technical analysis tool. The indicator is based on the cluster digital filter , which, unlike the ClusterSMA , is applied directly to the price time series. Smooth Price does not redraw (except the very last, zero bar) an
Quantitative analysis software, this indicator came from another country and thanks to my network today I can share this software with you! Russian Tool plots arrows on your asset, indicating the trend the asset will enter, easy to use and easy to install indicator We have been working with robots and indicators since 2018! We came to MQL5 to be able to bring better benefits at the time of payment by our customers!, our Instagram where we post daily stories of operations: https://www.inst
The Plasma Trend indicator is a simple technical indication that is used to determine the current trend direction in the market. The Plasma Trend indicator is a powerful tool for determining the direction of the trend in the Forex market. It is based on both standard technical indicators and proprietary mathematical calculations, which provides a more accurate and reliable trend determination. Its implementation in the form of lines of two colors simplifies the visual determination of a change
Trend indicator, a revolutionary unique solution for trend trading and filtering with all important trend features built into one tool! This is a 100% non-repainting multi-timeframe and multi-currency indicator that can be used on all currency pairs. HandleTrend is an effective trend following indicator that gives trend signals in the form of arrows on the chart.
Binary Options Assistant (BOA) BOIL Signals Indicator provides signals based on Ana Trader Binary Options Strategy. Indicators: Stochastic Stop missing trades, stop jumping from chart to chart looking for trade set-ups and get all the signals on 1 chart! U se any of the BOA Signals Indicator with the  Binary Options Assistant (BOA) Multi Currency Dashboard .  All BOA Signal Indicator settings are adjustable to give you more strategy combinations. The signals can be seen visually and heard au
バイナリ オプションの可能なコールおよびプット エントリを生成する人工知能に基づくインジケーター。 このインジケーターは 3 つの異なる戦略で機能します。 1) 出来高を読み取ることで、価格が反転する時期にシグナルを送信します。 2) 価格と出来高の乖離を通じて、トレンドが継続するか反転するかを知らせます。 3) 価格と出来高の収束を通じて、トレンドが継続すべき時期にシグナルを送信します。 この指標はすべての時間枠で機能しますが、最良の結果は 3 分または 5 分の期限で得られます (制度的な攻撃は短い時間枠で見られるため)。 最も流動性の高い時間帯、つまりグリニッジ標準時 7 時からグリニッジ標準時 18 時までが最適です。 このインジケーターは正しいシグナルの 70% 以上を生成しますが、価格を操作する機関同士の争いに遭遇したり、相互に拒否したりして、一連の誤ったシグナルが生成される可能性があります。そのため、適切な資金管理を使用することをお勧めします (Masaniello の例) )
The implementation of the Trend Turn trend indicator is simple - in the form of lines of two colors. The indicator algorithm is based on standard indicators as well as its own mathematical calculations. The indicator will help users determine the direction of the trend. It will also become an indispensable advisor for entering the market or closing a position. This indicator is recommended for everyone, both beginners and professionals. How to interpret information from the indicator. We se
This indicator builds upon the previously posted Nadaraya-Watson smoothers. Here we have created an envelope indicator based on Kernel Smoothing with integrated alerts from crosses between the price and envelope extremities. Unlike the Nadaraya-Watson estimator, this indicator follows a contrarian methodology. Please note that by default this indicator can be subject to repainting. Users can use a non-repainting smoothing method available from the settings. The triangle labels are designed
Consolidation Zone   Indicator is a powerful tool designed for traders to identify and capitalize on consolidation patterns in the market. This innovative indicator detects consolidation areas and provides timely alerts when the price breaks above or below these zones, enabling traders to make informed trading decisions. MT4 Version :  https://www.mql5.com/en/market/product/118734 Key Features: 1.   Consolidation Detection :    -   Precise Identification : The Consolidation Zone Indicator a
FREE
Binary Options Assistant (BOA) BURN Signals Indicator provides signals based on Ana Trader Binary Options Strategy. Indicators: MACD & Stochastic Stop missing trades, stop jumping from chart to chart looking for trade set-ups and get all the signals on 1 chart! U se any of the BOA Signals Indicator with the  Binary Options Assistant (BOA) Multi Currency Dashboard .  All BOA Signal Indicator settings are adjustable to give you more strategy combinations. The signals can be seen visually and hea
The "Trend Orbital" indicator is a tool for tracking trends in the financial asset market. It is based on the analysis of price data and provides a visual interpretation of the current direction of price movement. Options: InpAmplitude: Amplitude - determines the amount of volatility that the indicator takes into account when determining the trend. Group "Arrow": InpCodeUpArrow: Up Arrow Code - Defines the arrow symbol to display an uptrend. InpCodeDnArrow: Down Arrow Code - Defines the arrow
Dependence arrow indicator for forex, futures and binary options without redrawing. It gives a lot of signals, which requires additional indicators to check them. Works only on opening prices. Therefore, reliable and without redrawing. Often signals that went in the wrong direction are canceled out on the next signal. Unfortunately, most popular indicators in practice give a huge number of false signals, since they all work without any consideration of global trends. That is why in today's co
It is very easy to use the Fibrillar indicator, since the simplest is to look at the chart and act according to the indications of the colored arrows. The algorithm takes into account the measurement of prices, and this method also focuses on measuring each of the price drops (H / C, H / O, LC, LO) - which gives more detailed information, but also more averaged. When calculating this indicator, logarithmic gains are first calculated at the closing price, which allows you to filter out the tre
Rivoluziona il Tuo Trading con l'Indicatore di Segnali Scalping su Timeframe Multipli   Scopri il segreto del successo nel trading con il nostro esclusivo indicatore di SEGNALI scalping su timeframe multipli. Questo strumento avanzato è progettato per trovare segnali efficienti e precisi, aiutandoti a massimizzare i profitti e a ridurre i rischi associati al trading veloce L'indicatore di segnali Alien Scalper MTF è uno strumento di analisi tecnica altamente efficace, progettato per identificare
New to Binary Options Trading? You are not able to win while trading binary options? Need help with your trading? You have come to the right place! This indicator provides Put (SELL) and Call (BUY) signals for binary options on the M1-M15 timeframes. Advantages Ability to easily recognize impulsive moves. Effective and flexible combination to different trading strategies. Advanced statistics calculation following the entry point. Signals strictly on the close of a bar. Works in all symbols and
ScalperMultiMT5 is a multicurrency indicator for professional traders. The indicator shows the complete market situation for the trader. The main advantage of this indicator is that it simultaneously analyzes six major currency pairs on all timeframes from M1 to MN. The indicator analyzes the trend strength. The indicator generates color-coded signals to visualize the market situation: Green - ascending trend. Red - descending trend. Yellow - trend is not defined. The indicator is excellent for
MarketMagnet
Kelly Adediran Raymond
Are you ready to take your trading journey to new heights? Look no further than MarketMagnet, this groundbreaking indicator designed to propel your trading success with excitement and accuracy. Powered by the convergence of Momentum and CCI (Commodity Channel Index), MarketMagnet equips traders with the ultimate tool to determine direction and entry prices for a wide range of recommended currency pairs and instruments. It is designed for traders seeking to scalp for a few pips on lower timeframe
当社の製品を使用する前に、英語の免責事項を注意深くお読みください。当社の製品は、市場の潜在的なトレンドや価格の動きに関する情報を提供するために設計されています。しかしながら、当社の製品を利用することによって特定の結果を保証することや、利益を保証することはできません。金融市場取引にはリスクが伴いますので、慎重にご判断いただき自己責任でご利用いただくようお願い申し上げます。詳細については、英語の免責事項をご参照ください。 当社の製品を使用する前に、英語の免責事項を注意深くお読みください。当社の製品は、市場の潜在的なトレンドや価格の動きに関する情報を提供するために設計されています。しかしながら、当社の製品を利用することによって特定の結果を保証することや、利益を保証することはできません。金融市場取引にはリスクが伴いますので、慎重にご判断いただき自己責任でご利用いただくようお願い申し上げます。詳細については、英語の免責事項をご参照ください。
What is KTrend indicator ? KTrend is a powerful indicator for trading medium-term binary options that identify the trend of price by candlesticks. Sell signal is formed when the value is below the zero line. Similarly, buy signal is formed when the value is above the zero line. It is separated from KTrend trading system and you can get the backtest result from the pictures below.
The latest most requested Binary Options arrow indicator in the Garuda Signals product line is now on MT5! Binary options signal based on multiple time frame cross over analysis. Gets confirmation from the most consistent signals known to man; Ichimoku, SMA, Bollinger Bands; and also uses the 1 Hour time frame as trend confirmation , so you don't have to open up multiple chart and waste time. - Can be used for all time frames up to 1 hour, but is most POWERFUL for 1 and 5 min options. - Place yo
The DVV indicator is a multifaceted informative indicator for the Forex market or the Cryptocurrency market . The indicator gives clear and reliable signals without redrawin g. The indicator can be used in bots by taking readings from its zero buffer. Please note that for different currency pairs, the settings must be selected separately, this is not difficult. Changing the input parameters greatly affects the display. I will show four options for using the indicator. The indicator has only
A scalping indicator based on mathematical patterns, which on average gives signals with relatively small SL, and also occasionally helps to catch big moves in the markets (more information in the video) This indicator has three main types of notifications: The first type warns of a possible/upcoming signal on the next bar The second type indicates the presence of a ready signal to enter the market/open a position The third type is for SL and TP levels - you will be notified every time price r
このプロダクトを購入した人は以下も購入しています
VTrende Pro
Andrii Diachenko
5 (1)
VTrende Pro - MTF indicator for trend trading with a display panel for MT5 *** Videos can be translated into any language using subtitles (video language - Russian) Although the signals of the VTrende Pro indicator can be used as signals of a full-fledged trading system, it is recommended to use them in conjunction with the Bill Williams TS. VTrende Pro is an extended version of the VTrende indicator. Difference between Pro version and VTrende: - Time zones - Signal V - signal 1-2 waves
IVISTscalp5
Vadym Zhukovskyi
5 (5)
iVISTscalp5インジケーターをご紹介します。このインジケーターは、トレーディングにおいて独自でありながら効果的です。時間データに基づくこのインジケーターは、多年にわたる経験と金融市場の深い分析の結果です。iVISTscalp5インジケーターは、手動トレーディングにとって優れたツールです。便利さ、簡単さ、可視化 - すべての複雑さが内部に隠されています。私たちは、iVISTscalp5インジケーターの設定と使用を最大限に簡素化しました。このインジケーターは、MT5ターミナルにあるすべての金融商品に適しています。 稼働時間は、4時から20時(UTC+3)です。 iVISTscalp5インジケーターメニュー(スクリーンショット1を参照): History - 引用を計算する週数 dT_min - 時間間隔の選択(分) TFline - 水平ボリュームの作成(時間枠) BARSline - 水平ボリュームの作成(バー数) TFtrend1 - デイリーチャンネルの作成(時間枠) BARStrend1 - デイリーチャンネルの作成(バー数) TFtrend2 - 週次チャンネルの作成(時
The indicator is designed to close positions on the market in time. For example: to take profits ahead of schedule if the price has not reached TakeProfit, and the market is turning around. The indicator analyzes the momentum, not the trend. He does not give any information about the trend. The indicator is well suited for finding divergence. The Ershov 38 Parrots indicator dynamically adjusts to the market and detects price movement impulses of medium and high amplitude. It almost does not rea
Indicador en MQL5, que obtiene el promedio de 10 EMAS, que son alineadas según Fibonacci, obteniendo un promedio, que sera suavizado.  Se puede ingresar un numero desde 2 a N, que multiplica a los EMA-Fibonacci. Funciona en cualquier criptomoneda, etc. etc... pudiendo calcular el futuro segun la tendencia de las EMAS. Funciona excelentemente en tramos largos, determinando exactamente el mejor inicio/salida. El precio inicial por apertura sera por un periodo de tiempo, luego aumentará.
EQ Cutrim Theory
Marco Aurelio Santos Costa
Ronal Cutrim has been a dedicated mathematician for 14 years and has more than 10 years of experience in the financial market. The concept of the theory is simple, find imbalance between buyers and sellers. Which makes a lot of sense, because nothing goes up forever, nothing falls forever.   When you find an asset with a mathematical probability of unbalanced equilibrium, it is a great way to get into trading:  TUTORIAL: Turn on the subtitles, the video is subtitled
Классификатор силы тренда. Показания на истории не меняет. Изменяется классификация только незакрытого бара. По идее подобен полной системе ASCTrend, сигнальный модуль которой, точнее его аппроксимация в несколько "урезанном" виде, есть в свободном доступе, а также в терминале как сигнальный индикатор SilverTrend . Точной копией системы ASCTrend не является. Работает на всех инструментах и всех временных диапазонах. Индикатор использует несколько некоррелируемых между собой алгоритмов для класси
プレミアムレベルは、正しい予測の精度が80%を超える独自の指標です。 この指標は、最高のトレーディングスペシャリストによって2か月以上テストされています。 あなたが他のどこにも見つけられない作者の指標! スクリーンショットから、このツールの正確さを自分で確認できます。 1は、1キャンドルの有効期限を持つバイナリーオプションの取引に最適です。 2はすべての通貨ペア、株式、商品、暗号通貨で機能します 手順: 赤い矢印が表示されたらすぐにダウントレードを開き、青い矢印が表示されたら閉じます。青い矢印の後に開くこともできます。 試してテストしてください!推奨設定はデフォルトです! 日足チャートで最高の精度を示します! インディケータは、2600 Pipsの収益性に対して、約10Pipsという非常に小さなマージンを使用します。
Indicador en base a la pendiente de la linea de precio, dibuja una línea de color cuando sube a base de los precios que previamente has sido procesados o linealizados, y cuando baja la pendiente la linea linealizada toma otro color. En este caso se a considerado 6 lineas de diferentes procesos desde pendientes largas hacia las cortas, observándose que cuando coincidan las pendientes se produce un máximo o mínimo, lo que a simple vista nos permitirá hacer una COMPRA O VENTA.
Индикатор Coefficient Of Determination (COD) представляет собой значение коэффициента детерминации или квадрат коэффициента корреляции между зависимой переменной — ценой и объясняющей переменной — тиковым объемом. Что это дает нам на практике? COD отлично распознает кульминацию трендовых движений, что позволяет подбирать оптимальные точки и ловить развороты рынка. Как использовать индикатор: Наиболее популярная торговая стратегия строится совместно с трендовым индикатором Moving Average (MA), пе
Fibonacci Múltiple 12, utiliza la serie fibonacci plasmado en el indicador fibonacci, aumentadolo 12 veces según su secuencia. El indicador fibonacci normalmente muestra una vez, el presente indicador se mostrara 12 veces empezando el numero que le indique siguiendo la secuencia. Se puede utilizar para ver la tendencia en periodos cortos y largos, de minutos a meses, solo aumentado el numero MULTIPLICA.
Recommended TimeFrame >= H1. 100% Non Repainted at any moment.  Use it carefully, only with Trend Direction. Trading Usage: 2 Variants: as Range System or as BreakOut System (Both Only With Trend Direction)::: (Always use StopLoss for minimise Risk); [1] as Range System: (Recommended) in UP TREND:  - BUY in Blue Line , then if price goes down by 50 points (on H1) open Second BUY.   Close in any Profit you wish: TrailingStop(45 points) or Close when Price touches upper Gold Line. in DOWN TR
En base a cálculos matemáticos de determino una linea Horizontal que cruza a todas las señales de trading, mostrando los máximos y mínimos. La linea horizontal parte en dos las subidas y bajadas de las señales de trading, de tan manera que es fácil identificar los máximos y mínimos, y es inteligente por que es sensible a las subidas y bajadas, afín de no quedarse en un solo lado por siempre, trabaja excelentemente con otros indicadores suavizadores ya que les garantiza que en un intervalo de tie
this indicator is a Spike detector indicator, it is specially designed to trade Boom 1000, Boom 500, Crash 1000 and Crash 500 We recommend using it on Deriv Boom and Crash indices only Its setting is intuitive, familiar, easy to use it has notification functions; audible notifications and push notifications. this tool is simple to use, easy to handle This update is based on different strategies for spikes
trend view panel; AutoSignals Trend The indicator tracks the trend in 5 different chart times for the same asset, based on 6 signals for each chart time. The main objective of the indicator is to show us the majority trend of the financial asset in which it was placed. The system transmits the information of the trends in different graphic times, in this way the user is able to have a wide view of the movement of the asset, this type of tool makes the user have a higher hit rate by
Indicador en MQL5, recibe la información del precio SUAVIZADO, lo procesa anulando los picos inteligentemente, y el resultado lo envía al desarrollo de la escalera que iniciara y subirá o bajara según el peldaño o INTERVALO ingresado Ingreso PERIODO = 50 (variar segun uso) Ingreso MULTIPLICA AL PERIODO = 1 (variar segun uso) Segun la configuración la escalera puede pegarse o separarse de los precios,, Se aplica toda la linea de tiempo, y a todas las divisas, etc.  
Micro  ******************* Секундные графики MT5 ********************** Более точного инструмента для входа в сделку вы не найдёте. Входные параметры: Timeframe, sek - период построения графика, секунды Displayed bars - отображаемые бары Step of price levels, pp, 0-off - шаг отрисовки ценовых уровней, пункты Scale points per bar, 0-off - масштаб в пунктах на бар Show lines - отображение текущих уровней Show comment - отображение комментария Standard color scheme - стандартная цветовая сх
QuantXSTocks Trading Range Indicator for MT5: INSTRUCTIONS TO USE OUR INDICATOR:- User needs to take trade on Arrow or after an Arrow CandleStick, You can achieve up-to 35-125 pips target by this Indicator. Best Timeframes for Stocks and Indices are M30 and H1: AMAZON M30 (50 pips) TESLA M30 (50 pips) APPLE M30 (50 pips) ADOBE M30 (50 pips) NASDAQ100 H1 (125 pips) The above are the approximate amount of pips you can achieve by this Indicator, Green arrow appears to be buy arrow while the Red a
Super Suavizador
Cesar Juan Flores Navarro
Indicador en MQL5 que obtiene el promedio de 10 EMAS que son alineadas y procesadas según Fibonacci luego el promedio es suavizado"  Se ingresa un número de 2 a N que multiplica los EMA-Fibonacci y por consiguiente aumenta los fibonacci, resultando un promedio.   Se ingresa un número que suaviza los EMA-Fibonacci. Considerando los números 1/1 seria la suavización minima. Considerando los números 3/5 seria la suavización media. Considerando los números 10/30 seria la suavización alta.....etc
Trend and Signals MT5  indicator scans  30 trading Instruments (Forex, Metals and Indices).     It uses special algorithm on the  current market   based on   Pure Price Action   and display the overall trend and signal on the dashboard. When signals are produced the indicator sends alert and notification. Strategy for Signals This indicator uses the daily timeframe to determine the direction of the trend. The hourly timeframe is used to identify possible entries. Main trend and is determined by
This indicator is based on a mathematical formula and an ANN combined, designed to make a model(using previous prices) of the most recent market condition (any chart*) in order to use the model as a forecasting tool. *This indicator can operate on any chart/timeframe, but it's suggested you use multiple timeframes for each trade because this method relies solely on the time factor, you can not use this indicator to predict price volatility, but if it's fit correctly it will show you when the nex
This indicator is based on the crossing of two Moving Average with the RSI It is intended for scalpers Specially designed for Boom and Crash syhtetic indices from Binary.com/Deriv.com It is easy to use and intuitive. We recommend its use on M1 and is equipped with three types of notification Email alert Sound notification Push notification these parameters can be activated and deactivated.
このインジケーターは、「回帰チャンネルツール」のコンセプトに基づいた堅牢な市場分析手法を提供します。このツールを活用することで、トレーダーはチャートの回帰チャンネルに対して優れたコントロールを行い、より情報を得てトレードの決定を行うことができます。 回帰チャンネルツールは、トレーダーのツールボックスにおける強力な道具です。価格トレンドや潜在的なサポートと抵抗レベルに対する貴重な洞察を提供することを目的としています。このツールは特にトレンド内の修正波動を視覚化するのに効果的であり、価格のダイナミクスの包括的なビューを提供します。 以下は、このインジケーターを使用する際の主な特徴と利点について詳しく説明します: チャンネルレベルとサポート/レジスタンス:   このインジケーターの主な利点の一つは、動的なサポートとレジスタンスゾーンとして機能するチャンネルレベルを生成する能力です。これらのレベルは潜在的なエントリーポイントや出口ポイントを特定するのに重要であり、トレーディング戦略の精度を向上させます。 修正波動レベル:   修正波動レベルを有効にすることで、トレーダーは大きなトレンド内での潜
Use with JUMP 25. However it can can with the volatility indices as well because it is a modified version. It is advisable to use create a healthy account management. Measure your risk and happy trading. Other experts to be loaded soon. These are modified in order to optimise profits. Ideal candidates are high risk, high returns individuals who hold trades at a maximum of 1 - 2 hours
This indicator is a scalping indicator intended solely for the Boom and Crash indices of the Deriv Limited market It supports Boom 500, Boom 1000, Crash 500 and Crash 1000 Not repaint and no bug The settings are intuitive and easy to use The product activation number is 20 The Time Frame used depends on the user If you are an aggressive scalper then just use M1 For long trades use M15 If you are conservative use M5 Please contact me for more details of its use
RadioMedia
Cesar Juan Flores Navarro
Indicador de MQL5 basado en 3 EMAs, en función del precio. El precio influye en las EMAs, de tal forma que los Máximos y Mínimos solo la alteran minimamente, este influjo lo llame radio. Considerando la influencia del radio como constante, por lo que no tiene valores de entrada. Ideal para todas las criptomonedas. Funciona en todos los tiempos. Se sugiere operar cuando el precio este abajo y en bajada.... o cuando el precio este encima y en subida.
El Super Suavizador Inteligente es la culminación de la evolución de los suavizadores en funcion del precio, funciona en todos los pares de divisas, es fácil de usar, y puedes usarlo varias veces en un mismo par, afin de darte una idea de hacia donde va el precio, muy util para ver la tendencia a largo plazo. El SSI trata siempre de formar ondas de subidas y bajadas a fin de poder mostrar el máximo y/o mínimo de la tendencia del precio.
Tomamos 5 medios móviles las unimos en una la cual suavizamos y volvemos a suavizar, resultando un mega suavizador de medios móviles suavizadas. Indicador de mql5 funciona en cualquier broker y para todos los tiempos, siendo el mas optimo el de 5, 15 a mas. Funciona mejor en grupo consigo misma osea poner uno de 14 y otro de 50 y 400,, así se observa mejor su desempeño.
AIS MT5 INDICATOR 5 ALL INCLLUSIVE SET GUIDE CHAPTER 1  IMPORTANT INFORMATION <1> THIS INDICATOR IS ONE OF THE SERIES OF NEW AIS INDICATORS AIS MT5 INDICATOR 1 =ADVANCED CLASSIC= AIS MT5 INDICATOR 2 =MULTIFRAMES= AIS MT5 INDICATOR 3 =LINES= AIS MT5 INDICATOR 4 =MARKET PROFILES= AIS MT5 INDICATOR 5 =ALL INCLUSIVE SET CHAPTER 2 GENERAL FEATURES OF THE SERIES <1> AIS MT5 INDICATOR 1 =ADVANCED CLASSIC= < DEVELOPMENT PAUSED >     DISPLAYS MAIN TIME POINTS AND PRICE LEVELS OF THE CHART     
4つのアンサンブルに分割された12の人工ニューラルネットワーク 将来の価格変動の方向性を予測しようとしています: 小:1分、 中:5分、 大:30分、 ロイヤル:15分。 アクティブな高頻度取引のこのインジケーターは、すぐに使用できます EAは個別に起動され、インジケーターによって公開されたグローバル変数の形式でインジケーターからシグナルを受信します。 このインジケーターはストラテジーテスターでは機能しないため、ビデオを見るか、 1週間に限定された試用版のデモ版を提供するという要件を記載したリクエストを私のメールに書いてください。 tgwls2@gmail.com このプログラムは64ビットバージョンであり、コンピュータが OpenCLアクセラレータバージョン2.0以降をサポートし、 少なくとも8GBのRAMと最新のプロセッサ。 予測は、メインチャートウィンドウの右側に矢印として表示されます。 小さな期間-小さな矢印、大きなもの-大きなもの。 王室のアンサンブルには独自の矢印があります。 現在のバーに対する矢印の色とオフセットを変更できます メインウィンドウの右側、およびその他の
The Recuroid indicator shows very good entry points. Just look at the screenshots, then download the free version and look in the strategy tester and see for yourself. The system is based on two key algorithms. The first algorithm (managed) creates a system of balanced transition from the buy zone to the sell zone and vice versa, draws arrows and lines, and forms entries. The second algorithm (managing) corrects the initial data for the first algorithm (managed) by measuring virtual windows,
作者のその他のプロダクト
AI Channel
Thalles Nascimento De Carvalho
3.67 (3)
Welcome to the presentation of the AI Channel indicator, a powerful tool that uses artificial intelligence for price channel analysis in the financial market. In this session, we will explore how this revolutionary indicator can assist investors and traders in making more informed and strategic decisions. Let's get started! I. What is the AI Channel indicator? AI Channel is an indicator developed based on advanced artificial intelligence algorithms. It utilizes historical price data of financial
FREE
VolumeSecret
Thalles Nascimento De Carvalho
VolumeSecret: 取引量の力を手に入れよう プログラミングの挑戦の世界では、私たちは常に成長と進化を促す障害に直面しています。市場がもたらす困難、そしてトレーダーが最大のパフォーマンスを達成するために直面する課題を深く理解しています。だからこそ、私たちは市場での意思決定プロセスをより円滑で正確にするために、革新的なソリューションを絶えず開発しています。 VolumeSecret は、この献身的な努力の成果です。高度な取引量分析と強力で複雑な戦略を組み合わせたこのインジケーターは、市場を支配しようとする人々に決定的な優位性を提供します。 VolumeSecretとは? VolumeSecret は、価格変動の背後に隠された秘密を明らかにするために設計されたテクニカルインジケーターであり、取引量分析をコンパスとして使用し、高精度でエントリーとエグジットの機会を特定します。 VolumeSecretのメリット 深い取引量分析 :機関投資家の動きと隠れた市場フローを特定。 正確なシグナル :取引の最適化に役立つ明確で客観的なアラートを提供。 強力な戦略 :取引量と堅牢な
FREE
Swing Point Volume
Thalles Nascimento De Carvalho
Swing Point Volume, the indicator that signals weakness and strength at the tops and bottoms. This indicador can be for used the Wyckoff Method. Information provided; - Swing on customized ticks. - Volume and points in each balance sheet. - Percentage of Displacement. - Sound alert option on top and bottom breaks. - Volume in ticks and Real Volume. - Volume HL (extreme) or (opening and closing) - Customized volume shapes.
Atr Projection
Thalles Nascimento De Carvalho
ATRプロジェクション指標は、金融市場における価格の潜在的な動きの限界について正確な洞察を提供するために設計され、テクニカル分析において堅牢なツールとして際立っています。その柔軟なアプローチにより、ユーザーは各取引資産の特定のニーズに適応する形で直感的に分析メトリクスをカスタマイズすることが可能です。 カスタマイズ可能な動作: ATRプロジェクションは、デフォルトでは過去100本のローソク足の平均の30%を考慮して動作します。この柔軟性により、ユーザーは好みや各資産の固有の特性に合わせてメトリクスを調整でき、よりパーソナライズされた分析が可能です。 30%および100本のローソク足の選択の裏にある論理: 慎重な割合とローソク足の数の選択は、過去の動きを正確に捉え、より精密なプロジェクションを提供することを目的としています。この戦略的なアプローチは、価格が有意な動きの可能性が高い領域を強調し、トレーダーにより情報を提供します。 ATRプロジェクションの利点: 1. カスタマイズ可能なテクニカル精度: ユーザーは各取引資産の特定の条件に合わせてメトリクス
Box Weis Wave
Thalles Nascimento De Carvalho
5 (1)
Weis Wave Boxで分析を次のレベルへ! 精度と明確さを求めるトレーダーのあなたに、 Weis Wave Box は最適なツールです。この先進的なインジケーターは、ボリュームの波とスイングポイントの詳細な視覚分析を提供し、市場における努力と結果の関係をよりよく理解する手助けをします。 Weis Wave Boxの主な特徴: カスタマイズ可能なボリューム波: 自分の取引戦略に合わせてティック単位でボリューム波を調整できます。 調整可能な履歴: 特定の時間期間に焦点を当てて、より正確で関連性のある分析を行えます。 ティックと実際のボリューム: ティックと実際のボリュームを明確に区別し、より包括的な市場ビューを提供します。 上部のボックス可視化: ボリューム(エネルギー)が最も高かった場所と価格の変動が少なかった場所を明確に視覚化します。この視覚化により、努力と結果の関係を特定し、どの力が優位に立っているかを示し、将来の価格変動の可能性を示唆します。 ️ カスタマイズ可能なスイング形式: totalVol、length、width、barDVol、l
Long Short Pro
Thalles Nascimento De Carvalho
Long & Short インジケーター - Pro バージョン: 市場分析の無限の可能性を解き放とう! すべての資産に制限なし Long & Short インジケーターの Pro バージョンは、すべての金融資産に対して完全な自由を提供します。制限なしで、同じインジケーターをお気に入りのすべての資産に適用できます! 制限なし インジケーターのすべての機能を制限なしでお楽しみください。Pro バージョンは、完全かつ無制限の体験を提供し、市場のあらゆる機会を最大限に活用できるようにします。 Pro バージョンの特徴 無制限のアクセス : インジケーターをすべての金融資産で使用し、その完全な可能性を探ります。 高度な精度 : 詳細な分析と明確なシグナルを活用して、情報に基づいた安全な決定を下すことができます。 完全な柔軟性 : 資産や戦略に関係なく、取引のニーズに合わせてインジケーターを調整します。 重要な機会のアラートを受け取る アラートを有効にして、重要なレベルを注意深く監視し、市場機会の最前線に立ち続けましょう。 EA 作成のためのバッファ
Reversal Vol Propagation
Thalles Nascimento De Carvalho
Are you tired of missing out on trading opportunities by not being able to identify price reversals in time? Do you want to maximize your profits and make informed trading decisions? Introducing the Reversal Vol Propagation Indicator, the revolutionary tool that uses neural networks and volume data to predict potential price reversals. Based on a powerful combination of advanced algorithms and cutting-edge technology, the Reversal Vol Propagation meticulously analyzes volume patterns and past pr
Didi Index Volume
Thalles Nascimento De Carvalho
Didiインデックスボリュームをご紹介します。これは、ブラジルのトレーダーであるオディール・アギアールによって開発されたテクニカル分析の指標であり、金融市場での機会を特定するための先進的かつ強力なアプローチで注目されています。さまざまなプラットフォームで利用可能なDidiインデックスボリュームは、正確な洞察と貴重な情報を求めるトレーダーにとって不可欠なツールとなっています。 この指標は、オディール・アギアールによって作成された名高いDidiインデックスと、取引量の知恵を駆使した組み合わせです。この組み合わせにより、価格の動向と取引量の相互作用をより深く分析し、資産の動きに対するユニークな視点を提供します。 洗練されたアルゴリズムと加重平均の計算を用いて、Didiインデックスボリュームは取引量に基づいた価格変動を予測することができます。この特徴は、新興トレンドの特定、市場の反転、そして適切なエントリーポイントや出口ポイントのタイミングを把握する上で非常に重要です。 Didiインデックスボリュームを使用することで、正確な市場の解釈が可能な客観的かつ信頼性の高い情報にアクセ
Smart Binary Volume
Thalles Nascimento De Carvalho
スマートバイナリーボリューム指標は、トレーディングボリュームの分析と機械学習を組み合わせた多目的なツールです。スキャルピングや他の短期取引戦略を含むさまざまな市場や戦略に適用できます。高度な機械学習アルゴリズムを使用して、この指標は複雑なパターンを識別し、より正確な買いシグナルと売りシグナルを生成します。 Buffer to Create EA. Buffer Line Gold = 0. Buffer Line Red = 2 Buffer   AI  =  3 AI Buffer  >=  0  ("SIGNAL BUY") AI Buffer  <=  0  ("SIGNAL SELL") 使用上のヒント: 1. 反対の場合に注意してください:Smart Binary Volumeインジケーターのラインが反対の動きを示す場合に注意してください。この条件はエントリーシグナルを示す可能性があります。 2. 上昇のシグナル:青いラインが0.30より上にある場合、そして赤いラインが-0.30以下の領域にある場合に注意してください。この配置は上昇トレンドを
TimeChannel
Thalles Nascimento De Carvalho
The "Timechannel" is a powerful technical analysis tool designed specifically for traders who want to gain deeper and more accurate insights into price movements across multiple timeframes (multi-timeframe). This indicator is an essential addition to the toolbox of any serious trader seeking to make informed and data-driven trading decisions. Key Features: Advanced Multi-Timeframe Analysis : Timechannel allows traders to analyze price movements on different timeframes simultaneously. This is cr
DeltaBook
Thalles Nascimento De Carvalho
デルタブックインジケーターは、ボリュームデルタの使用とオーダーブックからの情報を組み合わせて、株式、先物、仮想通貨などの金融市場で価格の動きを検出する強力な市場分析ツールです。デルタブックはその最大の潜在能力を引き出すためにリアルタイムのボリュームデータとオーダーブック情報へのアクセスが必要です。 デルタブックの主要な特徴は、市場参加者の行動に関する詳細な情報に基づいてトレンドや取引機会を特定できる高度な市場分析戦略です。以下はデルタブックインジケーターを説明するためのいくつかのヒントと重要な要点です: ボリュームデルタ:ボリュームデルタは特定の時間枠内の買い手(需要)と売り手(供給)のボリュームの違いです。この指標は買い手と売り手の不均衡を数量的に示し、市場での買いと売りのプレッシャーの変化を特定するのに役立ちます。 オーダーブック:オーダーブックは市場のすべての買い注文と売り注文のリアルタイムの記録です。トレーダーが資産を買いたい価格や売りたい価格、それらの価格で取引したい資産の数量を表示します。デルタブックはオーダーブックの情報を使って市場参加者の行動を分析します。 価格の流れ:
Master OBV
Thalles Nascimento De Carvalho
MasterOBV:市場のトレンドを正確に把握しよう! MasterOBV は、 ボリューム 、 ポジティブコレレーション 、および 移動平均線(MA) を組み合わせた テクニカル分析指標 で、金融市場でのトレンドの識別を向上させます。 主な機能: スマートボリューム: 取引量を分析し、トレンドの強さにおける重要な変化を特定します。 ポジティブコレレーション: 相関のある資産を組み合わせ、ペアのボリュームに基づいて価格の移動の可能性を強化する、より広範で正確な視点を提供します。 ビジュアルチャンネル: ビジュアルチャンネルを利用して、トレンドの継続と反転の可能性を明確かつ正確に評価し、直感的な視覚分析を提供します。 スムーズな移動平均線: MA が価格の変動を平滑化し、基礎的なトレンドの方向を特定しやすくします。 なぜ MasterOBV を選ぶべきか? 決定の自信: 複数の要素を統合し、自信を持ってエントリーとイグジットの決定ができるようにします。 包括的な分析: 価格だけでなく、ボリューム、資産の相関関係、およびビジュアルチャンネ
Smart Delta Volume
Thalles Nascimento De Carvalho
Smart Delta Volume: ダイナミックな市場条件に適応する精密なツール Smart Delta Volume は、絶えず変化する市場の状況に対応するために設計された、高度なテクニカル指標です。このインジケーターは、ボラティリティに応じて自動的に調整されるダイナミックなレベルを利用して、出来高の流れと価格の動きの相互作用について、より包括的で信頼性の高い視点を提供します。この適応力は、特にボラティリティの高い市場で、迅速かつ正確なインサイトを求めるトレーダーにとって非常に重要です。 リトレースメントの客観的な確認: 偽シグナルを減らし、信頼性を向上させる Smart Delta Volume の最も強力な機能の1つは、そのリトレースメントのバリデーターです。この機能は、価格が2つのダイナミックなレベルを越えたときに自動的に作動し、リトレースメントの有効性を確認します。この客観的な確認は、リスクを最小限に抑え、偽シグナルを回避したいトレーダーにとって不可欠です。リトレースメントを確認することで、このインジケーターは特定されたトレンドへの信頼を高め、より情報に基づい
VolaMetrics VSA
Thalles Nascimento De Carvalho
VolaMetrics VSA | 技術分析の強力な味方 VolaMetrics VSA は、 Volume Spread Analysis (VSA) メソッドと詳細な 取引量分析 を組み合わせた技術分析指標です。 価格の重要な動き を 特定 し、 追跡 するために設計されたこのツールは、 取引量 と 価格スプレッド の相互作用を利用して、トレーディング決定をサポートする貴重な洞察を提供します。 Volume Spread Analysis (VSA) の基礎 Volume Spread Analysis (VSA) は、技術分析で尊敬されているメソッドで、 取引量 、 価格スプレッド 、および 価格の終値 の関係を特定の期間内で理解することに焦点を当てています。最も情報を持つオペレーター( スマートマネー )が価格の動きに影響を与えるという考えに基づき、VSA は 積み上げまたは分配のシグナル を特定し、価格の重要な変化を予測します。 VolaMetrics VSA の機能 ️ VolaMetrics VSA は、従来の VSA 分析を自動化し、 逆転の可能性があるシ
SwingVolumePro
Thalles Nascimento De Carvalho
概要 SwingVolumePro は、幅広い金融資産に適用できる高度で多用途なインジケーターであり、さまざまな取引スタイルをサポートします。厳密なボリュームと価格の分析に基づいて開発されており、すべてのレベルのトレーダーが高品質のデータに基づいて情報に基づいた意思決定を行うための明確で正確なシグナルを提供します。 主な特徴 多用途性: SwingVolumePro は、株式、外為(フォレックス)、暗号通貨など、さまざまな資産に適用できます。スキャルピングから長期ポジションまで、さまざまな取引戦略に対応しています。 正確で信頼できるシグナル: 高精度なシグナルを提供することに重点を置いているSwingVolumeProは、価格吸収パターンや市場のアグレッションを特定するために高度な技術を使用しています。これらのシグナルは明確に表示され、迅速かつ効果的な意思決定が容易になります。 高度なボリュームと価格の分析: インジケーターは、ボリュームと価格の相互作用の詳細な分析を使用して、努力と結果の間にズレがある状況を検出し、市場の潜在的な動きを示唆します。
CVD SmoothFlow Pro
Thalles Nascimento De Carvalho
CVD SmoothFlow Pro - すべての資産に対応した無制限のボリューム分析! CVD SmoothFlow Pro は、精密で無制限のボリューム分析を求めるトレーダーに最適なソリューションです。Cumulative Volume Delta(CVD)の計算と高度なノイズフィルタリングを使用することで、プロ版はあらゆる金融資産の取引に必要な柔軟性と精度を提供します。 CVD SmoothFlow Pro が提供するもの: クリアな分析 :ノイズをフィルタリングし、すべての金融資産における重要なボリュームの動きを際立たせます。 ️ 正確な計算 :買いと売りの差を監視し、外為、インデックス、暗号通貨などの資産におけるボリュームの詳細な動きを提供します。 直感的なインターフェース :データの表示が明確で、分析がわかりやすく効率的です。 トレンドの特定 :市場のトレンドを自信を持って特定し、情報に基づいた意思決定をサポートします。 実用的な用途: リアルタイムで任意の資産における買い手と売り手のバランスを監視します。 ボリュームに基づいてトレンドの反転
フィルタ:
fabioa333
19
fabioa333 2024.01.23 15:19 
 

Ótimo indicador, para quem já possui um operacional, desenvolvedor sempre disponível para esclarecimento de eventuais dúvidas.

Thalles Nascimento De Carvalho
6115
開発者からの返信 Thalles Nascimento De Carvalho 2024.01.23 15:24
Obrigado! 🙏
guigbz
19
guigbz 2023.12.20 15:00 
 

ユーザーは評価に対して何もコメントを残しませんでした

Thalles Nascimento De Carvalho
6115
開発者からの返信 Thalles Nascimento De Carvalho 2024.01.05 16:43
Obrigado pelo feedback! 🙏
Algoritmo poderoso em indices ,principalmente no WIN e WDO.
レビューに返信
バージョン 2.5 2024.05.16
atualização no menu input
バージョン 2.4 2024.05.14
Adicionado swing de volume (Esforço Vs Resultado)
バージョン 2.3 2024.04.22
Adicionado taxa de juros DI (correlação )
バージョン 2.2 2024.01.29
Adicionado volume profile!
バージョン 2.1 2024.01.17
Adicionado alerta email
バージョン 2.0 2024.01.12
added arrows for structure breach.
バージョン 1.6 2023.11.30
Update das marcações
バージョン 1.5 2023.11.29
Ajuste na contagem do volume.
バージョン 1.4 2023.11.21
Ajuste nas as targets
バージョン 1.3 2023.11.20
Otimização em objetos onchart
バージョン 1.2 2023.11.17
Melhorias no uso de hardware.