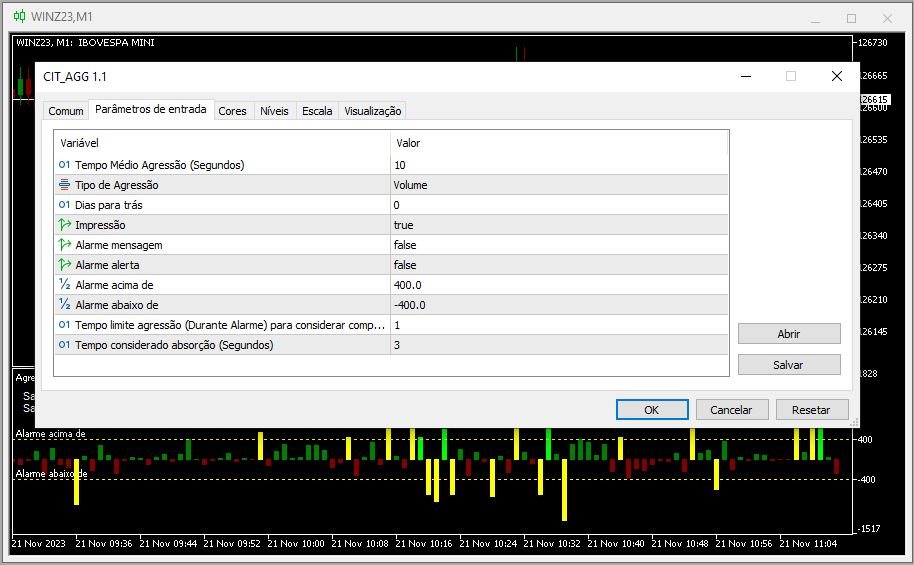
Agressao Acumulada
- インディケータ
- Mauricio Bornancin Cit
- バージョン: 1.1
- アップデート済み: 21 11月 2023
- アクティベーション: 5
Apresentação:
- O Indicador "Agressão Acumulada" da CIT Group é um indicador especializado na bolsa brasileira (B3).
Objetivo:
- Especificamente desenvolvido para o perfil de pessoas que operam IntraDay.
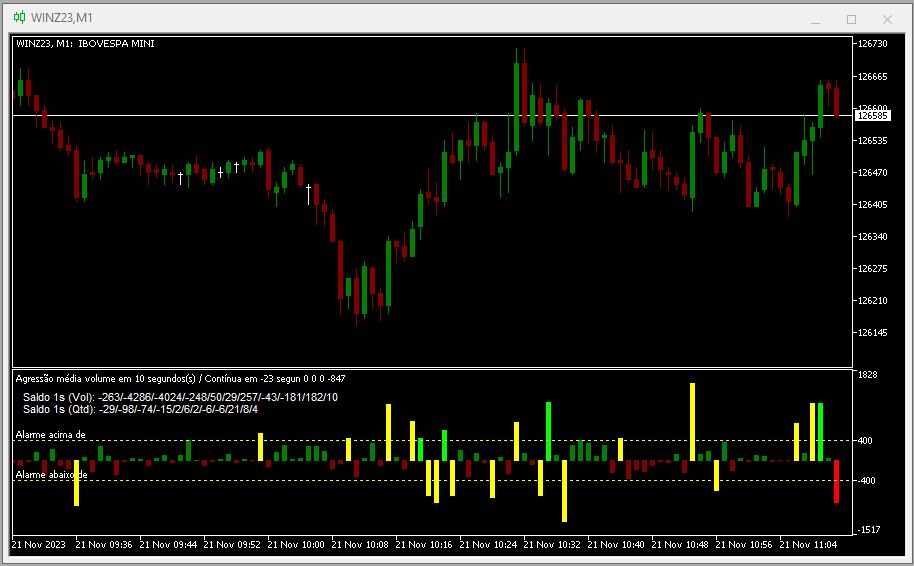
Funcionamento:
- Calculado com base nos trades realizados durante o pregão, sendo atualizado a cada 1 segundo, tendo maior precisão da agressão
Funcionalidades:
- Entrega de um conjunto de parâmetros para calcular a média de agressão (Volume ou Quantidade), estes podendo ser calculado por tempo configurável
- Opção para visualizar dias do passado para estudos, mas sugerimos para o momento das operações utilizar apenas o dia atual
- Pré-configurado com (Volume nos 10 segundos)
- Coloração por tipo de valor para representar valores zerados (Branco), positivos (verde escuro), negativos (Marrom), alarme (Amarelo), rompimento de compra em alarme (Verde Limão) , rompimento de venda em alarme (Vermelho) e consolidação em alarme (Rosa) permitindo ser configurável pelo usuário as cores