Black Horse indicator
- インディケータ
- Shengzu Zhong
- バージョン: 1.21
- アップデート済み: 18 11月 2023
- アクティベーション: 10
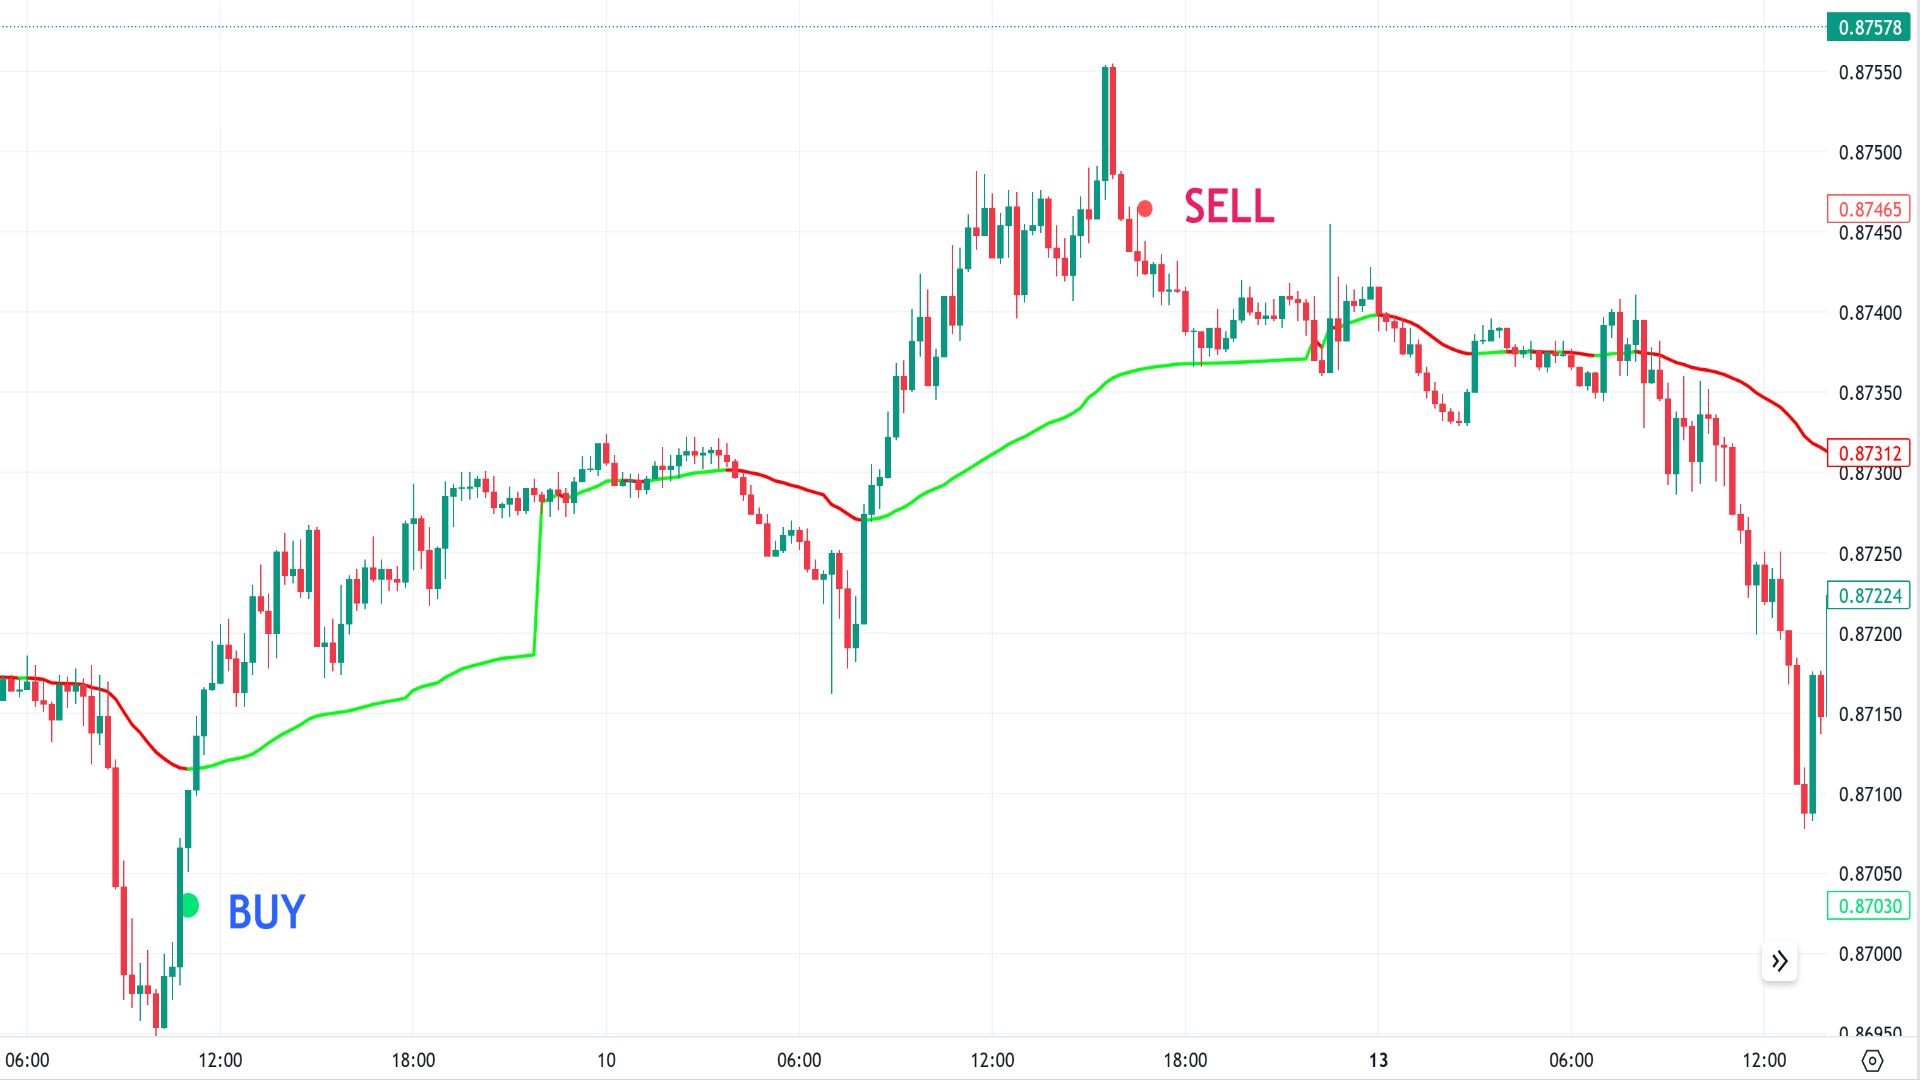
"Black Horse" インディケーターの目的は、価格アクションとVWAPインディケーターとの間のダイバージェンスを特定することです。これは潜在的な誤ったダイバージェンスを取り除き、高品質で正確なアラートを生成するためにフィルターを使用します。
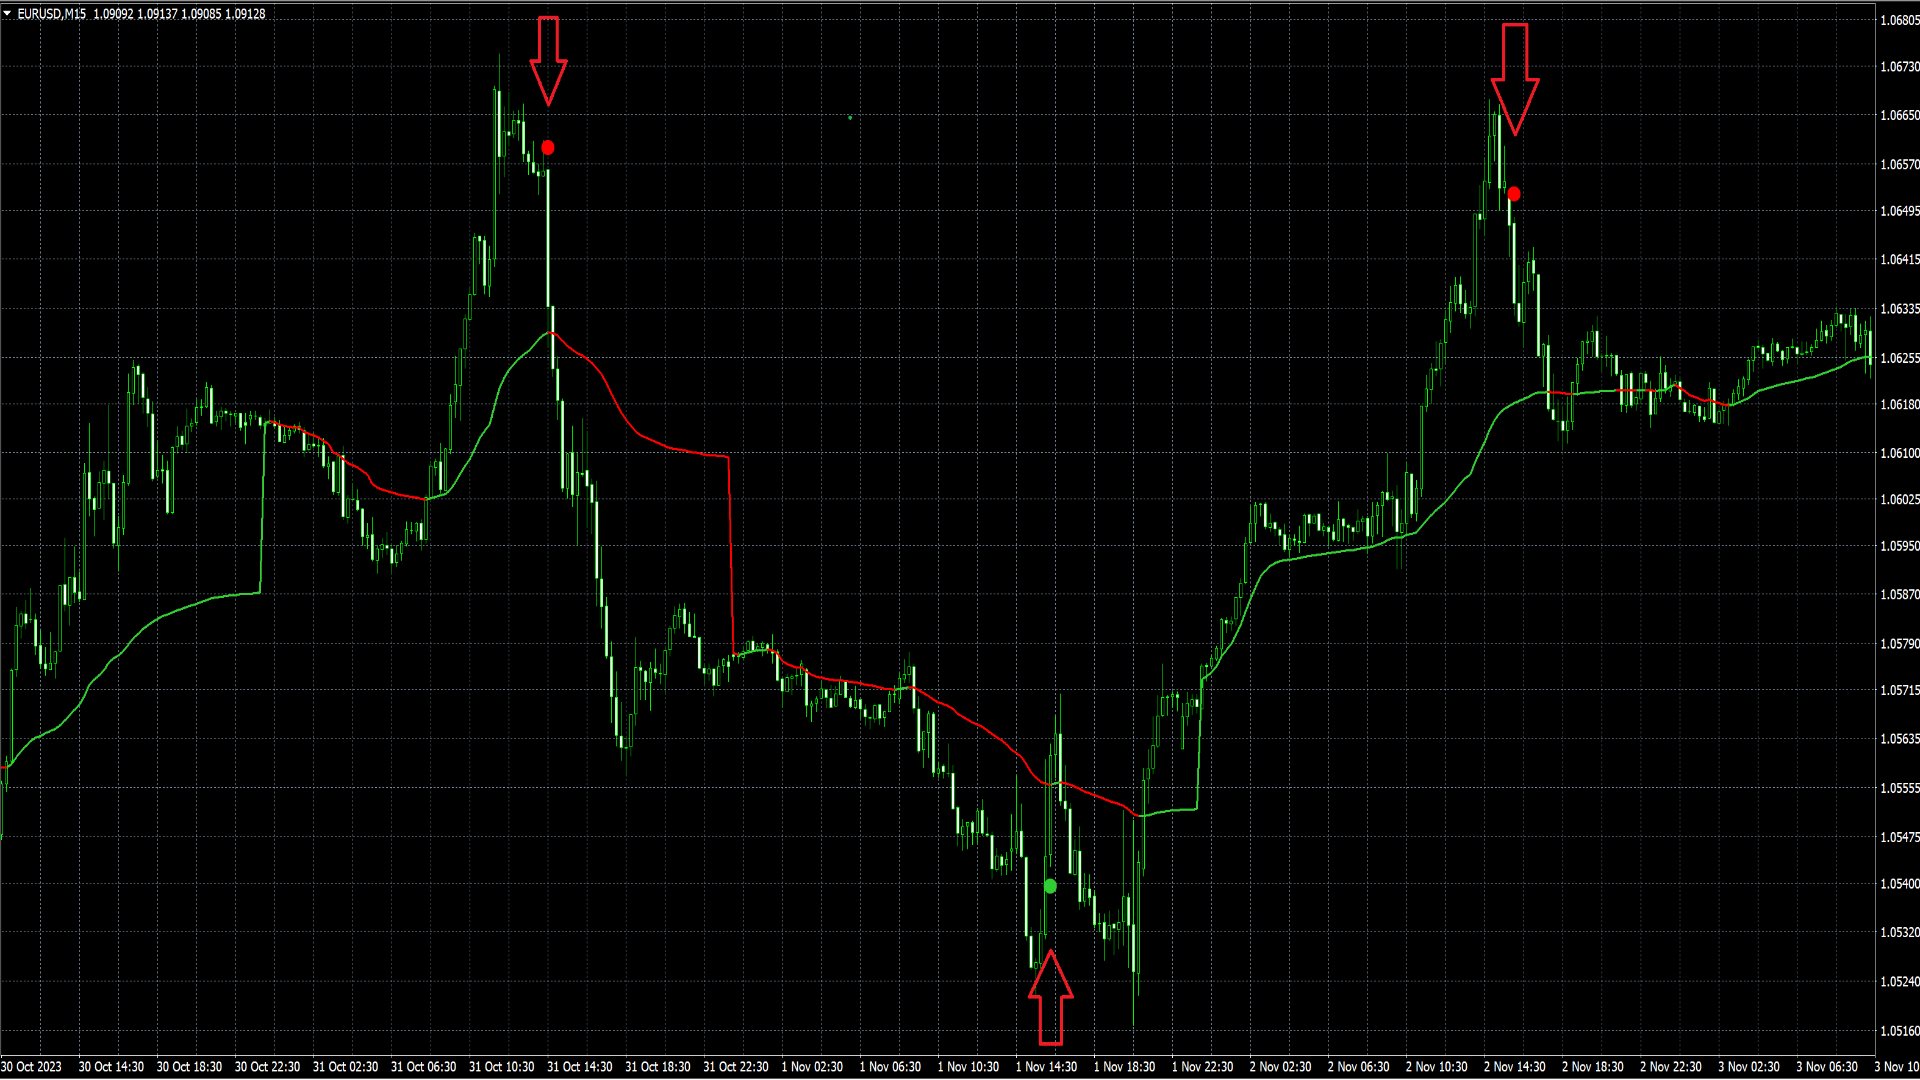
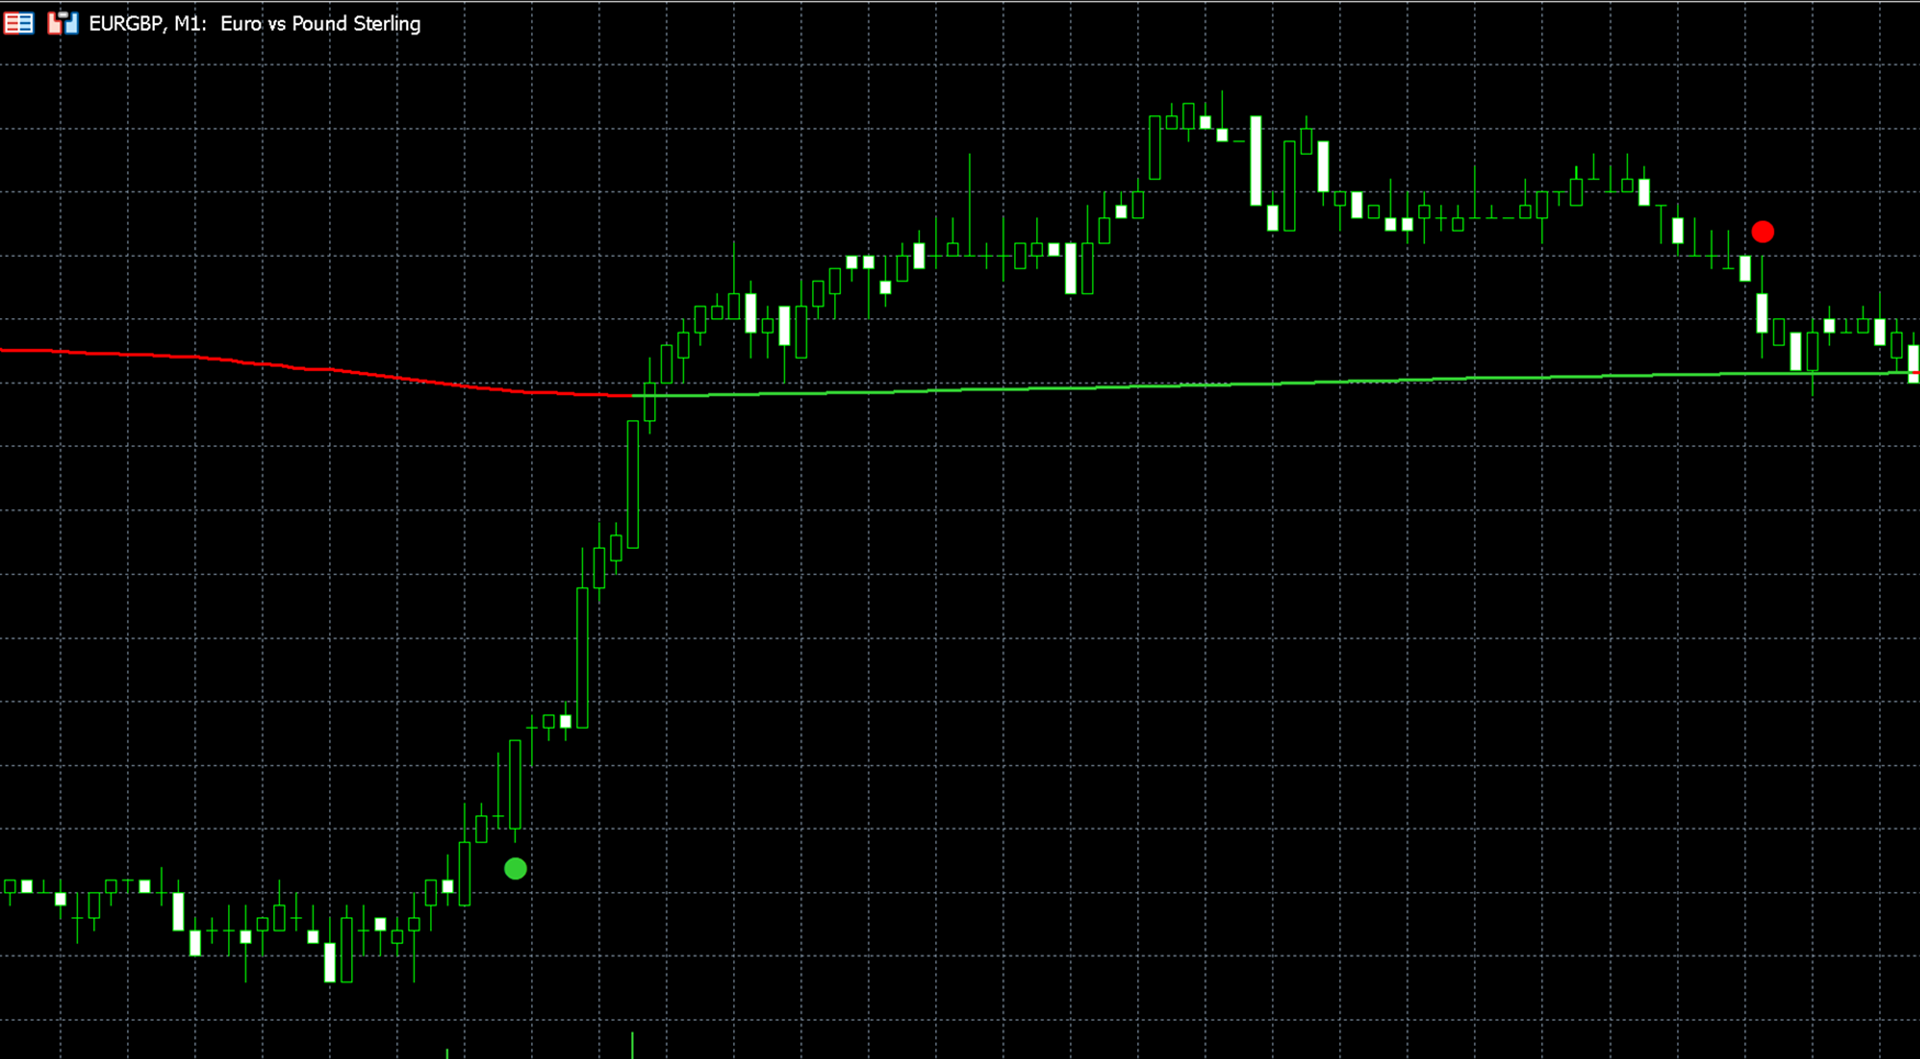
ベアリッシュなダイバージェンスは、キャンドルの上に表示される赤いドットで示され、ブルリッシュなダイバージェンスはキャンドルの下に緑のドットで表示されます。
ダイバージェンスの主なフィルターは、ATR(平均真のレンジ)および見直し期間内の前のキャンドルの価格変動を中心にしています。ダイバージェンスは、見直し期間内の価格変動が十分に鋭いことで、ATR倍数とATRをかけたものを上回ると判定されます。
計算の特性から、より高いタイムフレームで作業する際には、ATR倍数と見直し期間により低い値を設定することが望ましいです。より高いタイムフレームでは、価格変動がより平滑化されるため、15分足のようなシャープな価格変動はより頻繁に発生せず、通常はより少ないキャンドルに収束します。低いボラティリティの株式(HSBC、またはBACなど)も低いATR倍数と短い見直し期間を使用する必要があります。
"ビジュアル設定"セクションでは、VWAPラインの色を変更したり、交互に表示されるVWAPの色を表示したり、ダイバージェンスシグナルのサイズを調整したり、VWAPラインを表示または非表示にするオプションがあります。
ユーザーは評価に対して何もコメントを残しませんでした