MACD ZigZag AI Divergence Alert
- インディケータ
- Xiaoyu Huang
- バージョン: 1.0
- アクティベーション: 20
このインジケーターは、古典的な MACD インジケーターとジグザグ インジケーターを組み合わせて、価格とインジケーターの間の乖離を検出します。 また、高度な人工知能 (AI) テクノロジーを使用して、乖離の妥当性を検出します。
MACDは「インジケーターの王様」として知られていますが、ジグザグも非常に便利なインジケーターです。 この 2 つのインジケーターを組み合わせることで、このインジケーターは両方の長所を活用します。
発散の検出は確率論的な問題です。 多くの場合、乖離が発生した後に同じ方向へのさらなる価格変動が発生します。 そこで、高度なAI技術を活用して乖離の正当性を判断し、不正な乖離を排除し、さまざまな方法でユーザーに警告することを試みています。
割引価格:59$
特徴
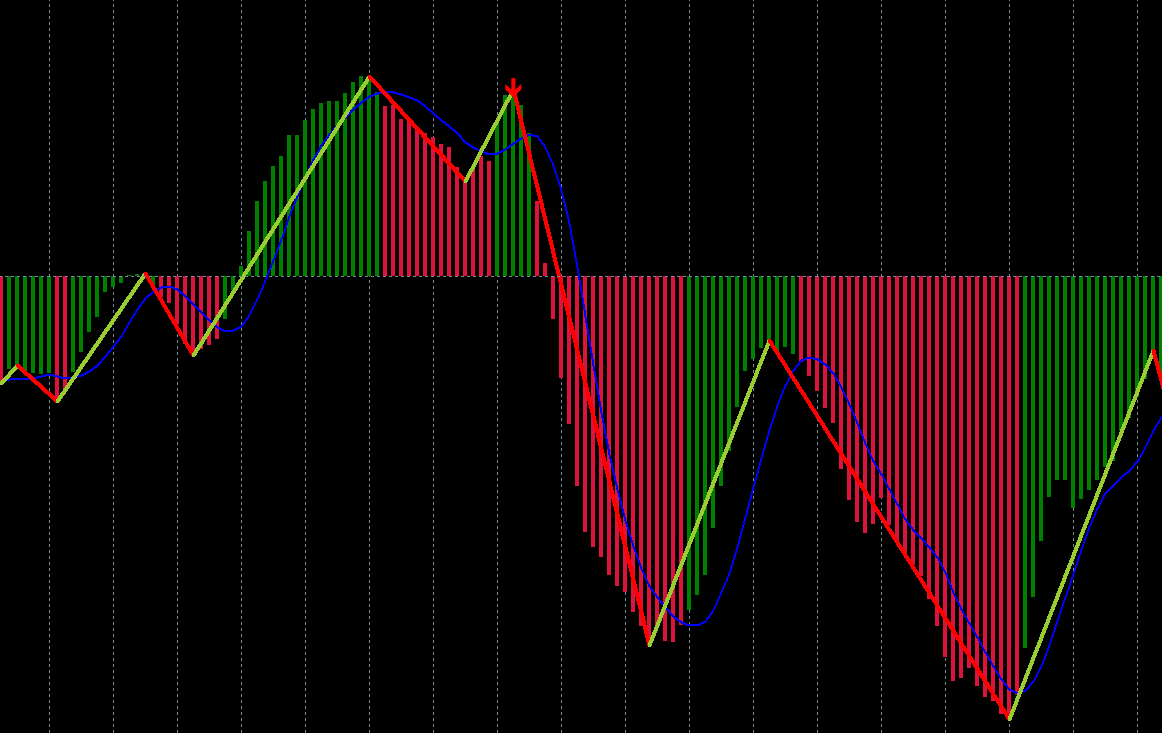
* MACD形式のジグザグインジケーター
* 価格とMACDインジケーターの間の乖離を検出します
※AI技術を活用して乖離の妥当性を検知
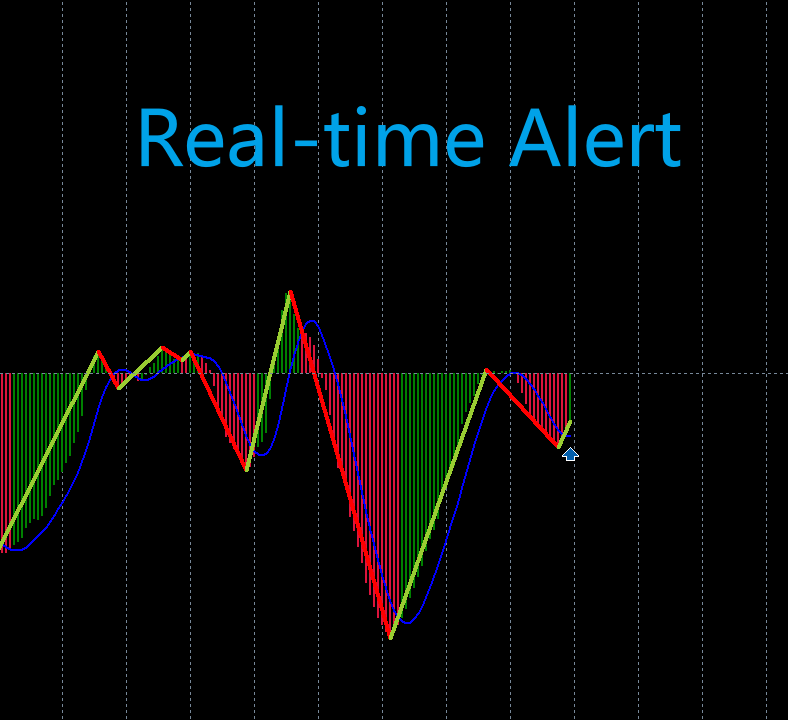
* ユーザーに発散信号を警告します
* 携帯電話を介してユーザーに発散信号を警告します
* 電子メールで発散シグナルをユーザーに警告します
* 複数の時間枠をサポート
* 強力な ONNX (Open Neural Network Exchange) モデル形式を使用
使用法
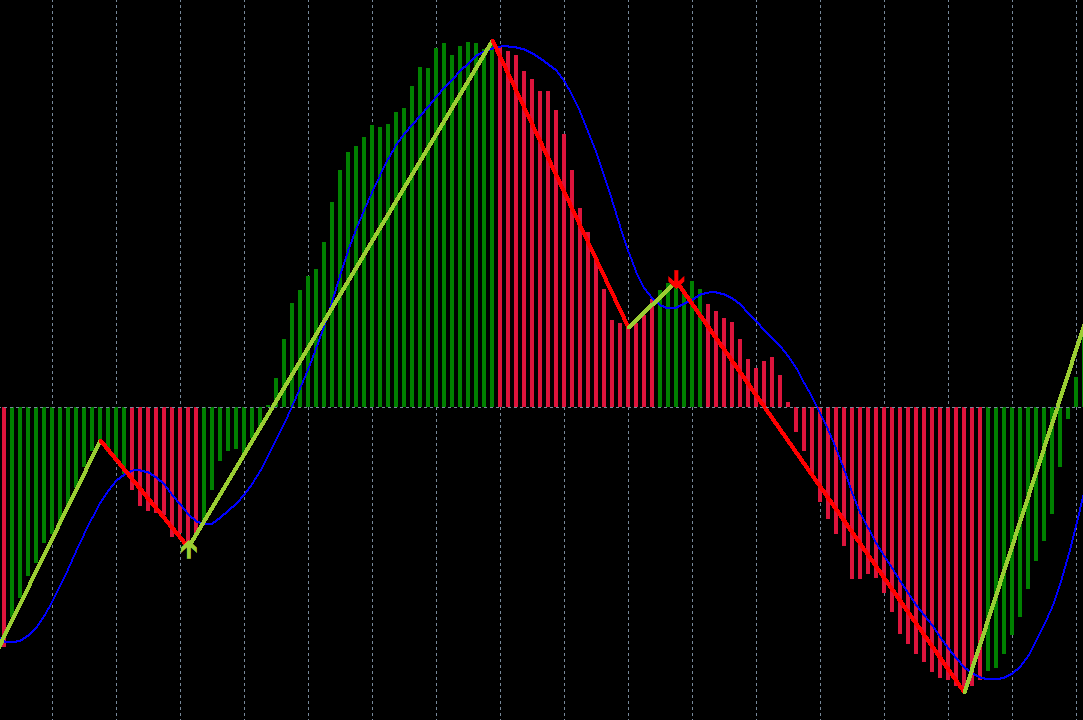
ボトムダイバージェンス:
単一の MACD が下を通過すると、インジケーターはそれが底値ダイバージェンスであるかどうかを検出します。 そうである場合、インジケーターは上向きの矢印を描き、ユーザーに警告します。
トップダイバージェンス:
単一の MACD が上を通過すると、インジケーターはそれがトップダイバージェンスであるかどうかを検出します。 そうである場合、インジケーターは下向きの矢印を描き、ユーザーに警告します。
入力パラメータ
高速 EMA 期間 = 12。
遅い EMA 期間 = 26;
信号 SMA 周期 = 9;
適用価格 = PRICE_CLOSE;
MaxCalculateBars = 2000;
UseAlertNotify = true;
UseMetaQuotesIDNotify = true;
UseMailNotify = true;
NofityPreMessage = "MACD ジグジグ ";
サブウィンドウ = 1;
タグ:トップダイバージェンス、ボトムダイバージェンス、価格アクション、スキャルピング戦略、マルチインジケーター、スマートインジケーター、ダイバージェンス認識、スイングトレーディング、ONNX