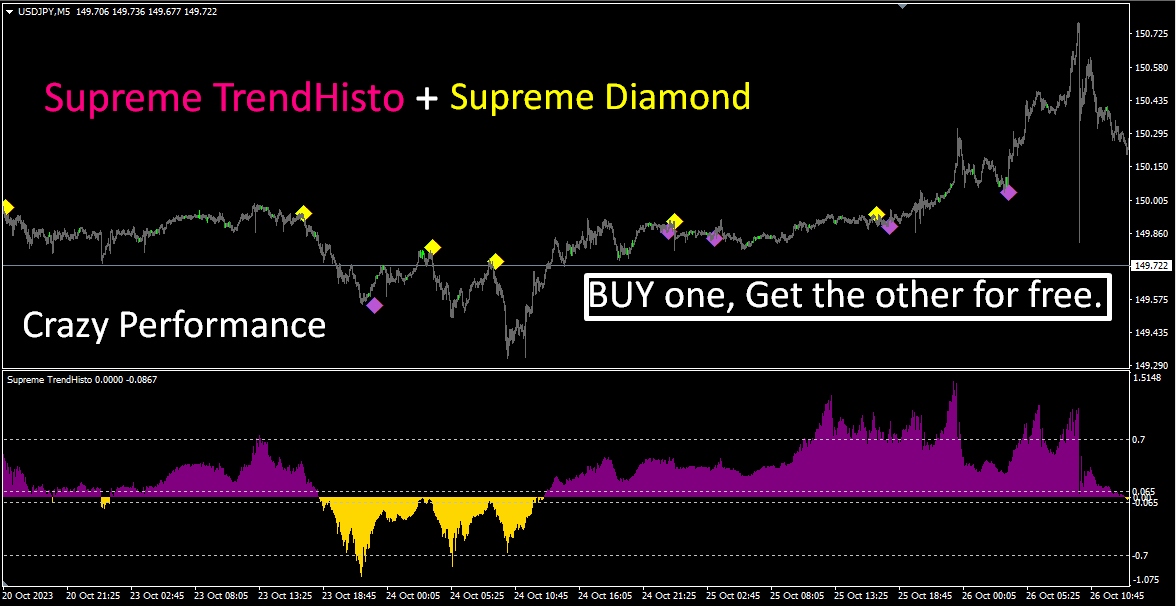
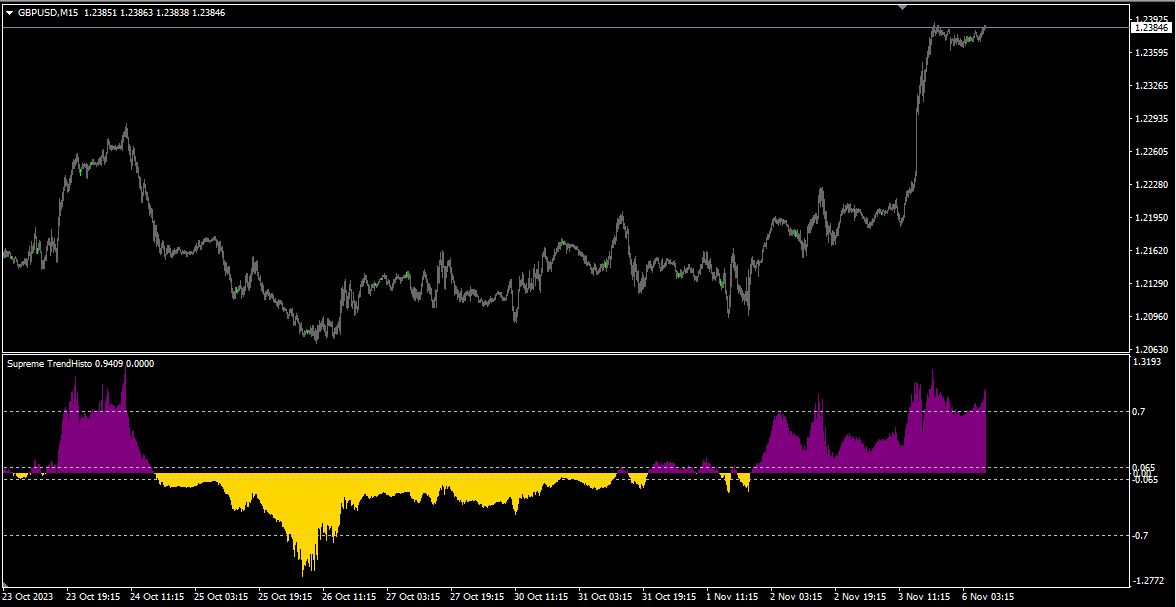
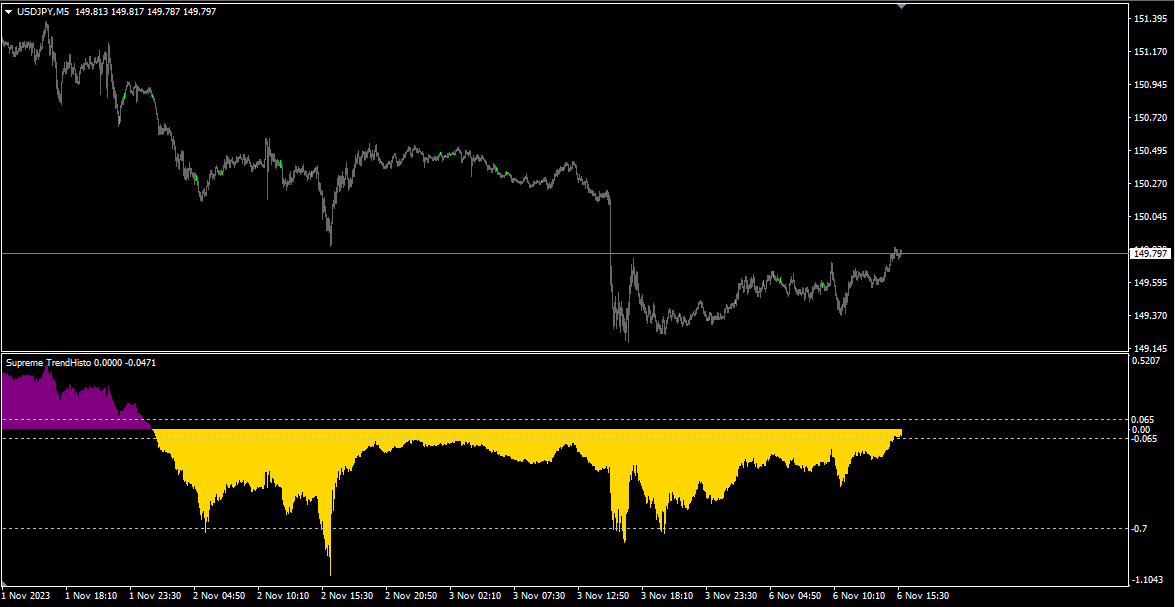
• 概要
  • レビュー
  • コメント

Supreme TrendHisto

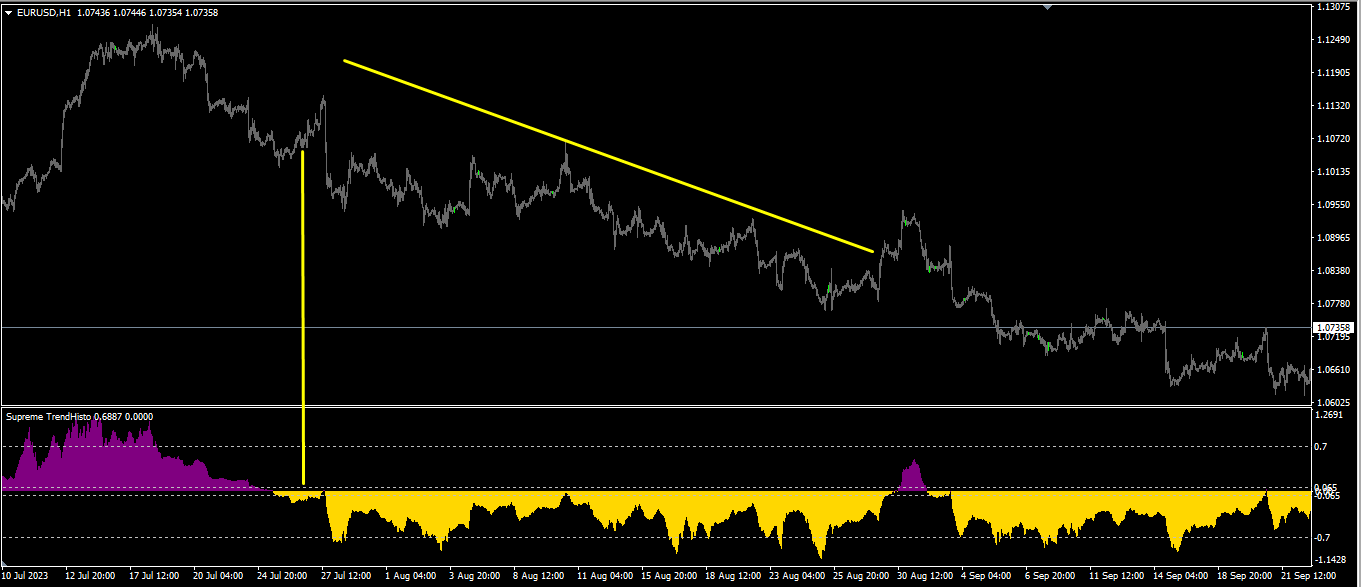
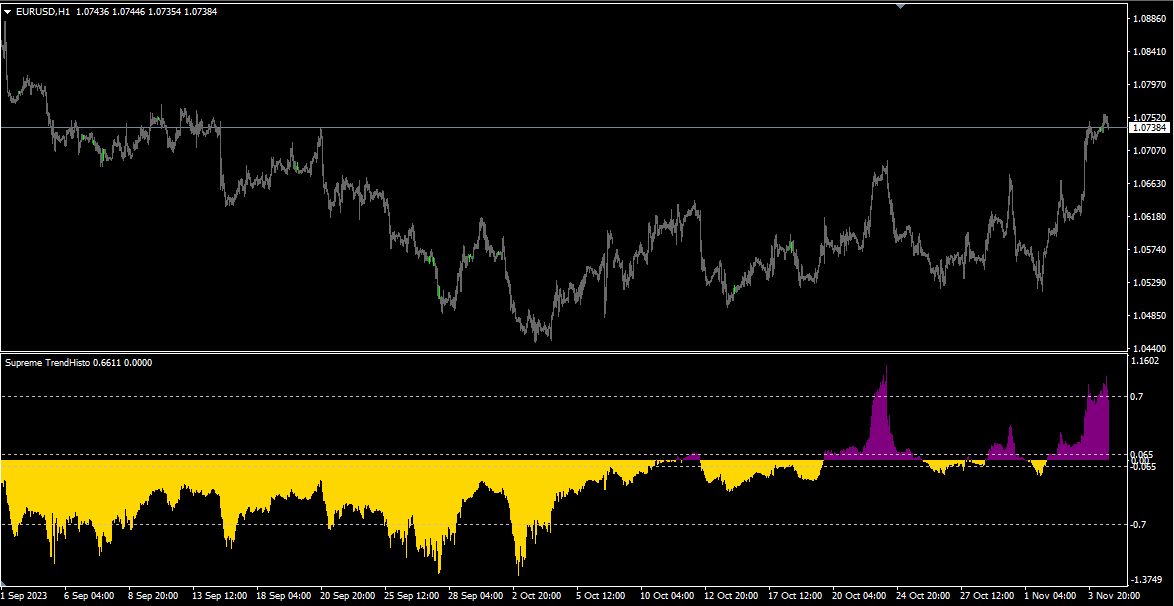
Supreme TrendHisto は、下降トレンドシグナルと上昇トレンドシグナルを与えるトレンドインジケーターです。インジケーターはヒストグラムとして機能し、インジケーターは再描画/バックペイント/遅延を行いません。
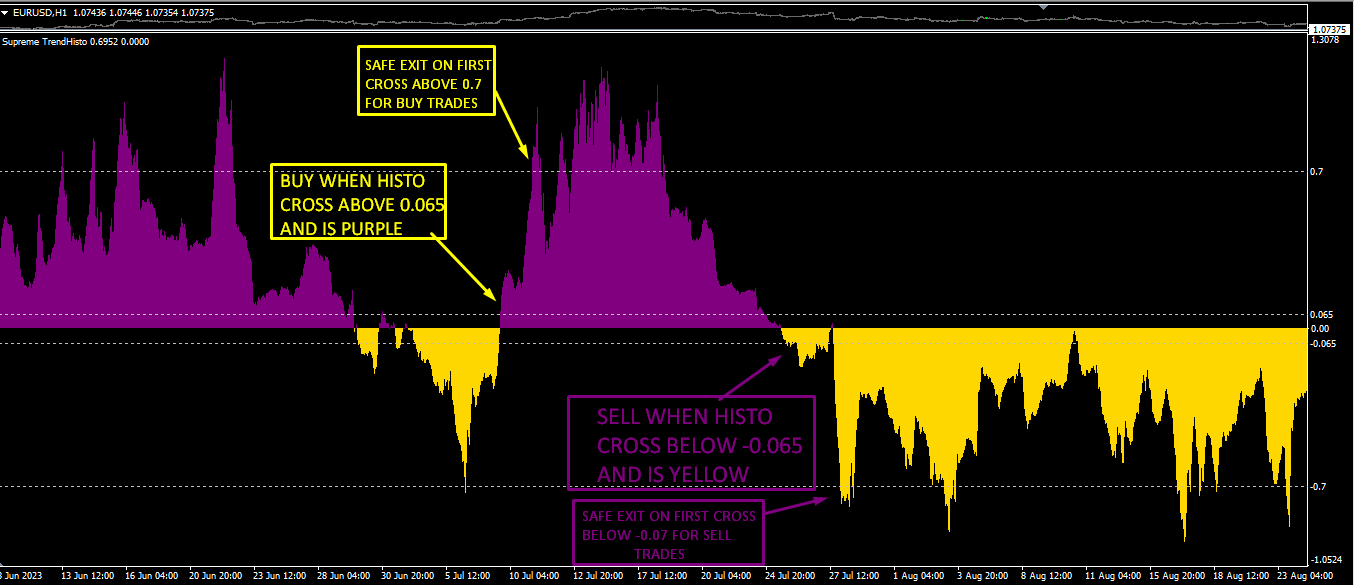
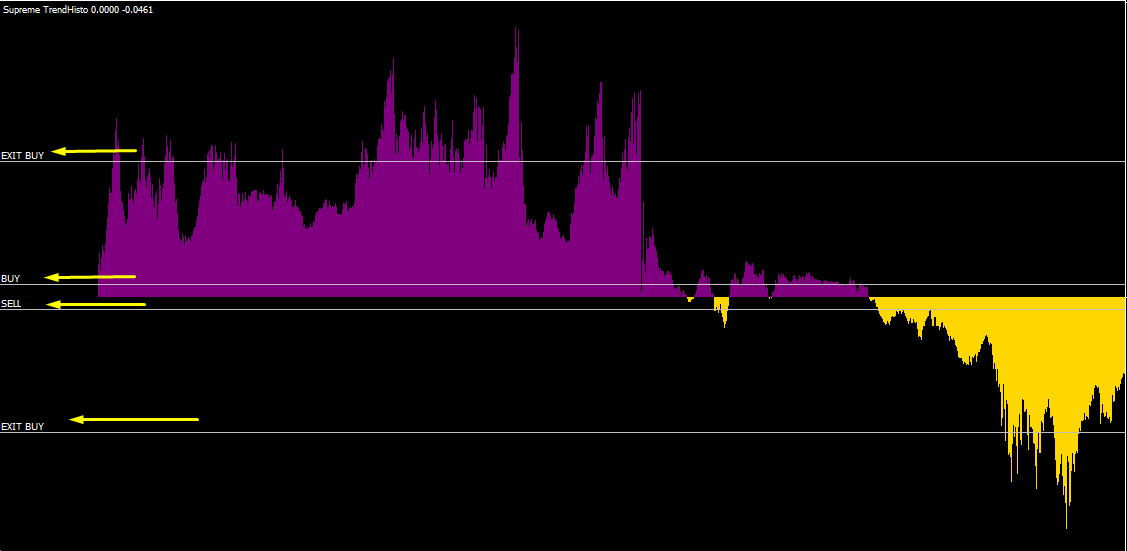
戦略

買いトレード: ヒストグラムが 0.65 を超えるクロスで、買いトレードを開始します。エグジットに関しては、ヒストグラムが 0.70 レベルに達したときにエグジットするか、十分にエグジットできます。

売りトレード: ヒストグラムが -0.65 を下回るクロス、買いトレードを開始します。エグジットに関しては、ヒストグラムが -0.70 レベルに達したときにエグジットするか、十分なレベルでエグジットできます。
===============================

推奨される期間 : 任意

推奨期間 : デフォルト

==========================================

パラメーター :

1.インジケーター期間(スキャルピングの場合は低く、スイングトレードの場合は高くなります)

2.計算タイプ(クローズ/オープン/ハイロー...など)

3.最大バー (表示する履歴の数)

4.mode fast (true を維持)

================================================= ================================================= ========================
おすすめのプロダクト
The indicator detects and displays Shark harmonic pattern (see the screenshot). The pattern is plotted by the extreme values of the ZigZag indicator (included in the resources, no need to install). After detecting the pattern, the indicator notifies of that by a pop-up window, a mobile notification and an email. The indicator highlights the process of the pattern formation and not just the complete pattern. In the former case, it is displayed in the contour triangles. After the pattern is comple
Introducing the Consecutive Green/Red Candle Alert Indicator for MT4 - Your Trend Spotting Companion! Are you ready to take your trading to the next level? We present the Consecutive Green/Red Candle Alert Indicator, a powerful tool designed to help you spot trends and potential reversals with ease. Whether you're a new trader looking for clarity in the market or an experienced pro seeking additional confirmation, this indicator is your trusted companion. Key Features of the Consecutive Green/Re
FREE
Trend PA
Mikhail Nazarenko
5 (3)
The Trend PA indicator uses   Price Action   and its own filtering algorithm to determine the trend. This approach helps to accurately determine entry points and the current trend on any timeframe. The indicator uses its own algorithm for analyzing price changes and Price Action. Which gives you the advantage of recognizing, without delay, a new nascent trend with fewer false positives. Trend filtering conditions can be selected in the settings individually for your trading style. The indicator
標準パラメーターを使用したMACDインジケーター波に基づく 最後と最後の2つのMACDウェーブで、それぞれ正と負のフィボナッチレベルを扱います。 現時点でMACDインジケーターで負の波が終了している場合、色は緑です。 現時点でMACDインジケーターの正の波が終了している場合、色は赤です。 Waveの終了基準は、MACDの符号が異なる2ティックです。 最後の4つのMACDウェーブのトレンドラインをプロットします。 専門家とうまく働く  その他のスクリーンショット: Figures MACD   https://www.mql5.com/ru/market/product/42031 https://www.mql5.com/en/charts/10581596/audusd-h1-alpari-international https://www.mql5.com/en/charts/10631979/usdjpy-m1-alpari-international https://www.mql5.com/en/charts/10628704/gbpusd-
トレンドキャッチャー: アラートインジケーター付きのトレンドキャッチャーストラテジーは、市場トレンドやポテンシャルなエントリーポイントやエグジットポイントを特定するのに役立つ多目的な技術分析ツールです。動的なトレンドキャッチャーストラテジーを備えており、市場状況に適応してトレンドの方向を明確に視覚化します。トレーダーは、自身の好みやリスク許容度に合わせてパラメーターをカスタマイズできます。このインジケーターはトレンドの識別を支援し、ポテンシャルなリバーサルをシグナルし、トレイリングストップのメカニズムとして機能し、市場への迅速な対応のためのリアルタイムアラートを提供します。 特徴: - トレンドの識別:上昇トレンドと下降トレンドをシグナルします。 - トレンドのリバーサル:ローソク足の色が上昇から下降に変わった場合やその逆の場合に、ポテンシャルなリバーサルを警告します。 - リアルタイムアラート:新しいトレンドの識別に対するアラートを生成します。 推奨事項: - 通貨ペア:EURUSD、AUDUSD、XAUUSDなど... - タイムフレーム:H1。 - アカウン
FREE
This product is a part of  ON Trade Waves Patterns Harmonic Elliot Wolfe you can test free version on EURJPY from this link  Wolf Waves Indicator ウルフウェーブを発見しよう - あなたの究極の取引ツール! どんな時間軸でも簡単にウルフウェーブを見つけるための強力なツールを探していますか?もう探す必要はありません!私たちのウルフウェーブインジケーターは、その仕事を簡単にこなします。なぜこのインジケーターがあなたにぴったりか、以下でご紹介します。 主な特徴: 自動検出: ウルフウェーブインジケーターは、複雑なアルゴリズムを使用して、チャート上のキーポイントを自動的に見つけ、対応するラインを描画します。手動でパターンを探す手間が不要です。 使いやすさ: このインジケーターはシンプルなデザインで、経験豊富なトレーダーからウルフウェーブ初心者まで、誰でも簡単に利用できます。 高精度: 数多くのウルフウェーブインジケーターの中で、当社のものは完璧
Day Pattern
Oleksandr Martsynyshen
Description: - D ay Pattern - an indicator that helps to identify patterns of price changes for the development of trading algorithms and strategies. For whom this tool? - For developers of trading strategies and algorithms. - Medium- and long-term traders. Time frames H1-W1. Features of the indicator: - There is a function of exporting indicator values to a file of the csv format. - Using the information panel, you can conduct an express analysis of trading tool. - The indicat
The indicator displays signals according to the strategy of Bill Williams on the chart. Demo version of the indicator has the same features as the paid, except that it can work only on a demo account . Signal "First Wise Man" is formed when there is a divergent bar with angulation.  Bullish divergent bar - with lower minimum and closing price in the upper half. Bearish divergent bar - higher maximum and the closing price at the bottom half. Angulation is formed when all three lines of Alligat
FREE
Owl smart levels
Sergey Ermolov
4.34 (35)
MT5版  |   FAQ Owl Smart Levels Indicator   は、 Bill Williams   の高度なフラクタル、市場の正しい波構造を構築する Valable ZigZag、エントリの正確なレベルをマークする Fibonacci レベルなどの一般的な市場分析ツールを含む 1 つのインジケーター内の完全な取引システムです。 利益を得るために市場と場所に。 戦略の詳細な説明 インジケータを操作するための指示 顧問-取引助手 プライベートユーザーチャット ->購入後に私に書いて、私はプライベートチャットにあなたを追加し、あなたはそこにすべてのボーナスをダウンロードすることができます 力はシンプルさにあります! Owl Smart Levels   取引システムは非常に使いやすいので、専門家にも、市場を勉強し始めて自分で取引戦略を選択し始めたばかりの人にも適しています。 戦略と指標に秘密の数式や計算方法が隠されているわけではなく、すべての戦略指標は公開されています。 Owl Smart Levels を使用すると、取引を開始するためのシグナルをすばやく確認し、
VR Cub
Vladimir Pastushak
VR Cub は、質の高いエントリーポイントを獲得するためのインジケーターです。このインジケーターは、数学的計算を容易にし、ポジションへのエントリーポイントの検索を簡素化するために開発されました。このインジケーターが作成されたトレーディング戦略は、長年にわたってその有効性が証明されてきました。取引戦略のシンプルさはその大きな利点であり、初心者のトレーダーでもうまく取引することができます。 VR Cub はポジション開始ポイントとテイクプロフィットとストップロスのターゲットレベルを計算し、効率と使いやすさを大幅に向上させます。取引の簡単なルールを理解するには、以下の戦略を使用した取引のスクリーンショットを見てください。 設定、設定ファイル、デモ版、説明書、問題解決方法は、以下から入手できます。 [ブログ] レビューを読んだり書いたりすることができます。 [リンク] のバージョン [MetaTrader 5] エントリーポイントの計算ルール ポジションをオープンする エントリーポイントを計算するには、VR Cub ツールを最後の高値から最後の安値までストレッチする必要があります。
Chart Patterns Detect 15 patterns (Ascending Triangle, Descending Triangle, Rising Wedge, Falling Wedge, Bullish Flag, Bearish Flag, Bullish Rectangle, Bearish Rectangle Symmetrical triangle, Head and Shoulders, Inverted Head and Shoulders, Triple top, Triple Bottom, Double Top, Double Bottom) Use historical data to calculate the probability of each pattern to succeed (possibility to filter notification according to the chance of success) gives graphic indication about the invalidation level and
Introduction to X3 Chart Pattern Scanner X3 Cherart Pattern Scanner is the non-repainting and non-lagging indicator detecting X3 chart patterns including Harmonic pattern, Elliott Wave pattern, X3 patterns, and Japanese Candlestick patterns. Historical patterns match with signal patterns. Hence, you can readily develop the solid trading strategy in your chart. More importantly, this superb pattern scanner can detect the optimal pattern of its kind. In addition, you can switch on and off individu
"The trend is your friend" is one of the best known sayings in investing, because capturing large trendy price movements can be extremely profitable. However, trading with the trend is often easier said than done, because many indicators are based on price reversals not trends. These aren't very effective at identifying trendy periods, or predicting whether trends will continue. We developed the Trendiness Index to help address this problem by indicating the strength and direction of price trend
インジケータは、チャート上の端子RSI発振器に基づく信号を示しています。 繰り返し信号をフィルタリングすることができます。 ここでは、発振器は逆信号を検索するために使用されます。 これは、レベルからスイング戦略や取引のエントリポイントとして推奨されます。 マルチ通貨ダッシュボードが利用可能です。 それを使用すると、簡単にチャートを切り替えることができます。 製品のディスカッションでは、ダッシュボードを埋め込むことができるアルゴリズムを提案できます。 入力パラメータ 。 主な設定 。 Bars Count – インジケータが動作する履歴バーの数 。 RSI Period – オシレーター周期 。 RSI Level – オシレータのレベル。 発振器は0と100の間に行きます。 10を選択すると、信号は10以上90以下になります 。 RSI Applied Price 。 Repeat Signal - 繰り返し信号 。 Enable – すべての繰り返し信号は、矢印/アイコンで表示されます 。 No Signal – 繰り返されるものはすべて無視されます 。 視覚的
FREE
[ZhiBiCCI]インディケータは全てのサイクル使用に適しており、そして全ての市場品種にも適しています。 [ZhiBiCCI]緑色の実線は強気の発散の逆転です。緑色の点線は古典的な強気の発散です。 [ZhiBiCCI]赤への実線は逆弱気の発散である。赤い点線は古典的な弱気の発散です。 [ZhiBiCCI]はパラメータ(アラート、メール送信、通知送信)で設定でき、(true)に設定するとインスタント信号をアラームウィンドウに送信し、Eメール、インスタントメッセージを送信できます。 パラメータ設定の説明 [displayAlert]:これはアラームスイッチで、trueに設定され、矢印が表示されればプロンプトに自動的に警告され、falseに設定されれば警告されません。 [sendmail_NO_OFF]:これはメールを送信するためのスイッチで、trueに設定します。矢印が表示されていればMT4で設定したメールボックスにメールを送信し、falseに設定されていればメールを送信しません。 [sendnotification_NO_OFF]:これはインスタントメッセー
The indicator displays the data of the Stochastic oscillator from a higher timeframe on the chart. The main and signal lines are displayed in a separate window. The stepped response is not smoothed. The indicator is useful for practicing "manual" forex trading strategies, which use the data from several screens with different timeframes of a single symbol. The indicator uses the settings that are identical to the standard ones, and a drop-down list for selecting the timeframe. Indicator Parame
MT4用FXインジケーター「MACD with Trend ZigZag」 MACD インジケーター自体は、トレンド取引で最も人気のあるツールの 1 つです。 「MACD with Trend ZigZag」は、プライスアクションエントリーや他のインジケーターと組み合わせて使用するのに最適です このインジケーターを使用して、最も正確なエントリーシグナルを選択します。 - MACD が 0 (緑色) より上で、ジグザグ ラインが上向きの場合 - 買値アクション パターンのみを検索します - MACD が 0 (ピンク色) 未満で、ジグザグ ラインが下向きの場合 - 売り価格アクション パターンのみを検索します インジケーターにはモバイルおよび PC アラートが組み込まれています // さらに優れたエキスパートアドバイザーとインジケーターはここから入手できます: https://www.mql5.com/en/users/def1380/seller 当MQL5サイトのみでご提供しているオリジナル商品です。
The main idea of this indicator is rates analysis and prediction by Fourier transform. Indicator decomposes exchange rates into main harmonics and calculates their product in future. You may use the indicator as a standalone product, but for better prediction accuracy there is another related indicator - FreqoMaster - which uses FreqoMeterForecast as a backend engine and combines several instances of FreqoMeterForecast for different frequency bands. Parameters: iPeriod - number of bars in the ma
インディケータは現在のクオートを作成し、これを過去のものと比較して、これに基づいて価格変動予測を行います。インジケータには、目的の日付にすばやく移動するためのテキスト フィールドがあります。 オプション: シンボル - インジケーターが表示するシンボルの選択; SymbolPeriod - 指標がデータを取る期間の選択; IndicatorColor - インジケータの色; HorisontalShift - 指定されたバー数だけインディケータによって描画されたクオートのシフト; Inverse - true は引用符を逆にします。false - 元のビュー。 ChartVerticalShiftStep - チャートを垂直方向にシフトします (キーボードの上下矢印)。 次は日付を入力できるテキストフィールドの設定で、「Enter」を押すとすぐにジャンプできます。
The perfect tool for Scalng in the Forex markets You can trade both from signal to signal and using take profit  The algorithm does not use Zigzag!  No redrawing!  This is a channel instrument that uses a moving average as a filter. Moving Average  There are 2 parameters for the settings Ma Period = 5 period Moving Average  Channel 1.0 distance of channel lines from the chart Price Signal Filter - calculation of signal opening and filter There is a complete set of Alert There is a multi-timefram
The indicator shows which trading pairs, strategies, robots and signals that you use are profitable and which are not. The statistic of trades and balance graph are displayed in the account currency and pips - to switch simply click on the graph. button "$"(top left) - minimize/expand and move the indicator panel button ">"(bottom right) - stretching and resetting to the original size Statistic of trades 1 line - account balance, current profit and lot of open trades; 2 line - the number of al
Trend Scanner
Vladimir Kalendzhyan
4.33 (6)
By purchasing this indicator, you have the right to receive a free copy of one of   my other indicator's or advisor’s!  (All future updates are included. No limits) . To get it , please contact me by  mql5 message ! The Trend Scanner trend line indicator displays the trend direction and its changes. The indicator works on all currency pairs and  timeframes. The indicator simultaneously displays multiple readings on the price chart: the support and resistance lines of the currency pair, the exist
The indicator shows the potential trend direction by cyclical-wave dependence. Thus, all the rays of the intersection will be optimal rays, in the direction of which the price is expected to move, taking into account the indicator period. Rays can be used as a direction for potential market movement. But we must not forget that the approach must be comprehensive, the indicator signals require additional information to enter the market.
まず第一に、この取引インジケーターは再描画されず、再描画されず、遅延しないことを強調する価値があります。これにより、手動取引とロボット取引の両方に理想的なものになります。 ユーザーマニュアル:設定、入力、戦略。 アトミックアナリストは、価格の強さとモメンタムを利用して市場でより良いエッジを見つけるためのPA価格アクションインジケーターです。ノイズや誤ったシグナルを除去し、取引ポテンシャルを高めるための高度なフィルターを備えています。複雑なインジケーターの複数のレイヤーを使用して、アトミックアナリストはチャートをスキャンし、複雑な数学的計算をシンプルなシグナルと色に変換します。これにより、どのような初心者トレーダーでも理解して使用し、一貫した取引の決定を行うことができます。 「アトミックアナリスト」は、新規および経験豊富なトレーダー向けにカスタマイズされた包括的な取引ソリューションです。プレミアムインジケーターとトップノッチの機能を1つの取引戦略に組み合わせ、すべてのタイプのトレーダーにとって汎用性のある選択肢にします。 デイリートレーディングとスキャルピング戦略:高
Reversal Pattern Pro
Boonyapagorn Rodvattanajinda
Reversal Patterns Pro Reversal Patterns Pro is a Price Action (PA) analytical tool that scans the reversal patterns.  - Finds and marks the most dependable Japanese candlestick patterns in real-time. - Supports all time frames (Best for Scalping) - Doesn't repaint making it an exceptional indicator for Expert Advisors. Input parameters : - Support & Resistance Mode ( true or false ) for enabling advanced filtering - Donchian Period - RSI Period - RSI Oversold Level - RSI Overbought Level - 
MACD Intraday Trend PROは、1960年代にGeraldAppelによって作成された元のMACDを応用して開発されたインジケーターです。 長年の取引を通じて、MACDのパラメーターをフィボナッチの比率で変更することにより、トレンドの動きの連続性をより適切に表現できることが観察され、価格トレンドの開始と終了をより効率的に検出できるようになりました。 価格トレンドの検出が効率的であるため、トップとボトムの相違を非常に明確に識別し、取引機会をより有効に活用することもできます。 特徴 インディケータMACD日中トレンドPROは、任意の通貨ペア、任意の時間枠、および練行足チャートで機能します。 5つのモードを選択することにより、トレンド検出速度を設定することができます。 最速 速い 正常 スロー 最も遅い 資力 6つの構成可能なアラートがあります。 MACDがシグナルラインを引き戻す MACDが信号線を横切る MACDがレベル0を超える 信号線がレベル0を超えています MACDはトレンドカラーを変更します 信号線変更トレンドカラー アラートごとに、以下を
Super Reversal Pattern Indicator Unlock the power of advanced pattern recognition with our Super Reversal Pattern Indicator. Designed for traders seeking precision and reliability, this indicator identifies one of the most effective reversal patterns in technical analysis, offering a significant edge in your trading strategy. Key Features: Non-Repainting Accuracy: Enjoy the confidence of non-repainting technology. Once a Super Reversal Pattern is detected, it remains static, providing consis
The indicator detects and displays М. Gartley's Butterfly pattern. The pattern is plotted by the extreme values of the ZigZag indicator (included in the resources, no need to install). After detecting the pattern, the indicator notifies of that by the pop-up window, a mobile notification and an email. The pattern and wave parameters are displayed on the screenshots. The default parameters are used for demonstration purposes only in order to increase the amount of detected patterns. Parameters
This indicator monitors the market for a flat state and possible breakout. The flat state is detected as a predefined number of consecutive bars during which price fluctuates inside a small range. If one of the next bars closes outside the range, breakout is signaled. The indicator shows 3 lines: blue - upper bound of flat ranges AND consecutive breakout areas; red - lower bound of flat ranges AND consecutive breakout areas; yellow - center of flat ranges (NOT including breakout areas). When a b
フィボナッチリトレースと拡張ラインツール DiNapoliポイント取引方法とゴールデンセクション取引を使用するトレーダーにとって理想的なMT4プラットフォームのフィボナッチリトレースと拡張ラインツール 主な特長: あなたはフィボナッチリトレースメントの複数のセットを直接描くことができ、重要なリターンポイント間の関係は一目瞭然です。 2.フィボナッチ拡張を描画することができます。 3.フィボナッチフォールドバックとラインの延長は、簡単な観察と数値表示のために左右に動かすことができます。 4.チャートは非常に爽やかな 5.数字キーでサイクルを切り替えることができます。 ファンクションキー: 1。 [戻るを押す、要求に応じて描画する、最大8つのグループにする 2。拡張]を描くには[押す] 3。 \を押すと、現在のサイクルの下にあるすべての拡張機能と折り畳みが削除されます 4。フォールドバックを移動して削除して展開する (1)最初のフォールドバックセットのF5行をクリックします。 一度クリックすると(黄色に変わります)、キーボードのDel
このプロダクトを購入した人は以下も購入しています
Enigmera
Ivan Stefanov
5 (3)
エニグメラ:市場の中核 https://www.enigmera.com はじめに このインディケータと取引システムは、金融市場に対する驚くべきアプローチです。ENIGMERAは、フラクタルサイクルを使用して、サポートとレジスタンスレベルを正確に計算します。本格的な蓄積局面を示し、方向性と目標を示します。 トレンド中でも調整中でも機能するシステムです。 どのように作動するのか? ENIGMERAは、支持線・抵抗線、目標線、乖離線の3つのラインで構成されています。このシステムは、過去のデータを現在と未来に外挿する典型的な市場指標とは異なり、現在の完全な画像を提供します。支持線上にある場合、それは本当の支持を意味し、抵抗線上にある場合、それは本当の抵抗を意味する。ある水準が破られた場合、それはトレンドの変化を意味する。再描画はしない。 市場は常に進化しているため、ENIGMERAはその評価ツールを適応させ、定期的に戦略を修正しています。  これにより、すべてのシナリオが徹底的に評価されることが保証されます。この市場指標の独自性は、その能力を見れば明らかです。  ENIGM
Gold Channel is a volatility-based indicator, developed with a specific timing algorithm for the XAUUSD pair, which consists of finding possible corrections in the market. This indicator shows two outer lines, an inner line (retracement line) and an arrow sign, where the theory of the channel is to help identify overbought and oversold conditions in the market. The market price will generally fall between the boundaries of the channel. If prices touch or move outside the channel it is a tra
TrendMaestro
Stefano Frisetti
5 (3)
note: this indicator is for METATRADER4, if you want the version for METATRADER5 this is the link:  https://www.mql5.com/it/market/product/108106 TRENDMAESTRO ver 2.4 TRENDMAESTRO recognizes a new TREND in the bud, he never makes mistakes. The certainty of identifying a new TREND is priceless. DESCRIPTION TRENDMAESTRO identifies a new TREND in the bud, this indicator examines the volatility, volumes and momentum to identify the moment in which there is an explosion of one or more of these data a
This indicator is based on the Gann Signal indicator and acts as a market scanner. All you need to do is fill in the selected currency pairs in the settings and that’s it. Next, the indicator itself will view all these currency pairs and time frames from M5 to D1 simultaneously. When a new signal appears, the indicator will give you an Alert and also draw the letter N where this new signal will be.
プレシジョン・インデックス・オシレーター(Pi-Osc)は、Precision Trading SystemsのRoger Medcalfによるものです。 バージョン2は、チャートにスーパーファストでロードされるように注意深く再コードされ、その他の技術的な改良も組み込まれて、エクスペリエンスを向上させています。 Pi-Oscは、市場が強制的に行かなければならない、すべての人のストップを取り除くためのポイントである、極限のエクソースト・ポイントを見つけるために設計された正確な取引タイミング信号を提供するために作成されました。 この製品は、極限のポイントがどこにあるかを知るという古代の問題を解決し、トレーダーの生活をはるかにシンプルにします。 これは、業界標準のオシレーターとは異なる強力な要素を持つ高度なコンセンサス・インジケーターです。 使用されている一部の機能には、需要指数、マネーフロー、RSI、スティリング、パターン認識、出来高分析、標準偏差の極値などがあり、異なる長さでこれらのバリエーションが多く含まれています。 初めて見ると、訓練されていない目には、他の
Bomb Bank Signal
Igor Pereira Calil
5 (1)
Bomb Bank シグナル: MetaTrader 4 の信頼度インジケーター Bomb Bank Signal は、金融市場で最も関連性の高いトレンドを特定するように設計された MetaTrader 4 の強力なインジケーターです。動きを正確に予測するツールをお探しなら、Bomb Bank が最適です。 仕組み: このインジケーターは、出来高分析、ローソク足終値、対称トレンドという 3 つの異なる方法を組み合わせて、売買の機会を検出してシグナルを送ります。 Bomb Bank は、買いの機会を特定するときは「爆弾」のようなものであり、売りシグナルを検出するときは「ドクロ」のようなものです。 ボムバンクはなぜ違うのですか? 完全な信頼性: Bomb Bank Signal は信号を削除しません。一度シグナルが発せられると、シグナルは残り続けるので、チャンスを逃すことはありません。 極めて高い精度: Bomb Bank は誤った信号を送信しません。リアルタイムで最新情報を更新し、市場の進化に合わせて調整しながら、以前のシグナルの透明性を維持します。 ライブアップデ
製品を購入する前に、以下の情報をお読みください。 Apollo Pips PLUS SP はユニークな製品です。これは、私の新しい「アポロ ピップス」インジケーターと、私のすべての取引インジケーターにアクセスできる「スーパー パック」ボーナスを手に入れたい人のためのものです。 Apollo Pips PLUS SP 製品を購入すると、実際には私の Apollo Pips インジケーターのまったく新しいバージョンを購入することになります。このバージョンのインジケーターには改良されたアルゴリズムと使いやすいパラメーターがあり、あらゆる市場およびあらゆる取引スタイルでインジケーターを使用する機会が得られます。 この製品の購入者は、私のスーパーボーナスとして、他のすべてのインジケーターにも無料でアクセスできます!私のすべての取引ツールにアクセスしたい場合は、この製品が最適です!:) しかし、これがすべてではありません!:) この製品のすべての購入者は、私の新しいインジケーターを無料で入手する資格もあります!:)新しい取引インジケーターを利用できるようになりました。私の特権のある「スーパー パッ
今、147ドル(いくつかの更新後に499ドルに増加します) - 無制限のアカウント(PCSまたはMac) RelicusRoad ユーザー マニュアル + トレーニング ビデオ + プライベート Discord グループへのアクセス + VIP ステータス 市場の新しい見方 RelicusRoad は、外国為替、先物、暗号通貨、株式、および指数の世界で最も強力な取引インジケーターであり、トレーダーに収益を維持するために必要なすべての情報とツールを提供します。初心者から上級者まで、すべてのトレーダーが成功するためのテクニカル分析と取引計画を提供します。これは、将来の市場を予測するのに十分な情報を提供する重要な取引指標です。意味をなさないチャート上のいくつかの異なる指標ではなく、完全な解決策を信じています.これは、信号、矢印 + 価格アクション情報を表示するオールインワンのインジケーターで、他に類を見ない非常に正確です。 強力な AI に基づいて、RelicusRoad は不足している情報とツールを提供して、あなたを教育し、トレーディングのプロ、成功したトレーダーにします。
Indicator : RealValueIndicator Description : RealValueIndicator is a powerful tool designed specifically for trading on the EURUSD pair. This indicator analyzes all EUR and USD pairs, calculates their real currency strength values, and displays them as a single realistic value to give you a head start on price. This indicator will tell you moves before they happen if you use it right. RealValueIndicator allows you to get a quick and accurate overview of the EURUSD currency pair tops and bottoms,
Precautions for subscribing to indicator This indicator only supports the computer version of MT4 Does not support MT5, mobile phones, tablets The indicator only shows the day's entry arrow The previous history arrow will not be displayed (Live broadcast is for demonstration) The indicator is a trading aid Is not a EA automatic trading No copy trading function The indicator only indicates the entry position No exit (target profit)  The entry stop loss point is set at 30-50 PIPS Or the front
This indicator ( dashboard) provides trend for multi currency on multi timeframe Charts. It gives entries and Stoploss on the chart itself  if the currency pair is uptrend then the cell color is displayed as Green and if its downtrend the cell displays the color as Red Alerts are generated whenever the trend changes on that particular timeframe. can customize the time frames as desired
もちろんです。以下は、提供いただいたテキストの日本語への翻訳です: MT4用の天文学指標をご紹介します:究極の天体トレーディングコンパニオン トレーディング体験を天空の高みに高める準備はできていますか?私たちの革命的なMT4用の天文学指標をご紹介します。この革新的なツールは、複雑なアルゴリズムの力を借りて、類まれなる天文学的洞察と精密な計算を提供します。 あなたの指先で宇宙の情報を: 宝のような天文学的データが明らかになる包括的なパネルをご覧ください。惑星の地理的/太陽中心座標、太陽と地球の距離、星の大きさ、伸び、星座、黄道座標および赤道座標、さらには水平座標まで、それぞれが綿密に計算され美しく表示されています。指標によって生成される垂直線は時間値に対応し、トレーディングの旅に宇宙の視点を提供します。 惑星のラインと関係: グラフを飾る惑星のラインの魔法を体験し、スケールと角度をカスタマイズできます。直感的なコントロールパネルを介して各惑星のラインの表示を簡単に切り替えることができます。指定された時刻範囲内での合会、六分会、四分会、三分会、対会、逆行の指標で天体の関係の芸術を発見してく
How to use Pair Trading Station Pair Trading Station is recommended for H1 time frame and you can use it for any currency pairs. To generate buy and sell signal, follow few steps below to apply Pair Trading Station to your MetaTrader terminal. When you load Pair Trading Station on your chart, Pair Trading station will assess available historical data in your MetaTrader platforms for each currency pair. On your chart, the amount of historical data available will be displayed for each currency pai
The indicator " ZigZag on Trend " is an assistant in determining the direction of price movement, as well as a calculator of bars and points. It consists of a trend indicator, which follows the price direction by the trend line presented in the form of a zigzag and a counter calculating the number of bars traversed in the direction of the trend and the number of points on the vertical scale. (calculations are carried out by the opening of the bar) The indicator does not redraw. For convenience,
Septermber OFFER 85% OFF next price for unlimited version will be 2500$. This is the only time you can get this institutional and professional indicator at this price for unlimited version. Don't dare to miss this. The tool I am about to introduce to you you can't compare it with other tools due to its strategy and accuracy level in predicting the next price directional movement. This tool is designed for serious traders who have decided to make a difference through trading. Be the next person t
Dear Traders this is my another tool called " Swing Master Indicator ". As the name above the indicator is designed to help you in swing trading by capturing the low and highs of the price. You may us this tool with any trading strategy and style from scalping to position trading. It is made for level of traders including newbies and advanced traders even prop-firms, hedge funds and banks to help them make sold market analysis. I create tools for serious traders who want to make a difference in
Moving pivot Average Fibonacci The  indicator compares the selected period with its counterpart from the previous period. The indicator determines the moving Fibonacci levels for the day or any time interval to assess the price movement range from the time average. The indicator helps predict the expected high or low for the day based on historical time data. The pivot line can be considered an average trend line and use it in a variety of trading strategies. If you have any question about t
Max Payneは、矢印の形でシグナルを与える反転/トレンドシグナルインジケーターです。このインジケーターは、同じバーの終値でシグナルを出します。このインジケーターは、異なる期間でチャート上に複数回ドロップして、シグナルの2倍/3倍の確認を取得できます。 このインジケーターは、あらゆる取引スタイルに合わせて高度に調整できますが、再描画やバックペイントは一切行われません。購入後には、使用したテンプレートとともにスクリーンショットに表示される完全なシステムが表示されます。 ----------------- 取引方法: トレンドフィルター(購入後に得られるペイントレンド)が方向に一致している間、同じバーでトリプル確認が得られるまで待ちます 取引を開始し、買い取引の場合は金色の矢印 (テンプレート) より下、売り取引の場合は金色の矢印 (テンプレート) より上にストップロスを設定します。終了シグナルは最初の反対側の白い点のシグナル (テンプレート) です。 ----------------- パラメーター : 信号周期:矢印周期 フィルター: 信号フィルター 距離 : ローソクからの矢印
TRANSACTION SPEEDは、大口注文がいつどこで市場に集積され、その恩恵を受けているかを示す最高品質の指標です。トレンドの変化を非常に早い段階で検知します。インジケーターであると同時にトレーディングシステムでもあります。そのコンセプトはユニークで、驚くほど収益性が高い。 FXでは、ティックボリュームはボリュームと呼ばれ、誤解を招きやすい。実際は、単位時間当たりの価格変動であり、事実上、取引速度(TRANSACTION SPEED)です。 このインジケーターは、FXにおける出来高の概念を完全に見直し、正しい方法で論理的に定義し、このロジックを適用することで、ユニークで正確なトップレベルの収益ツールになります。 スピードが上がれば、それはより大きな関心とそれに対応するエントリーとエグジットのサインです。 使い方は? このインジケーターは、市場の取引スピードを測定・比較するため、まず最初に行うべきことは以下の通りです。 比較を行う期間を選択することです。 通常、15日前が比較の出発点となります。 インジケータに日付を入力して実行する。 30分または1時間のタイムフレー
The indicator is designed to work on any trading platform. The program is based on proprietary algorithms and W.D.Ganna's mathematics, allowing you to calculate target levels of price movement based on three points with the highest degree of certainty. It is a great tool for stock trading. The indicator has three buttons: NEW - call up a triangle for calculation. DEL - delete the selected triangle. DELS - completely remove all constructions. The probability of achieving the goals is more than 80
Gann Signal is a very simple indicator at first glance, but hidden inside is many years of experience in studying W.D.Ganna methods. The indicator gives accurate BUY/SELL signals, without redrawing. The indicator is very easy to use. All you need to do is attach it to your chart and follow its recommendations. The indicator constantly analyzes the market for entry opportunities. When such an opportunity appears, the indicator gives a signal in the form of an arrow. I repeat, all signals are NOT
Connect Indicator is a tool used for connecting indicators between the MQL market and MT4. The connected indicators are made by our group and can be used for other applications, such as sending messages to the Line application or Telegram application. If you have any questions, please don't hesitate to ask us to receive support. Function and indicator buffer Buffer one is the high price of the previous candle. Buffer two is the high price of the previous candle. Usage To connect indicators to fu
Al in one level
Kundan Kumar Srivastava
5 (1)
This indicator is collection of important dynamic support and resistance giving a trader crystal clear idea , where to sell and where to buy. it completely complements trend lines, support, resistance, and sideways market and allow a trader to make sustainable profits. The thickness of lines suggests its strengths, the thicker the dynamic line, the stronger is rejection or pullback allowing a trader to make multi-fold profit, as they can clearly see them. Introducing Your Ultimate Trading Edge
This product is based on the methodologies of Gann, his follower Don E. Hall. The Indicator builds a working view grid, which is used to analyze graphics. The Pyrapoint tool, developed by Don Hall, is a grid based on the Pythagorean cube. In his calculations he uses the Gann Square 9 methodology and the relationship between Price and Time. This tool is used to predict changes in trend and overall market actions. More information about the method   HERE
A. A2SR とは何ですか ?   * 先行テクニカル指標です (塗り直しなし、ラグなし)。 -- ガイダンス : -- https://www.mql5.com/en/blogs/post/734748/page4#comment_16532516 -- そして https://www.mql5.com/en/users/yohana/blog A2SR には、サポート (需要) とレジスタンス (供給) のレベルを決定する特別な手法があります。 ネットで見かける通常の方法とは異なり、A2SR は実際の SR レベルを決定する独自のコンセプトを持っています。 元の手法はインターネットから取得されたものではなく、インターネット上で公開されたこともありません。 A2SR は、取引スタイルに応じて SR レベルを自動選択します。 時間枠を変更しても、SR レベルはその位置にとどまります。 実際のSRは、使用する時間枠から取得されるわけではないため. A2SR には、取引のための完全な手段があります 。 実際のサポート (需要) とレジスタンス (供給) の真のコンセプト。
This indicator uses support and resistance, volume and some special formula to calculate the volume to filter the candles. If the volume reaches a specific value, And at the same time, Candle breaks the support/resistance line, There would be a signal and we can enter the market. Signals appear when the current candle closes. then you can enter the trade when a new candle appears. Please don't forget to follow your money management plan. MT5 Version Support/Resistance Breakout MT5 :   https:
フルSTOインジケータ(3つのSTOインジケータのすべてのバージョンを含む:プレミアム、ゴールド、シルバー) - STABLE TRADE OPTIONは、自動バイナリーオプション取引のために設計されています。 注意深くお読みください! 重要 1つのターミナルで、異なる有効期限を持つ2つのテンプレートを作成します。18:01、18:02のテンプレートは有効期限が1~15分、22:00のテンプレートは有効期限が10~20分です。 勝率:過去5年間で71 資金管理: 預金から0.3 このバージョンのインジケータは、モスクワ時間18:01、18:02、22:00の取引にのみ設定され、有効期限は銀と金が1~15分、プレミアムバージョンは10~20分です。シグナルはローソク足の内側に表示され、すぐに取引を開始します。 インジケータは完全に設定されているので、自分で何かを変更する必要はありません。インストールして取引してください! 実際の口座でstoの全バージョンをチェックし、結果を確認するのに2年以上かかりました。長年のテストの結果、最適なパラメータが選択さ
️️ Attention:   There is a new update at 22-08-2024. What's new in this update? -* New strategy integration. -* The trade is with the price trend only. -* The success rate of trades has increased by a very large percentage.      No more losses with this indicator, test it for years ago and see if there is losses in one day results. but before testing it please see the explaining video down here.    FxBears Powers is working on all forex pairs, metals, commodities, futures, indices, energies,
Contact us to receive a comprehensive user guide after purchasing. William Delbert Gann, commonly known as W.D. Gann, was an exceptional market analyst renowned for his unique trading style in the early 20th century.  His trading techniques were based on a blend of mathematics, geometry, astrology, and ancient mathematics. Gann believed that stock market movements followed specific patterns and cycles, rather than being random. His methodologies, celebrated for their accuracy and relevance, con
作者のその他のプロダクト
タッチ・スパイクは、バーのリトレースメントとタッチに合わせて買いと売りのシグナルを与えるブーム・アンド・クラッシュ・インデックス取引指標です。 この戦略は、好景気指数でのみ買い取引を行い、暴落指数でのみ売り取引を行い、好景気指数で有効な取引を行うことです。 インジケーターが上昇トレンド状態にあり、緑色になっている必要があります。赤いブームローソク足が緑のラインに接触するまで待ち、タッチが発生した瞬間に買いを置きます。クラッシュインデックスの売りトレードにも同じことが当てはまりますが、色が逆になります。 … TP と SL は次のローソク足の終値に従って設定されるため、TP と SL はシグナルタッチローソク足の後の次のローソク足の終値になります。 推奨事項 : 毎日の目標を持ち、ルールに従う パラメータ:  感度 : インジケータライン信号感度 アラート/電子メールアラート/通知。
Binary Sniper は、バイナリー オプション取引に売買シグナルを与える mt4 インジケーターです。このインジケーターには異なるアプローチがあります。 バイナリー オプション取引に対して、このインジケーターはシグナルを再描画したり遅延したりしません。 エントリールール: 1. CALL (BUY) 、赤いローソク足が赤だった後に緑のバイナリスナイパーバーカラーで閉じるとき。(最初のカラー反転) 2. PUT (SELL) 、緑のローソク足が緑だった後、赤のバイナリ スナイパー バーの色で閉じるとき (最初のカラー反転)。 このインジケーターは価格アクション/出来高およびローソク足パターンに作用するため、設定は制限されています。
The Supreme HmaSignal indicator is an indicator for trend trading , its main character is the hull moving average colored line , and secondary is buy and sell arrows , arrows are fair but the main focus is on the colored hma , this indicator does not repaint or back paint or delay its signals. if you like this indicator please check my Supreme Trendhisto:   here   , and my Supreme Diamond indicator :   here Parameters:  HMA Period HMA Smoothing HMA Price (close/open) Signal Period (Arrows)
FREE
TMA Stochastic is an indicator based on stochastic oscillator and tma bands indicator , this indicator is based on a reversal strategy . Recommended time frame : 15 and above  Recommended settings : lower values for scalping , higher values for swing trading  WORKS ONLY ON EURUSD , GET THE FULL VERSION :  https://www.mql5.com/en/market/product/108378 ======================================================================= Parameters :  tma history : how many bars back to show tma bands on stochas
FREE
Rsi indicator and Stochastic Combined into one indicator , the Supreme StochRsi doesnt repaint / Back-paint / delay. can be used as overbought oversold strategy , or trend following on 50 level cross. if you like this indicator please check my Supreme Trendhisto: here , and my Supreme Diamond indicator : here ========================================================================= Parameters : Stochastic K and D value , Stochastic period Rsi Period Rsi price ====================================
FREE
Ambitious Dragon EA
Abdulkarim Karazon
5 (1)
Ambitious Dragon EA は、eurusd 1M タイムフレームを取引するために特別に設計されたエキスパートアドバイザーです。その背後にあるロジックは、混合戦略を使用して注文を開くことに基づいています。これは、EA が計算された勝率と損失率とともにヘッジ ロジックを使用することを意味します。したがって、EA は混合戦略であるため、EA は取引を開始するかスキップするかを決定します。つまり、アグレッシブ セット ファイルを使用すると巨大な DD が得られる可能性があり、セーフ モード セットを使用するとより優れた DD が得られます。 最低入金額 : 3000$ ================================= 設定 : ミックストレード:オン/オフ... 売り取引後の買い取引と買い取引後の売り取引のみを開始します (互いの後に売り取引や買い取引を行うことはできません) LOT1: 固定ロットサイズ オートロット:オン/オフ オートリスク : 取引ごとの最大ロット増加額 ポンのTP SLインポイント
Supreme Direction is an indicator based on market volatility , the indicator draws a a two lined channel with 2 colors above and below price , this indicator does not repaint or back-paint and signal is not delayed. how to use : long above purple line , short below golden line. Parameters : channel period ========================================================
FREE
Supreme Stoploss is an indicator for metatrader 4 that is based on the ATR indicator , it gives stoploss/takeprofit as lines drawn above and below the price , this indicator does not repaint/back paint and is not delayed. can be used to determine the stop loss or take profit of a trade using ATR value multiplied by the number set by user. ====================================================================================================== Parameters : ATR SL period : ATR period identity : leave
FREE
Bands Sniper
Abdulkarim Karazon
5 (1)
現在の価格は 10 部のみで、それ以降の価格は 90 ドルとなります 矢印付きのエンベロープとtmaに基づいたバンドスナイパーインジケーターは、動的なサポートとレジスタンスを示し、売買の矢印としてエントリーシグナルも与えるため、多目的のインジケーターです。 デフォルト設定は 1H の時間枠に基づいています。完全なガイドについては購入後にお問い合わせください。 エントリールール: 買い : 1.ローソク足は両バンドの下で終了          2.ローソク足 2 つの上矢印 (金色の矢印とオレンジ色の矢印) を使用して 2 つのバンド内で戻ります。 売り : 1.両方のバンドの上でローソク足で終了          2.ローソク足 2 つの下矢印 (金色の矢印とオレンジ色の矢印) を使用して 2 つのバンド内で閉じます。 TP 1 : ミドルバンドライン TP 2 : 逆バンド SL カップルが矢印の下でピップス 推奨される時間枠は : 15 分以上
SuperOsma Arrowは、買いシグナルと売りシグナルを与えるスーパートレンドOSMAベースのインジケーターです。インジケーターは再描画されず、シグナル統計を表示するダッシュボードが付属しています。 推奨期間:15 歳以上 Buy : バーが開いているときに購入矢印が表示され、tp と sl をチャートに描かれたとおりに設定します Sell : バーが開いているときに売り矢印が表示され、tp と sl をチャートに描かれたとおりに設定します ===============================     ダッシュボードには履歴信号情報が表示されます。     1.勝率%     2.勝者は何人ですか     3.敗者は何人ですか     4.連続当選者数     5.連敗者は何人か     6.pips単位の利益 ============================     パラメーター :     1.スーパートレンド1期     2.スーパートレンド1マルチプライヤー     3.スーパートレンド
macd との 3ma クロスに基づくバイナリー取引用のインジケーターで、バーが開いているときに買いシグナルと売りシグナルを与え、再ペイントやバックペイントは行いません。 このインジケーターはマーチンゲール取引用に作成されているため、高い勝率には焦点を当てておらず、連続して最も低い損失シグナル数に焦点を当てています。 戦略 : 最低入金額は 1000 単位で、1 単位で取引を開始します (取引サイズは資本 1000 ごとに 1 単位です) 現在のシグナルが失われた場合、次のシグナルでトレードサイズを2倍にします。連続で最大7つの損失シグナルを持つインジケーター設定のみを採用します。 過去 10000 キャンドル (x 個のキャンドル以上の履歴取引を表示するために設定で入力できる数値) -推奨タイマーフレーム:任意 -有効期限 : 運用された時間枠と同じ パラメーター : 1.高速馬期 2.ファストマタイプ 3.スローマ期 4..スローマタイプ 5.トレンドマ期間 6.トレンドマタイプ 7.バー数 (シグナルとバックテスト結果を表示するために使用する履歴
3つの移動平均クロス戦略に基づいて、統計アローはチャート上に描かれたtpとslのポイントで買いと売りのシグナルを与えます。勝率と接近した取引の数、勝った取引の数、勝った取引の数を示すバックテストダッシュボードが付属しています。損失が発生し、最終的に利益が得られた場合、インジケーターは BAR OPEN の tp および sl の横に矢印を印刷し、プレアラートを表示します。 ================================================================================================== パラメータは設定のスクリーンショットに表示され、説明されています。
Ambitious Donchian EA can be downloaded from comment section but it need the ambitious donchian indicator to work. Ambitious Donchian is a Donchian Channel and XO histogram based indicator that gives buy and sell signals in form of up and down arrows with tp and sl as objects on chart. features : 1. Tp and Sl for each signal , the tp and sl can be selected as based on points or ATR value from indicator settings. 2.backtesting dashboard : the dashboard shows the following according to your i
Supreme Arrow は、RSI およびデマーカー インジケーター戦略に基づいた mt4 用のアロー インジケーターです。 この戦略はトレンド市場に適していますが、特にスキャルピングに使用される場合はレンジ市場でも機能します。 推奨される期間 : 任意 推奨アドオン: 200 SMA Supreme Arrow インジケーターは再ペイントやバックペイントを行わず、信号は遅延しません。 -------------------------------------------------------------------------------------------------------------------------
TV atr チャネル指標に基づいた Supreme Channel 指標は、トレーダーに現在のトレンドの反転の可能性に関するヒントを与える動的なサポートとレジスタンスバンドです。 推奨時間枠:15M以上 推奨設定: デフォルトですが、トレーダーは必要に応じて変更することを選択できます。 ========================================================================== パラメーター : 1. チャンネルの長さ 2.帯域幅(2つのチャネルライン間の距離) 3.乗数(ATR値乗数) 4. チャンネルを表示 (True/False) =====================================================================
Supreme Diamond
Abdulkarim Karazon
5 (1)
Supreme Diamond は、反転およびトレンド取引戦略に基づいたマルチタイムフレーム インジケーターです。インジケーターは再ペイントやバックペイントを行わず、シグナルも遅延せず、アラート付きで売買シグナルを提供します。 インジケーターには、選択できる 2 つの信号モードがあります (ダイヤモンドとして最適なエントリを使用) input 。これが true に設定されている場合、インジケーターは通常モードの信号をフィルターし、可能な限り最良のものをダイヤモンド信号として提供します。ダイヤモンド モードではダイヤモンド信号を微調整することはできません。 。 通常モードは、(ベストエントリーをダイヤモンドとして使用する)入力が false に設定されている場合です。これにより、バンド設定が有効になり、スクリーンショットに示すように、ボリンジャーバンド戦略として通常モードが有効になります。 最高のパフォーマンスが得られるため、ダイヤモンド モードの使用を強くお勧めします。 Supreme Diamond の取引方法: インジケーターからシグナルを受け取ったら取引を開始し、前の安値/
Supreme EmaCross は 2 つの指数移動平均クロスに基づくインジケーターです。EMA クロスに基づいて買いと売りの矢印を生成し、シグナルの出現時にアラートを発します。インジケーターは再描画やバックペイントを行わず、矢印は遅延せず、インジケーターは高速です。トレーダーがインジケーター設定に行かずに ema の値を変更できる ema 期間変更パネル。パネルは移動可能です。 ================================================= ==== パラメーター : 速い期間 : 速い絵馬期間 遅い期間 : 遅い絵馬期間 通知とアラートの設定 絵馬ラインのオン/オフ 絵馬の線の色 絵馬の十字矢印のオン/オフ 絵馬の十字の矢印の色 ================================================= =========
Supreme MaColor is an indicator based on moving average indicator , it gives up and down trend colors and it has different moving averages types and has multi time frame function , this indicator does not repaint/back-paint/delay signal. =================================================================================== Parameters : Timeframe (what time frame to use to draw Supreme Ma) Ma Period  Ma Type Ma Price (close/open...etc) Average Shift (Ma shift) Multi Time frame on/off ===============
Supreme MaChannel is an indicator based on moving averages , the indicator gives dynamic support and resistance in bands format. Recommended for reversal traders , add it to your reversal strategy. Parameters :  Supreme MA Period : ma periods Supreme MA Price : close/open/high/low..etc Supreme MA Type : Simple/Exponential/Smoothed/Linear Weighted Deviation : bands deviation the distance between the two band lines
Supreme Entry is an arrow signal based indicator that give buy and sell signals , the indicator gives buy/sell signals with alert on candle open/close (depends what you set it to be from inputs) . this indicator does not repaint/back-paint and signal is not delayed. Strategy : Open buy same moment buy arrow appear and open sell same moment a sell arrow appear , close on well or on opposite signal . Recommended Time frame : 15 and above this arrow is good as ? : addon to your existing strategy ,
STOCH ARROW is a long short arrow signal type indicator that is based on standard stochastic oscillator this indicator has 3 methods of giving long and short signal that are as follow : 1.whenever stochastic lines cross 2.when a cross happens in overbought and oversold zones (short arrow on overbought zone cross , long arrow on oversold zone cross) 3.when stochastic lines leave overbought and oversold zones (short arrow on leave from overbought zone  , long arrow leave on oversold zone) this ind
Supreme Trend is a reversal/continuation type Oscillator type indicator that is based on Moving average and stochastic indicators this indicator can be used in two methods : Reversal Method : short when golden arrow appear after arrows were above upper level (e.g 70) Reversal Method : long when Purple arrow appear after arrows were below lower level (e.g 30) Trend Method : long when arrows cross above 50 level line , short when arrows cross below 50 level line. use higher ma and stochastic peri
TMA Stochastic は、確率的オシレーターと TMA バンド指標に基づいた指標であり、この指標は反転戦略に基づいています。 推奨期間 : 15 歳以上 推奨設定: スキャルピングには低い値、スイングトレードには高い値 ================================================= ===================== パラメーター : tma 履歴: ストキャスティクスで tma バンドを表示するために遡るバー数 K周期(確率的) D期間(確率的) S期間(確率的) TMA期間 TMAシフト 極端な tma 偏差 : 遠帯域の偏差 tma 偏差 : 内側バンドの偏差 --------------------------------------------------------------
SURE REVERSAL is a histogram overbought/oversold type indicator that gives key reversal points that indicates a bull or bear market movment this indicator is fusion between moving average and the rsi indicator ,this indicator is non repainter , and is not delayed . Parameters : Ma period  Ma Method Ma Price Sure Period (Rsi) Sure Price (Rsi) ==============
FireArrow is an arrow signal based indicator that give buy and sell signals with tp and sl levels , the indicator gives buy/sell signals with alert on candle close along side tp and sl levels on chart for each signal this indicator does not repaint/back-paint and signal is not delayed. Strategy : Open buy same moment buy arrow appear and open sell same moment a sell arrow appear , set tp as drawn on chart along side sl. Recommended Time frame : 15 and above this arrow is good as ? : add
マーチンゲールアローは、マーチンゲールバイナリーオプション取引用に設計された矢印タイプのMT4インジケーターで、この矢印はバーオープン/バー内に印刷され、アラートを与えます。 使用方法: 矢印が表示された瞬間に取引を開始し、取引が勝った場合は次のシグナルを待って同じロットを取引します。次のシグナルでトレードがダブルロットを失い、シグナルが勝つまでそれを続けた場合、リセットして最初のトレードロットでトレードします。 推奨される期間 : 任意 最低入金額: 200 ユニット。 このインジケーターはライブでは再ペイント/バックペイントを行いません。 -------------------------------------------------- ------------- パラメーター : インジケーター期間: これを変更すると、異なるシグナルが表示されます。 インジケーターの価格/種類 買われすぎ/売られすぎレベル アラート入力 矢印スタイル ========================================
StalkeR Arrow
Abdulkarim Karazon
5 (3)
StalkeR Arrow は、バーオープン/バー内で売買シグナルを与える矢印インジケーターです。このインジケーターは価格行動パターンとフラクタルに基づいています。 このインジケーターは、各買いシグナルと売りシグナルの tp と sl を与えます。tp と sl は各シグナルの上下の線の形式であり、新しいシグナルが形成されるまで延長されます。 このインジケーターには、履歴シグナルの勝敗統計を提供するバックテスト パネル/ダッシュボードがありますが、このインジケーターは再ペイントやバックペイントを行いません。 パラメーター : StalkeR 周期 : 矢印周期、数値が大きいほど信号が少なくなります スプレッド: ポイント単位のスプレッド値を使用して、パネル上の勝敗を計算します。 ストップロス ATR x : atr 乗算における SL 値 Takeprofit ATR x : atr乗算のTP値 ATR 期間 : に基づいて tp と sl を計算するために使用する atr 期間 TP/SL ラインの色と幅 矢印の色と幅 パネル/ダ
Renko Starは、練行チャートを取引するように設計されたMT4矢印タイプのインジケーターです。このインジケーターには、勝率や獲得ポイントなどの役立つ情報をトレーダーに伝えるバックテストダッシュボードがあり、ATR x乗算のtpとslも提供されます。バーオープンまたはイントラバーのシグナルであり、シグナルが与えられた正確な価格を示す黄色のマークが付いています。このインジケーターの使用方法は、インジケーターが示す矢印に従って買いまたは売りを開始し、tpを設定することです。インジケーターによって与えられる sl や sl も、インジケーターの設定をいじってみると結果が良くなったり最悪になったりするため、信頼できるダッシュボードで良い結果が得られるまでインジケーター設定を変更する必要があります。 このインジケーターは再ペイントまたはバックペイントを行いません パラメーター : atr tp : atrに基づくtp値 atr sl : atrに基づくsl値 atr期間 星期 スターフィルター History : バックテストする履歴の量 スプレッド : 計算にスプレッドを使用した
スーパーエントリーはオールインワンの矢印タイプのインジケーターで、ロングシグナルとショートシグナルだけでサイドtpとslレベルを与え、ATR値に基づいて変更および微調整することができます。このインジケーターは、勝率やその他の統計を表示するバックテストパネルを提供します。どの程度の精度が期待できるかを明確に把握できます。 このインジケーターは再ペイントまたはバックペイントを行わず、信号は遅延なくバーオープンで表示されます。 パラメーター : 設定: インジケーター tp および sl 値、履歴および信号周期 通知 : アラート/電子メール/プッシュ 表示設定: 矢印の色/tp と sl の線の色と幅/矢印の種類 =============================================
ゴールドミステリーEAは、買い売りの機会を決定するために、そのコードに組み込まれているいくつかのカスタム指標を使用するトレンド取引ベースのボットです、このEAは金でうまく機能し、金5mの時間枠でテストされていますが、他のペアで使用することができますが、さらに戻ってテストする必要があります。 eaは2つの方法を使用してシグナルを閉じます。 1. ATR値乗算のTP / SLは、現在のATR値に基づいてTPとSLを設定し、xで乗算または除算します(xはユーザー入力です)。 2.反対の有効なシグナルで閉じる なぜそれが良い選択なのですか? 合併症がなく、非常に明確で理解しやすい入力(50000行の入力なし) マーチンゲールはオプションであり、EAはマーチンゲールの有無にかかわらず利益を上げます カスタムインジケーターは必要なく、すでにコードに組み込まれています ============================ 推奨レバレッジ/ペア/資本:最小レバレッジは1:50、金M5時間枠で最適、最小資本は100 $です。 ================
フィルタ:
レビューなし
レビューに返信