PTS Divergence Sell Finder MT5
- インディケータ
- PrecisionTradingSystems
- バージョン: 2.0
- アクティベーション: 10
PTS - Precision Trading Systemsによるダイバージェンスバイファインダー
Precision Divergence Finderは、市場の底を非常に正確に見つけることを目的としており、頻繁に成功しています。
テクニカル分析において、底を選ぶ技術は通常、トップを選ぶよりもはるかに簡単です。このアイテムは、まさにこのタスクのために設計されました。ブルシューダイバージェンスが識別された後、買い物をする前にトレンドが上向きに転換するのを待つのが賢明です。10本または20本のバーの高値を入力するか、移動平均15-30を上昇中に使用してトレンドの変化を特定できます。
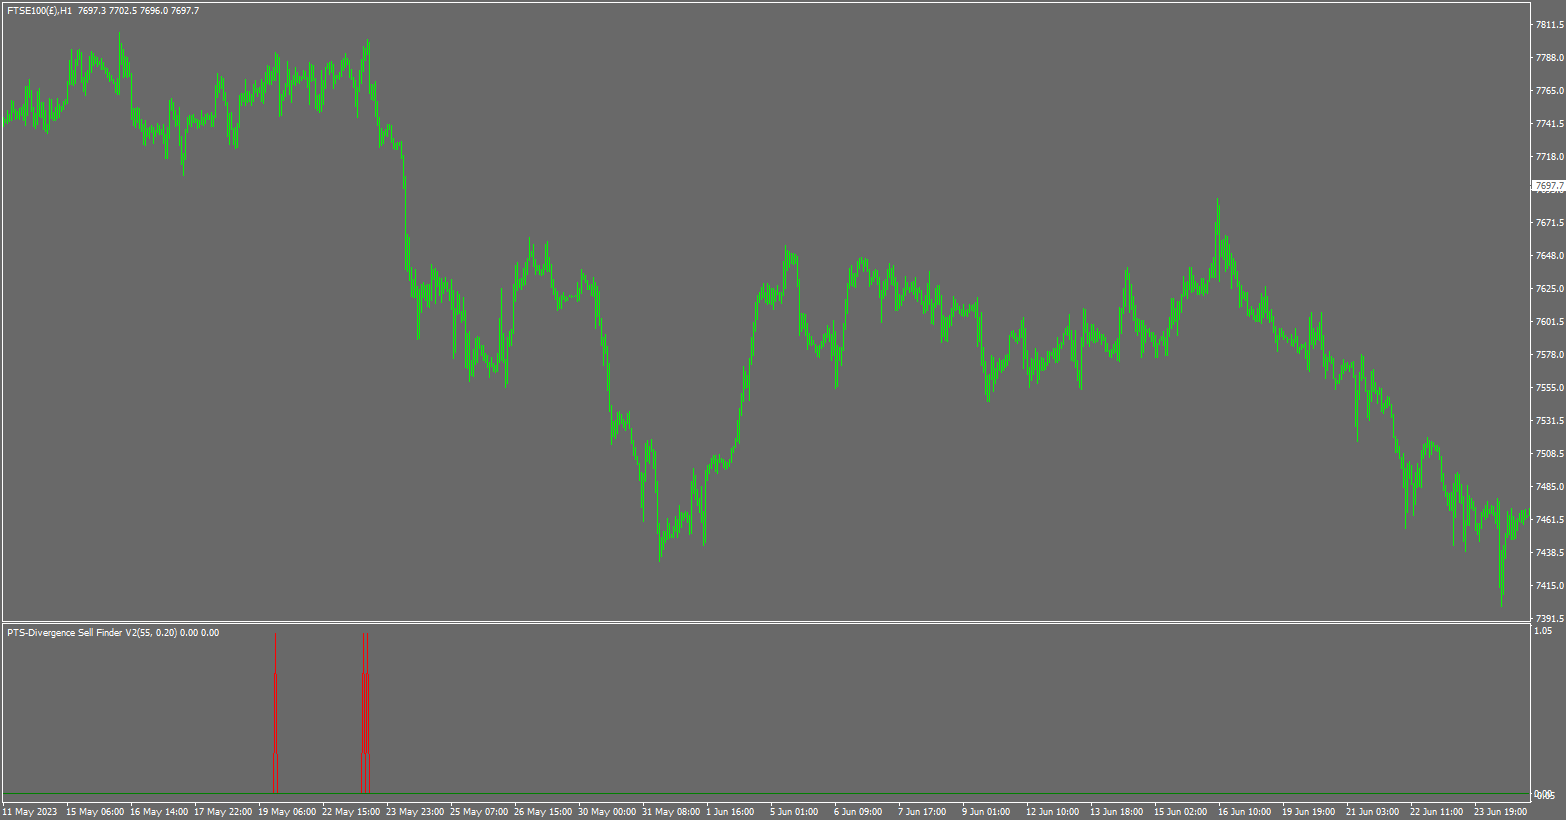
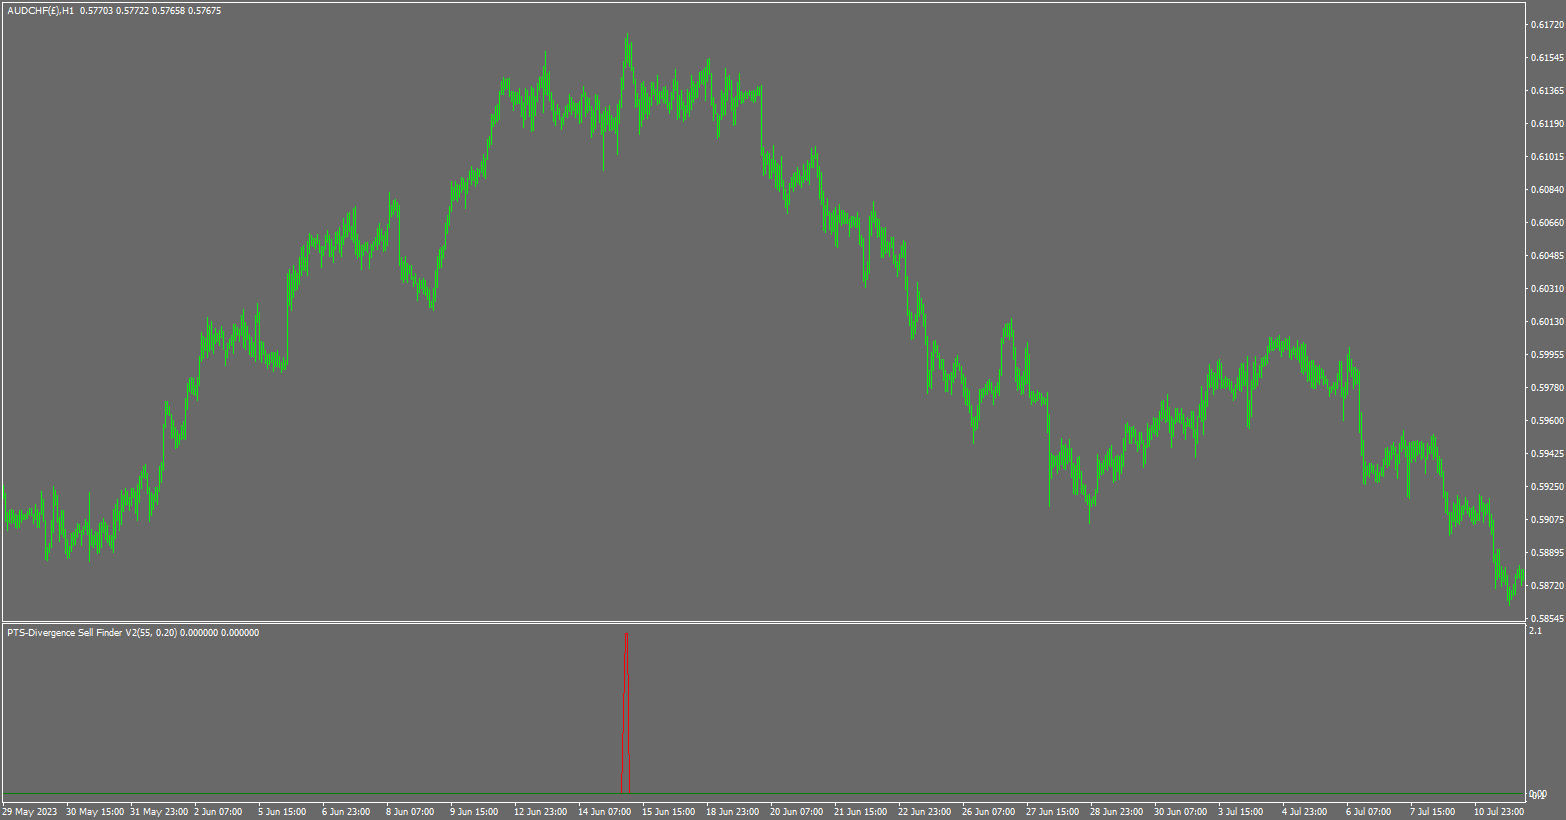
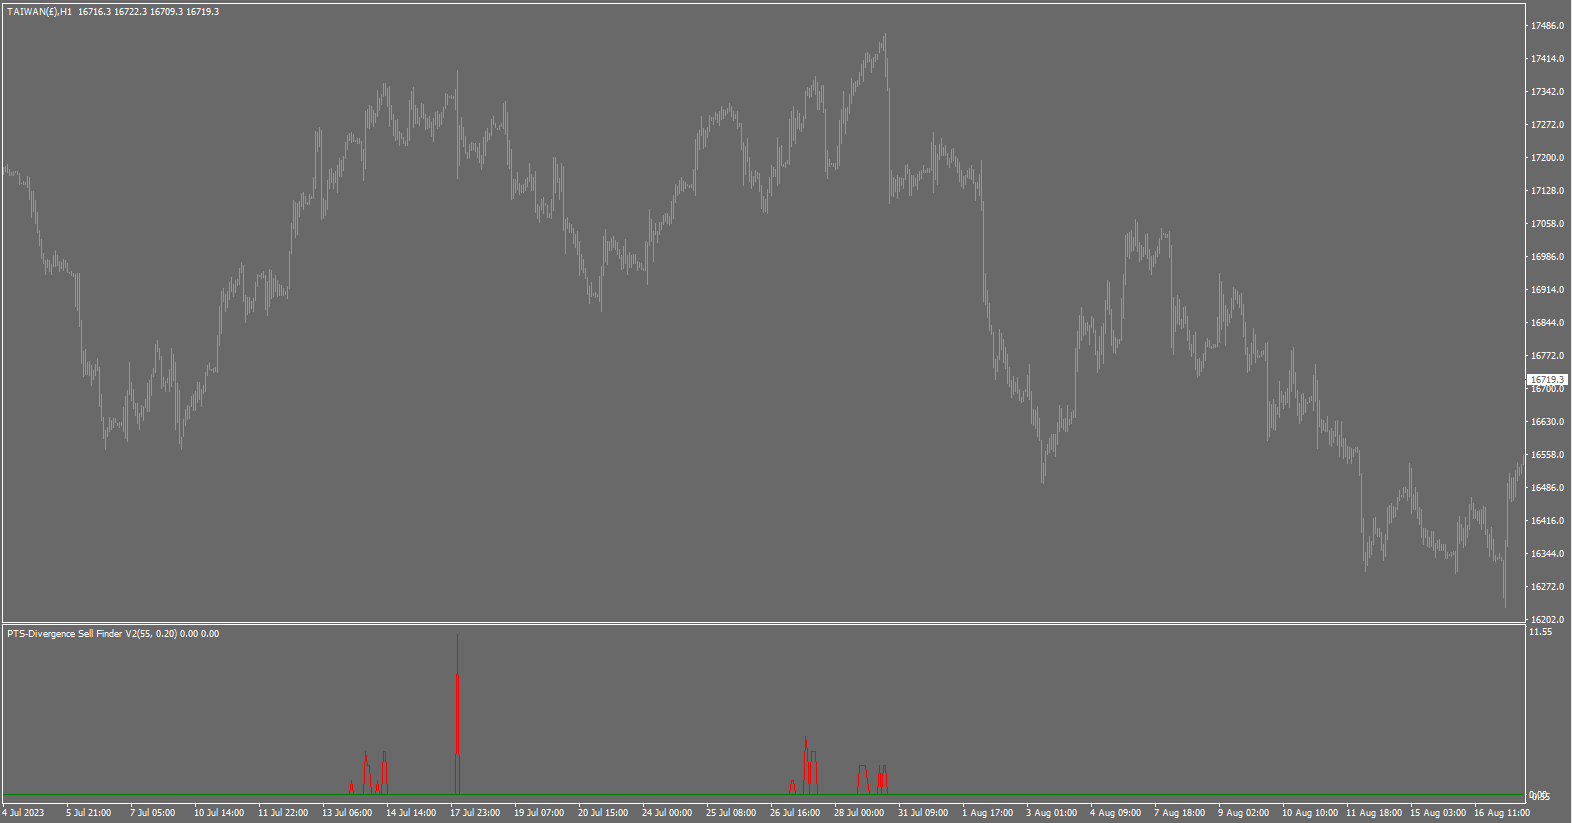
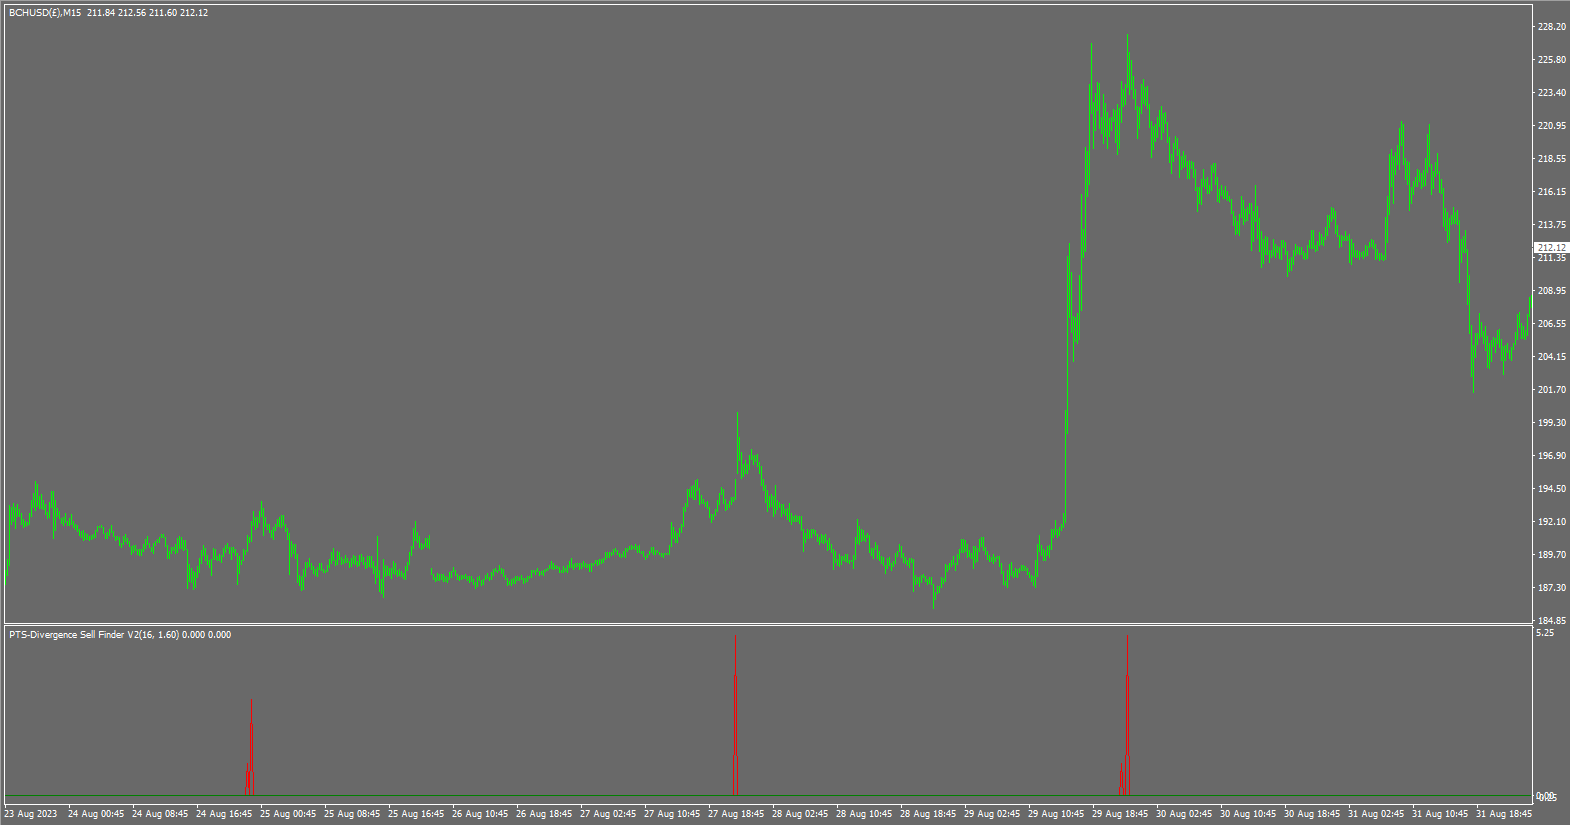
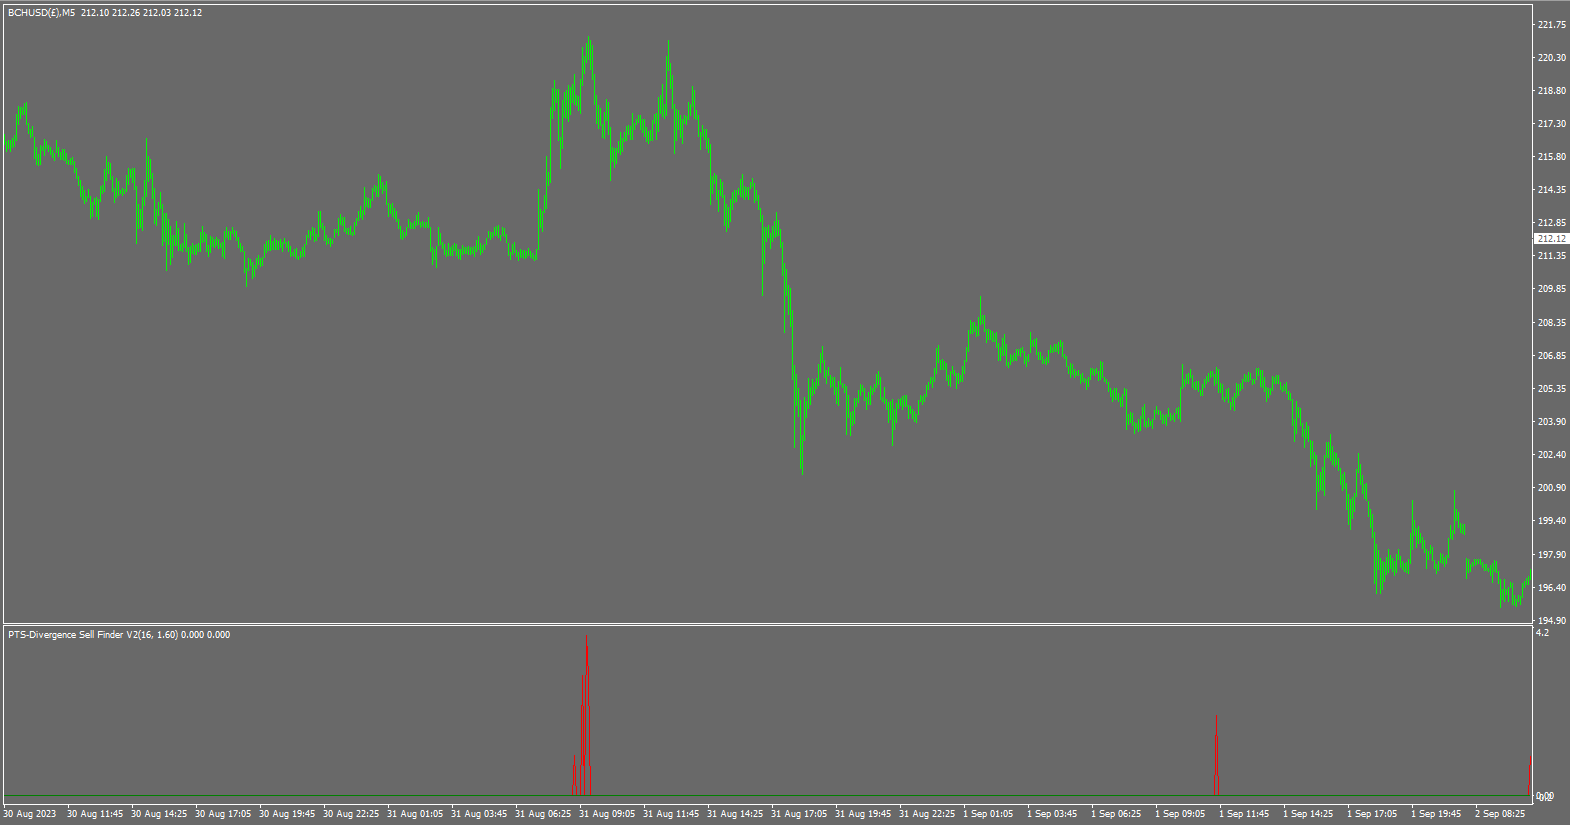
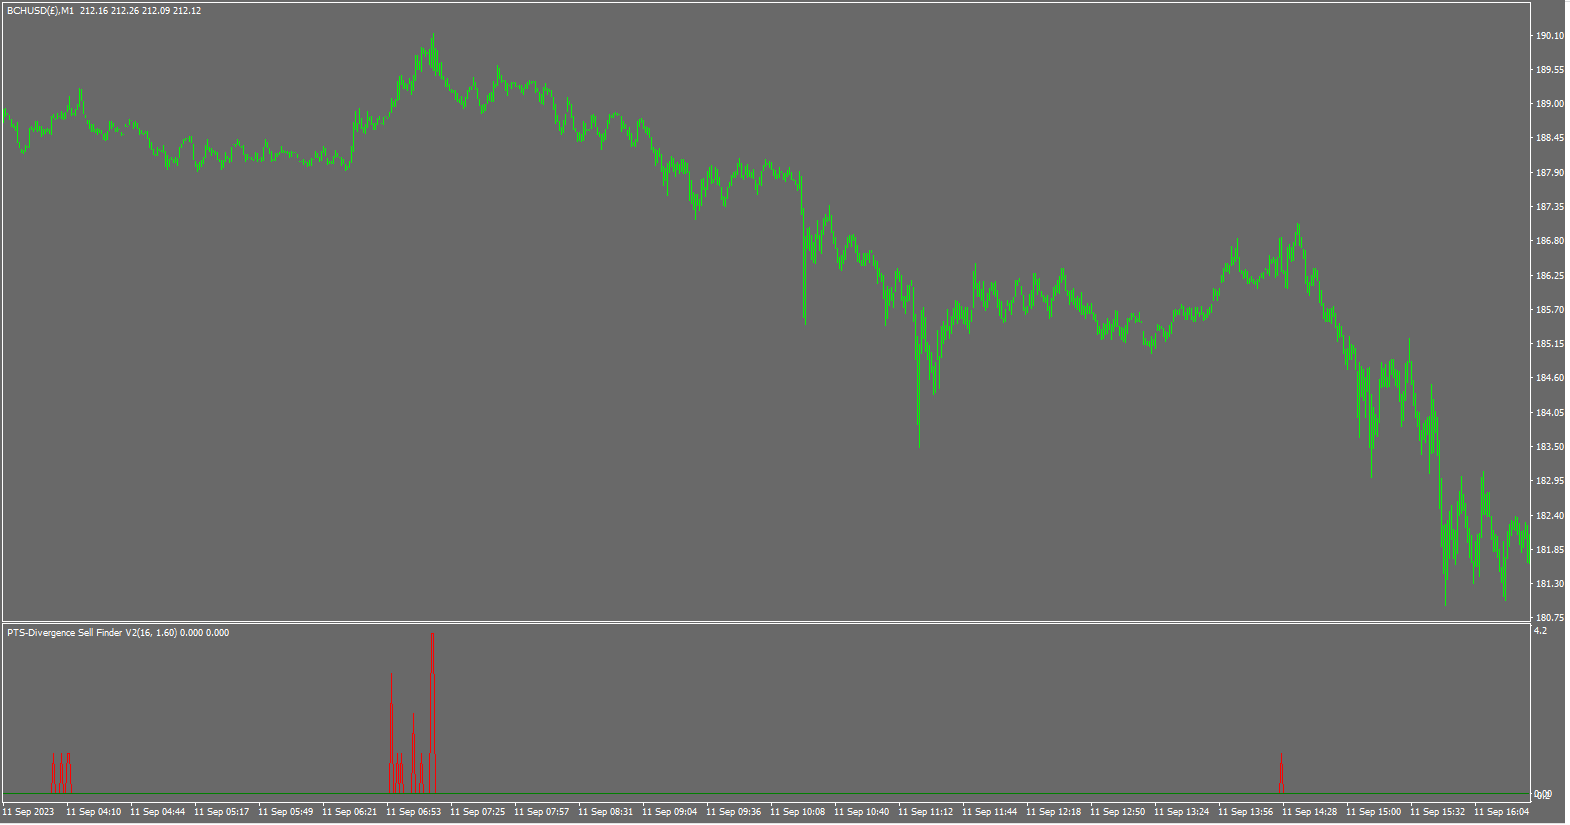
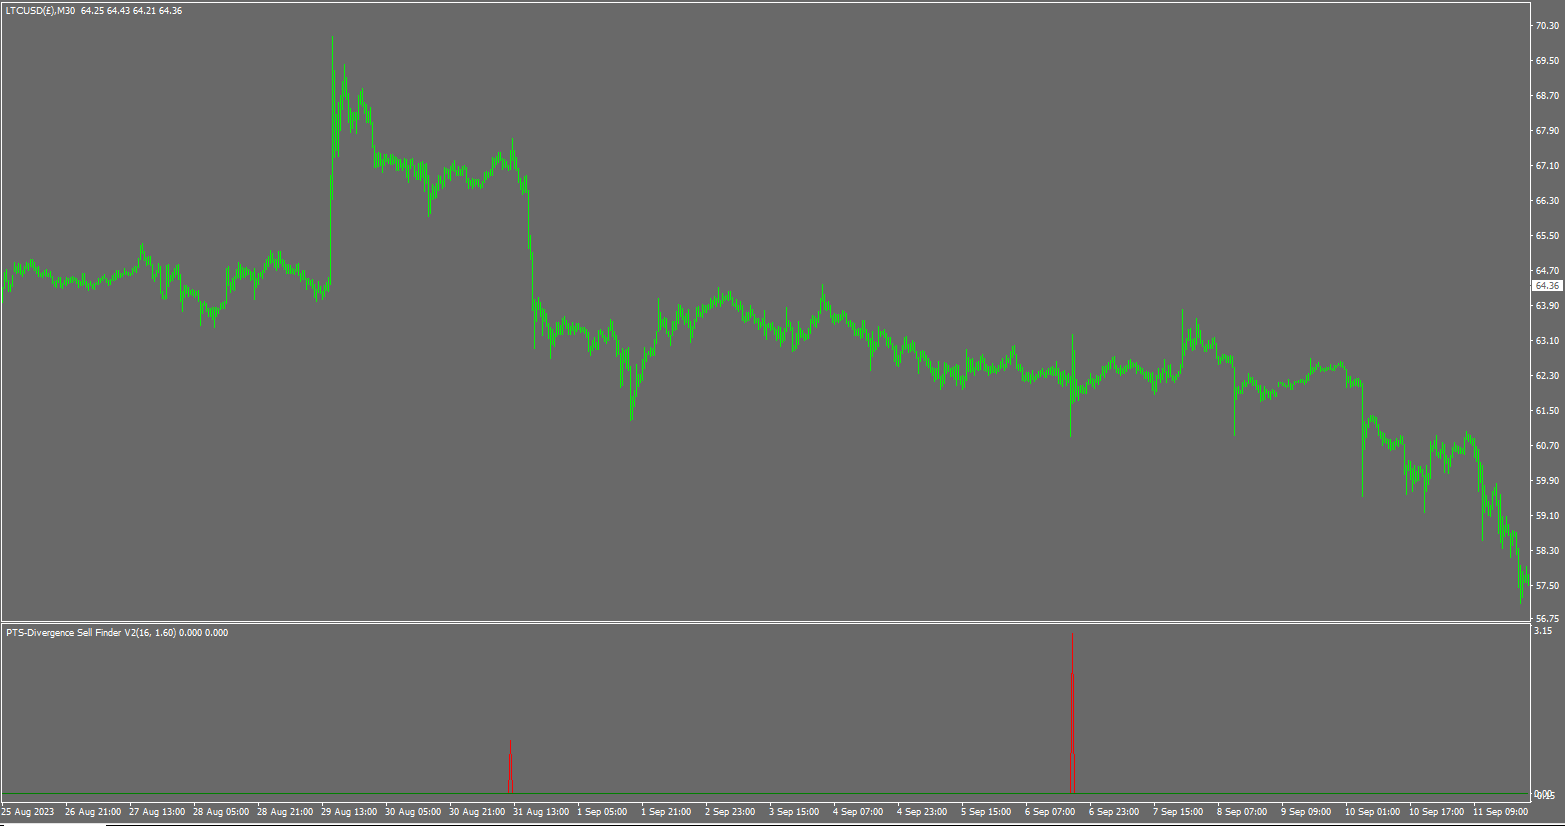
この複雑なアルゴリズムは、リアルタイムのバーバーベースでアクティブなデマンドインデックスのダイバージェンスの数を検出し、カウントします。
モデルは、市場価格が新しい安値を付けており、デマンドインデックスが新しい安値を付けていないときに、ダイバージェンスが発生していると観察します。
このインジケーターは、2つの設定を使用します。
1. デマンドインデックス(DI)の長さは、インジケーターに探すものを提供し、選択した長さのDIの任意のダイバージェンスを見つけます。
2. ディファレンスは、[DI値現在]と[DI値200本前まで]のダイバージェンスの量であり、さまざまなルックバック期間から見つかる各ダイバージェンスに対して、インジケーターウィンドウで[1]の出力を生成します。
最大で200本のバーまで20期間が検査され、したがって、表示される最大の出力値は20です。
推奨設定
- 15から100までのデマンドインデックスの長さが機能しますが、最適なのは20から60の長さです。
- ダイバージェンスの違いは0.1から20です(通常、0.75から5が最適ですが、データフィードのボリュームに応じて最適な値ははるかに大きくなることがあります)。
- チックボリュームを使用している場合、これらの設定が推奨されます。ただし、トレードボリュームがある場合は、10倍の大きな違いの値を使用します。
DI Length 20 = 0.95 - 5の違い
DI Length 30 = 0.85 - 4の違い
DI Length 40 = 0.75 - 4の違い
DI Length 50 = 0.25 – 3.5の違い
DI Length 60 = 0.2 - 3の違い
DI Length 70 = 0.15 - 2.5の違い
DI Length 80 = 0.1 - 2の違い
DI Length 90 = 0.1 - 1.8の違い
DI Length 100 = 0.1 – 1.7の違い
ほとんどのMT4ユーザーはティックボリュームを受け取ることになるでしょうので、提案された値の表は良い出発点です。
プッシュ通知は使用していないことに注意してください。ご質問がある場合は、数週間後にメッセージを受信しないため、MT4ではなく、ウェブサイトを介してメールでご連絡いただければ幸いです。