Market Noise
- インディケータ
- Ivan Butko
- バージョン: 1.2
- アップデート済み: 30 5月 2024
- アクティベーション: 10
Market Noise
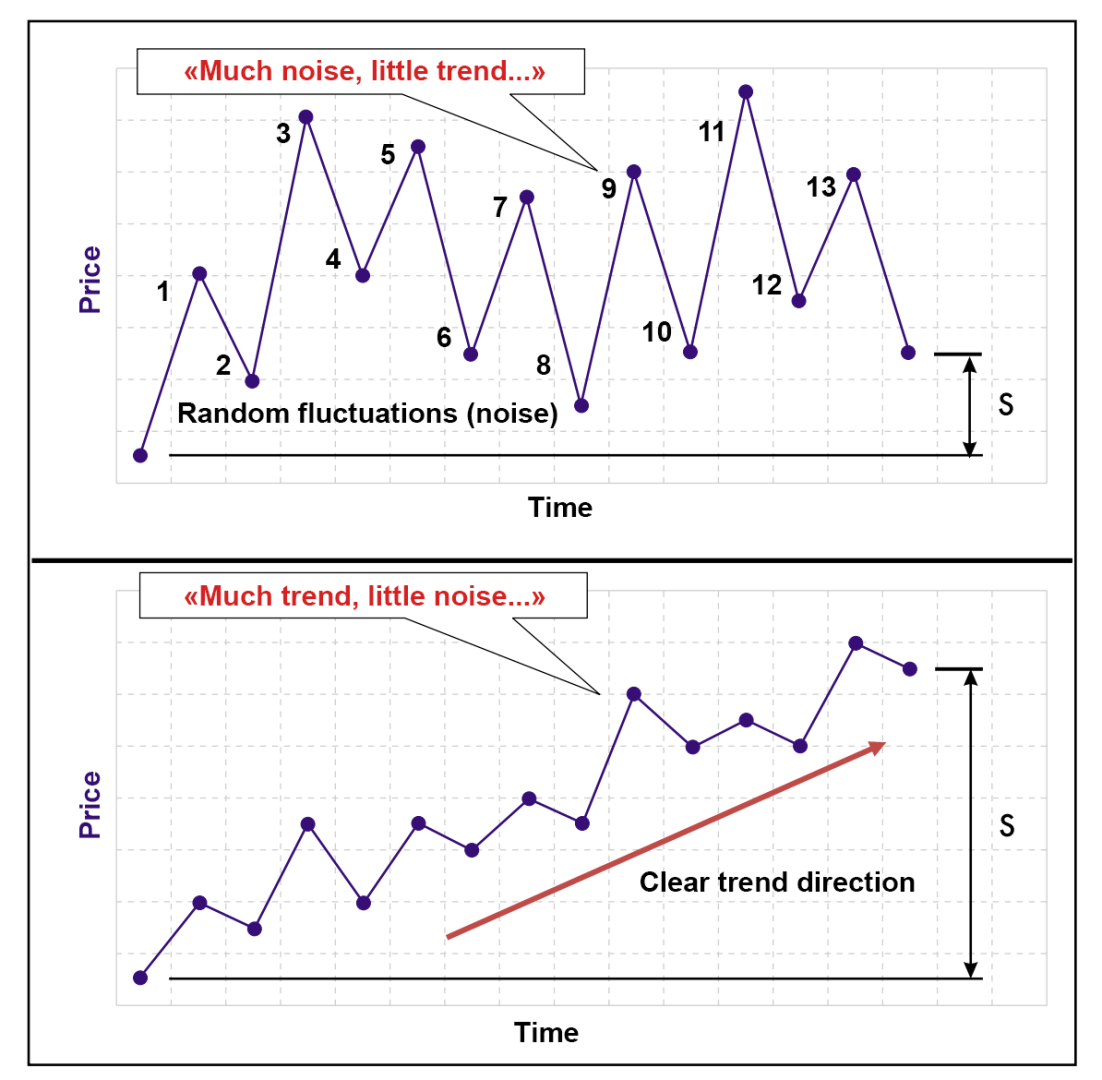
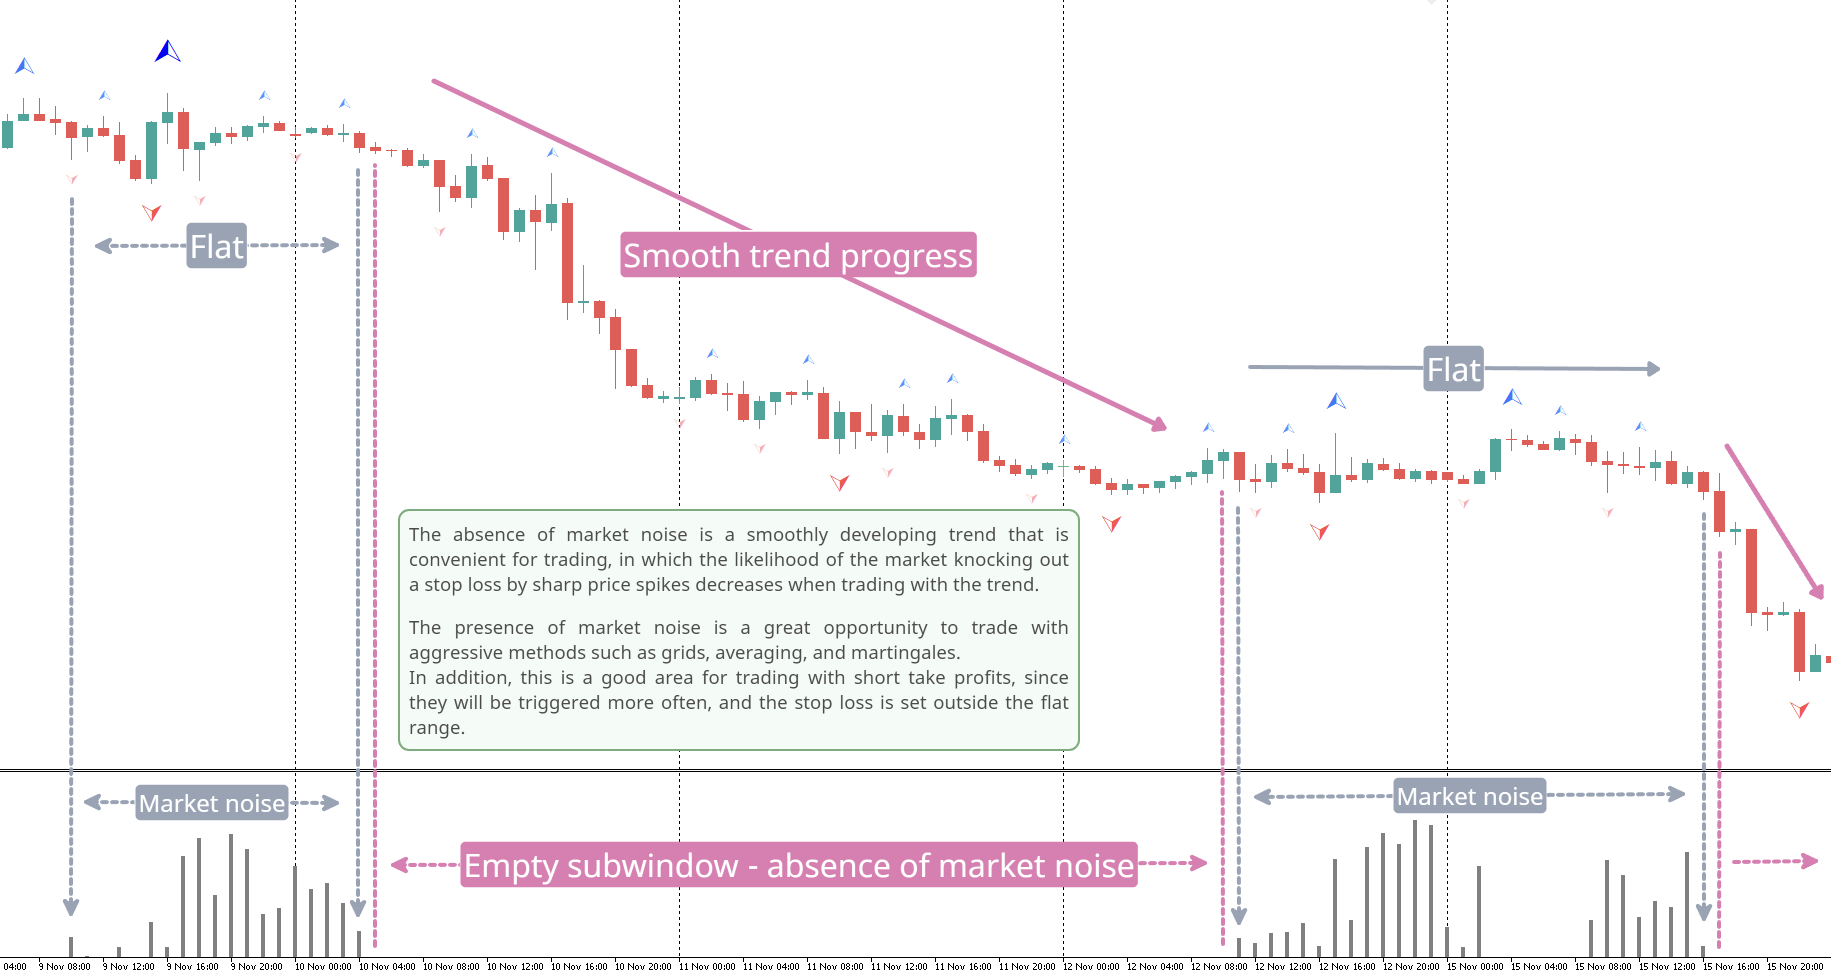
マーケットノイズは、価格チャート上の市場の局面を決定する指標であり、また、蓄積または分配局面が発生したときに、明確で滑らかなトレンドの動きとノイズの多い平坦な動きを区別します。
各フェーズは、独自のタイプの取引に適しています。トレンド追跡システムにはトレンド、積極的なシステムにはフラットです。 市場のノイズが始まったら、取引を終了することを決定できます。 同様に、またその逆も同様で、騒音が止んだらすぐに、積極的な取引システムをオフにする必要があります。 一方からもう一方に切り替えて、両方のタイプの取引戦略を取引することができます。 したがって、この指標は取引決定の分野で優れたアシスタントの役割を果たします。 すべての価格変動は、選択した期間の一般的な価格変動と、この期間内の価格変動の形でのノイズという 2 つの要素に分けることができます。 同時に、異なる期間の異なる市場では、ノイズ成分とトレンド成分の間の幅広い相互関係を示すことができます (図 1)。 価格変動のノイズレベルが高くなるほど、基礎的なトレンドの方向性と強さを識別することが難しくなります。 したがって、この場合は、より遅い傾向の識別方法を使用する必要があります。 一方、ノイズレベルが低い市場では、主要なトレンドが非常に簡単に決定され、トレンドを決定するより迅速な方法が合理的であり、価格の方向の変化からの取引シグナルの遅れを最小限に抑えることができます。 市場の状態を判断するために、高度な効率比 (ER) が使用されます。これは、一定期間にわたる総価格変動とノイズ市場変動の合計の指数関数的な比較に基づいています。効率比 (ER) は変動する可能性があります。 0 から 1 まで。市場に方向性の動きがなく、ノイズのみがある場合、ER 値はゼロになります。 ノイズがまったくなく、市場が一方向に動く場合、ER 値は 1 に等しくなります。
利点
- トレンド取引システムの明確なトレンドの定義
- アグレッシブなシステム (グリッド、平均化、マーチンゲール、シッティング アウト) または高い SL と低い TP のトレーディング システムのフラット決定
- 設定はほとんどありません - バー単位の計算期間のみ
マーケットノイズインジケーターを取引システムへの追加として使用します
市場にある他の製品もお試しください https://www.mql5.com/ru/users/capitalplus/seller