Supply and Demand Order Blocks MT5
- インディケータ
- Issam Kassas
- バージョン: 1.10
- アップデート済み: 22 10月 2023
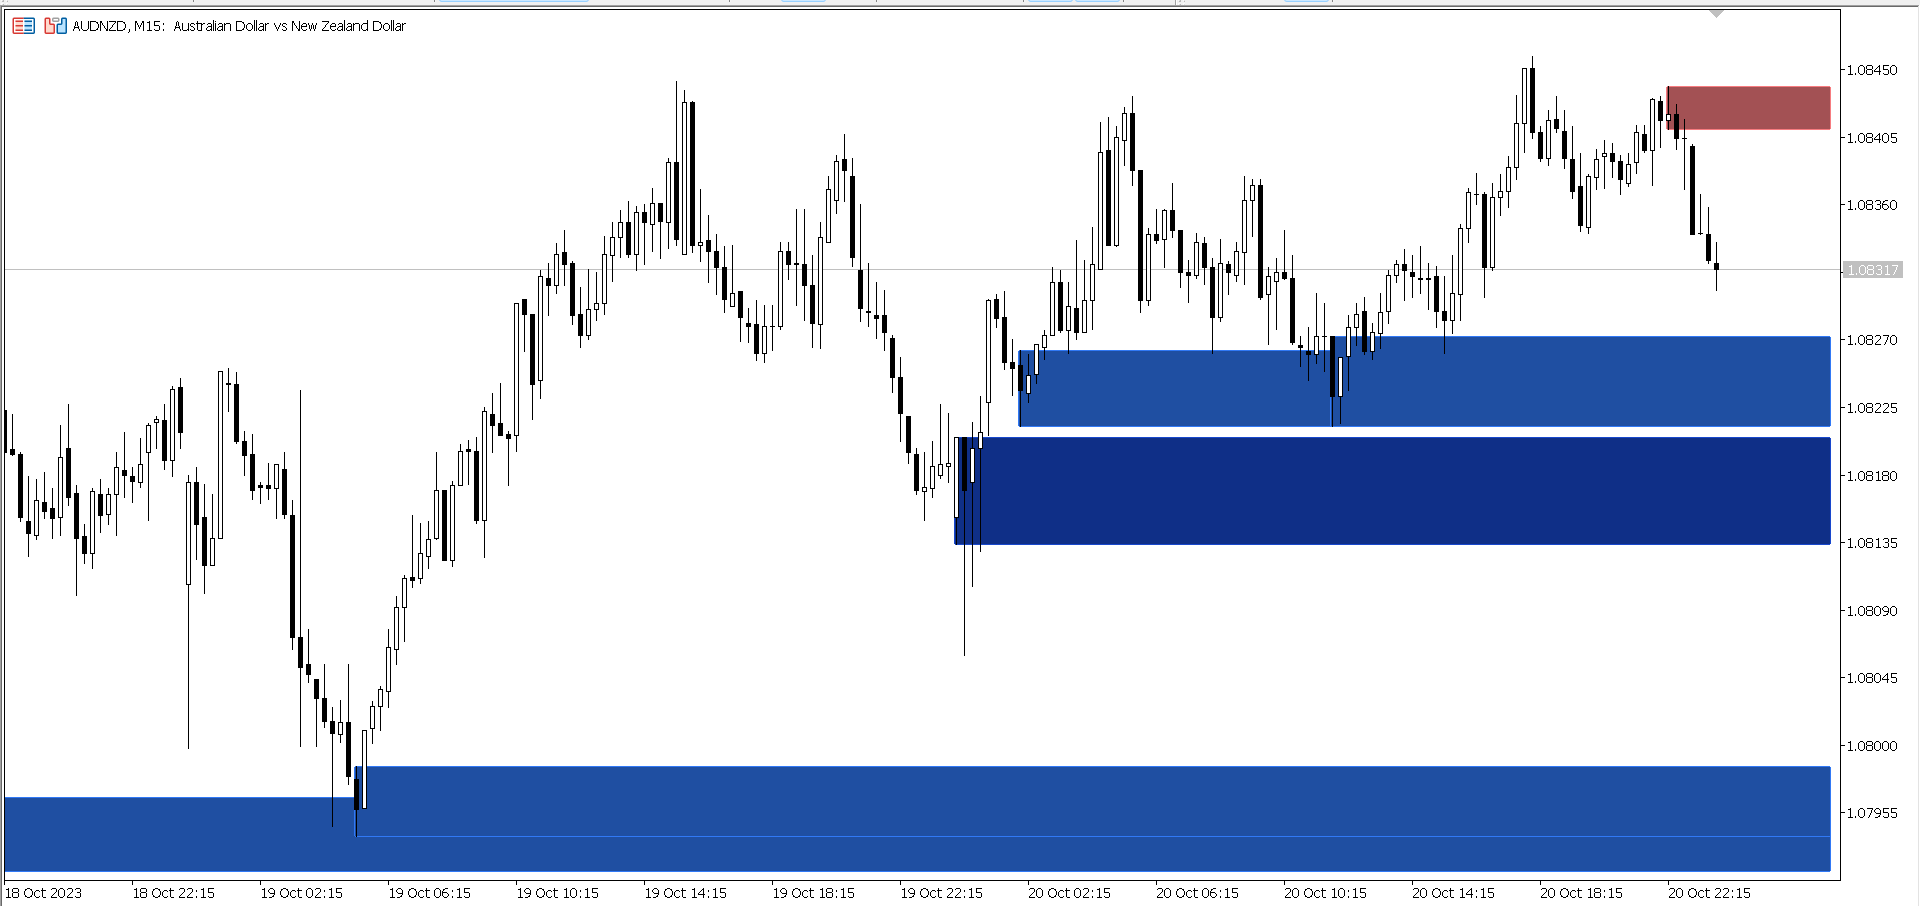
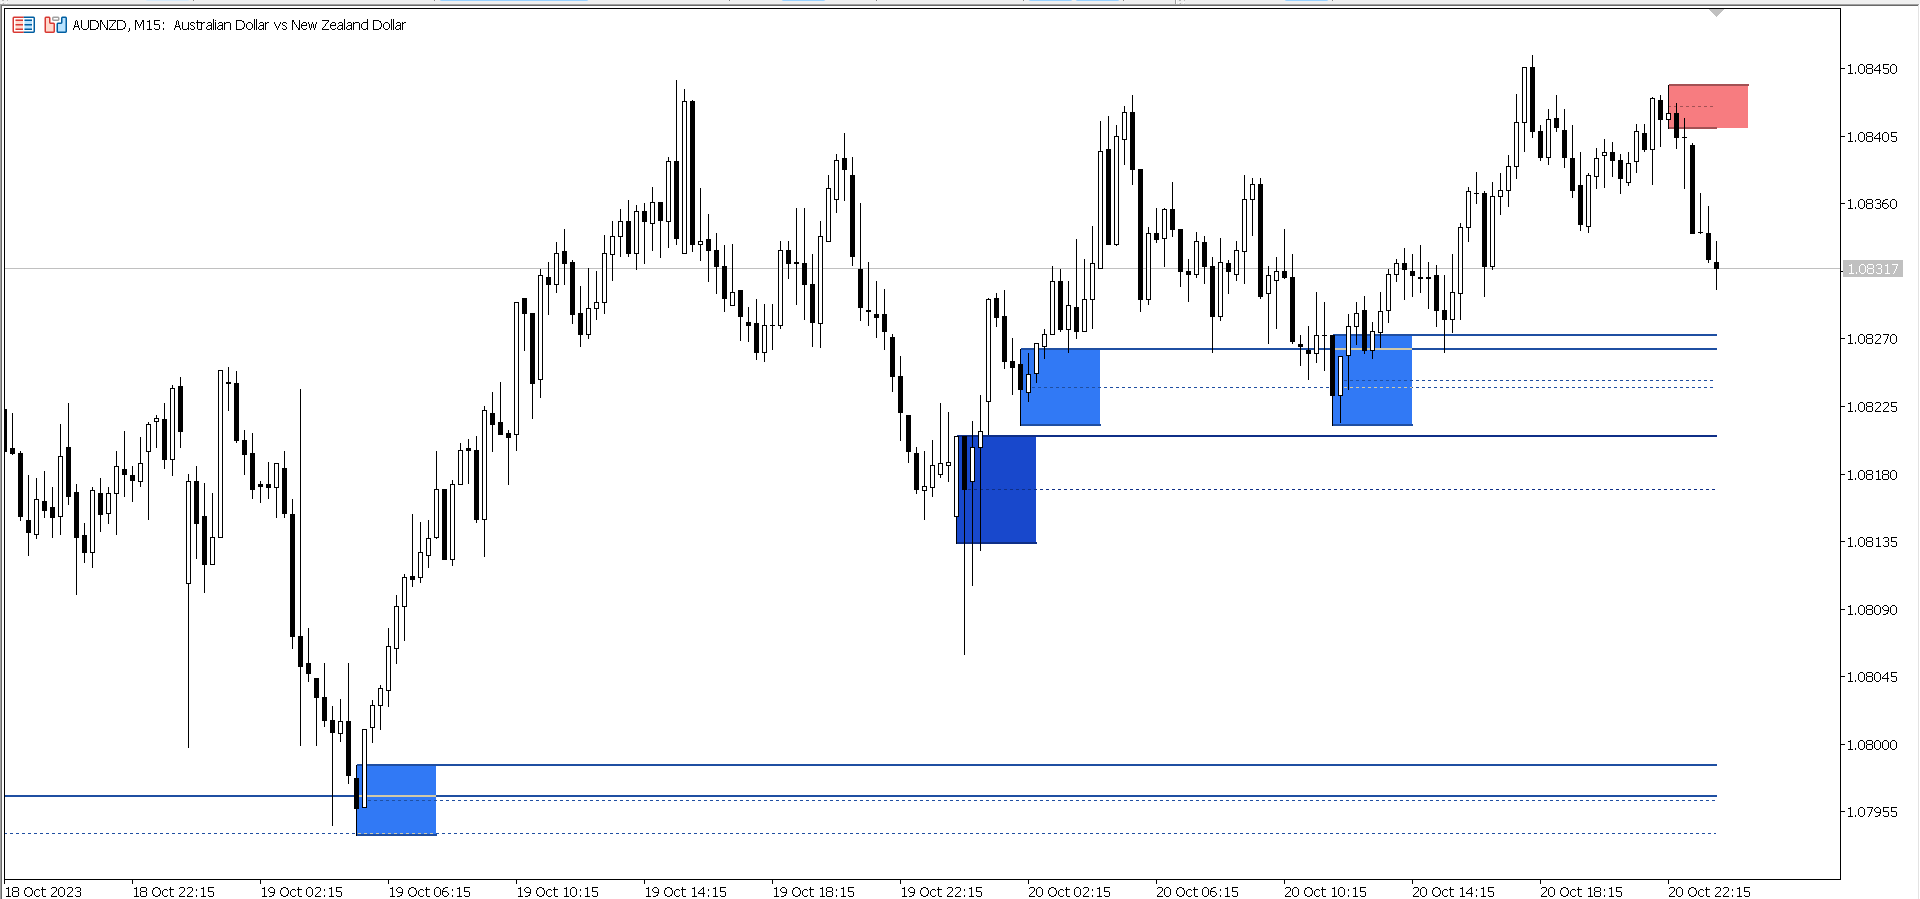
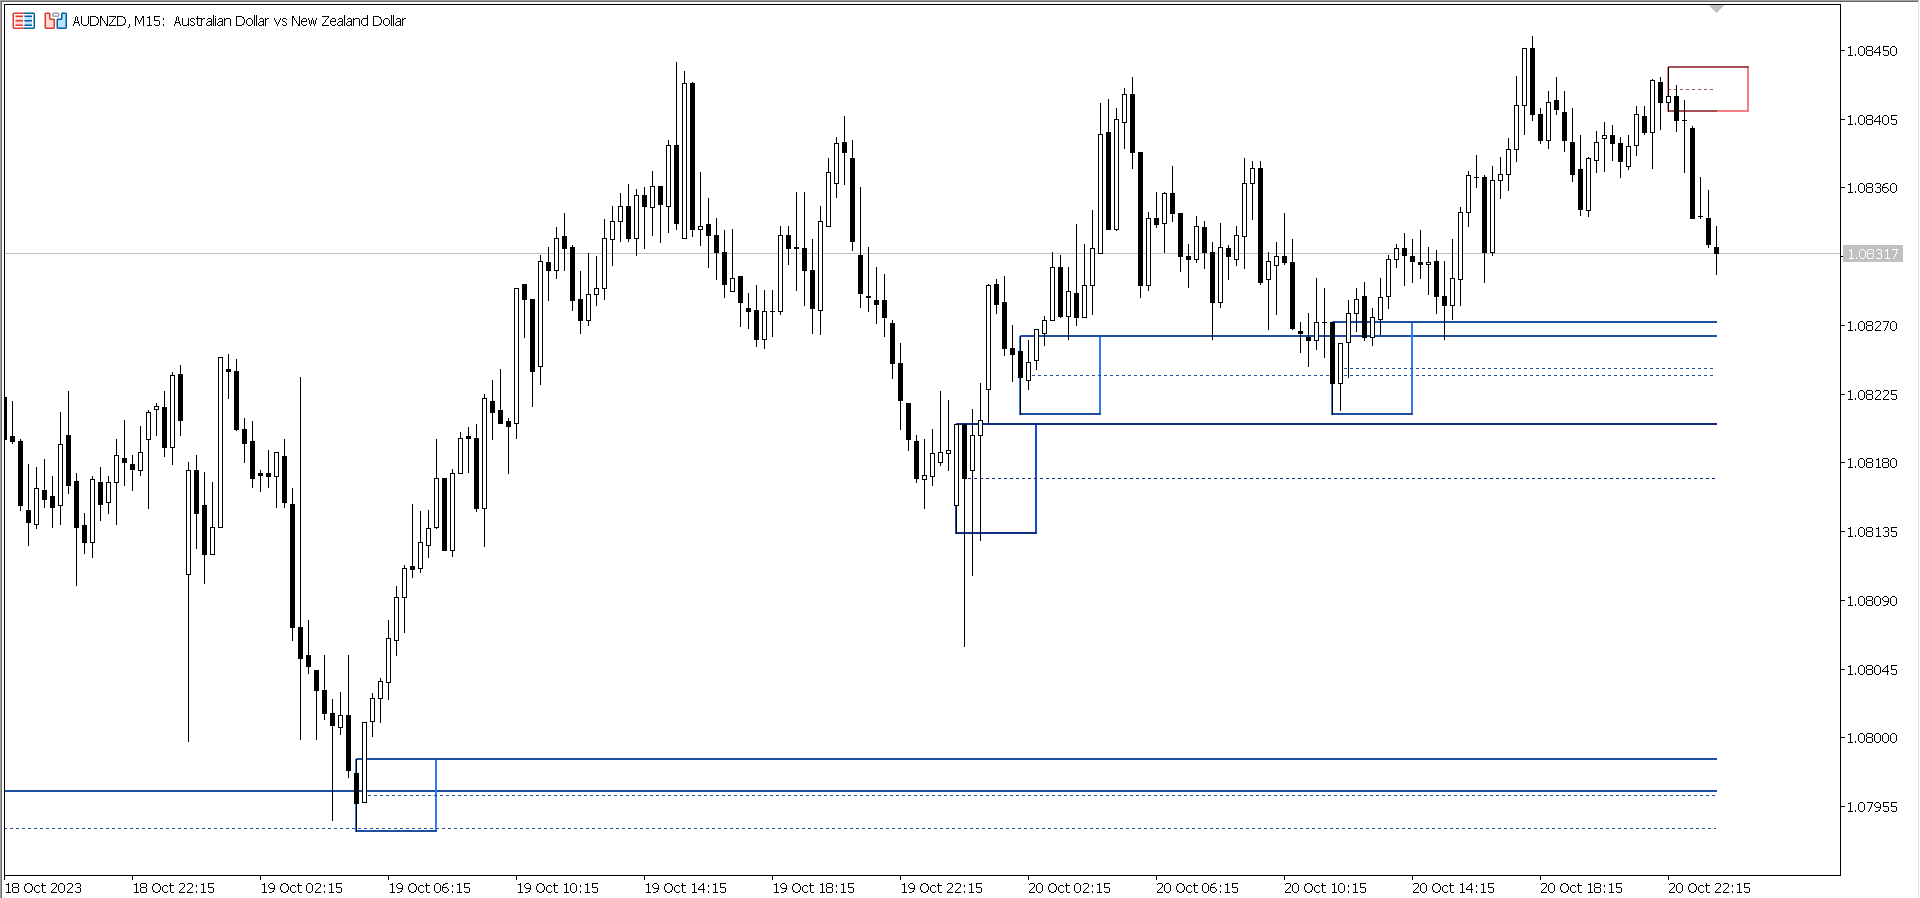
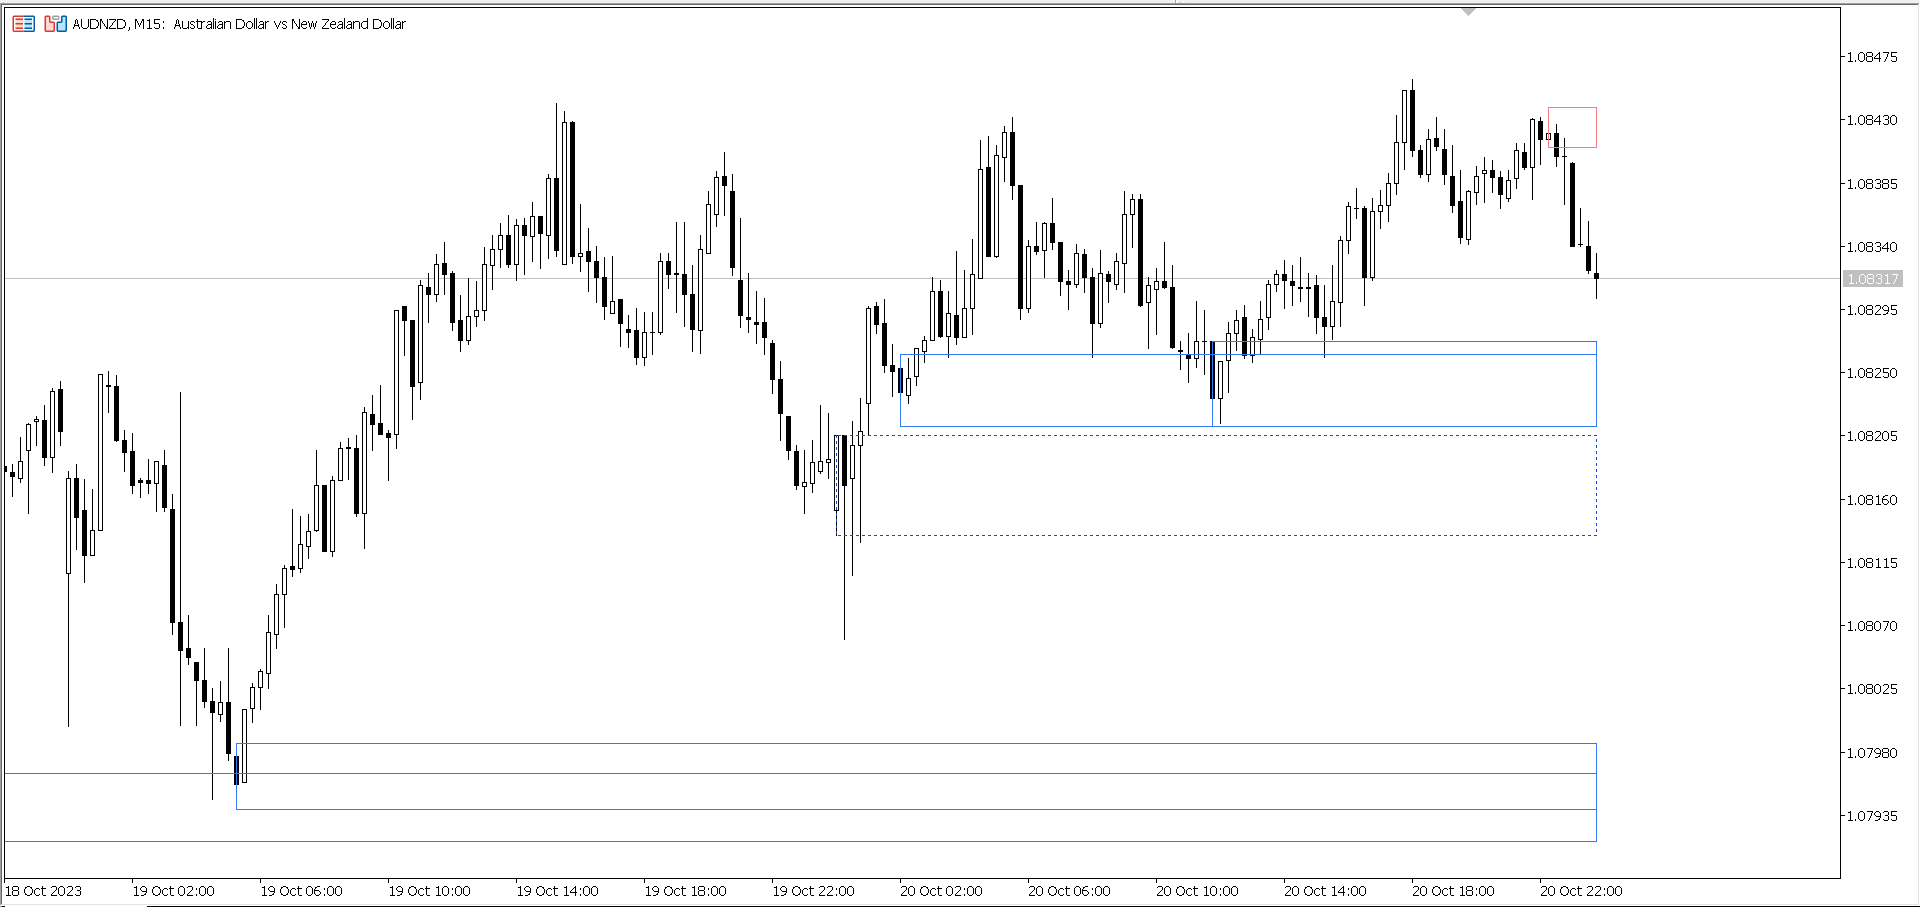
供給と需要のオーダーブロック:
「供給と需要のオーダーブロック」インジケーターは、外国為替のテクニカル分析において重要なスマートマネーの概念に基づいた洗練されたツールです。このツールは供給と需要ゾーンを特定し、機関投資家が重要な足跡を残す重要な領域に焦点を当てています。売り注文を示す供給ゾーンと買い注文を示す需要ゾーンは、トレーダーが価格の逆転や減速を予測するのに役立ちます。このインジケーターは、ブレイクアウト・オブ・ストラクチャー(BoS)およびフェアバリューギャップ(FVG)のコンポーネントを組み合わせた賢明なアルゴリズムを採用しています。BoSは市場の混乱を検出し、潜在的なオーダーブロックを特定し、FVGは精度を向上させるためにフェアバリューギャップを考慮しています。このツールはこれらの条件の視覚的表現を提供し、潜在的なオーダーブロックを強調し、市場のダイナミクスや転換点に関する洞察を提供することで、トレーダーの意思決定を支援します。使いやすいデザインは、さまざまな技術的な専門知識レベルのトレーダーにアクセスしやすく、高度な分析の包括的なソリューションを提供します。
特徴:
- スマートマネーの概念:機関投資家のトレーディング戦略に基づく。
- 供給と需要ゾーン:売り注文と買い注文のブロックを特定します。
- カスタムオーダーブロックの描画タイプ。
- アルゴリズムの洗練:BoSが市場の混乱を検出し、FVGが精度を向上させるためにフェアバリューギャップを考慮します。
- 視覚的表現:チャート上で潜在的なオーダーブロックを強調表示します。
- 使いやすい:さまざまな経験レベルのトレーダーにアクセスしやすい。
- 包括的な分析:洞察を得るためにBoSとFVGを統合します。
- 情報をもとにした意思決定:逆転や減速を予測するのに役立ちます。


a useful tool