ISolz MTF Candles2
- インディケータ
- Iqrar Hussain
- バージョン: 1.1
- アップデート済み: 27 11月 2023
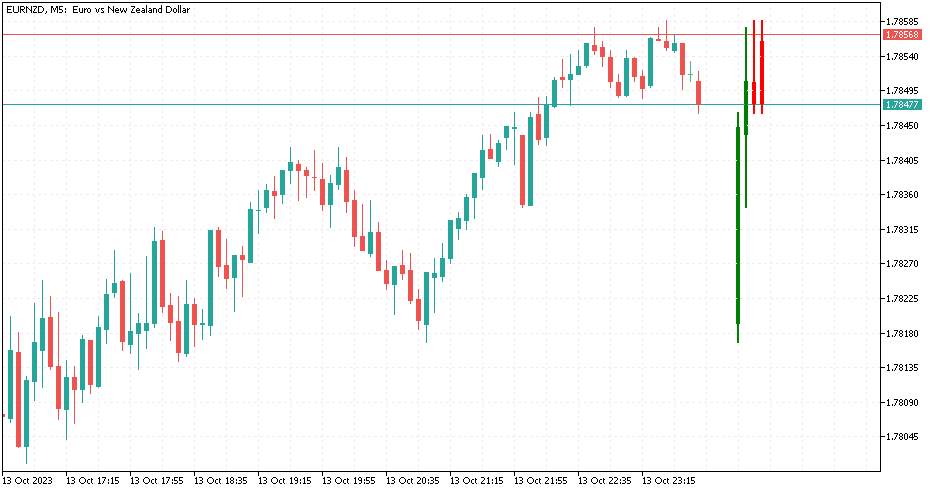
This indicator displays MTF (Multi-Time Frame) Candles on your Chart. It helps to see the overall Trend of Market. You can specify 2ndLast, Last or Current Candle of any timeframe to show to get a better picture of Trend.. You get 4TF Bars/Candles on your current chart ..
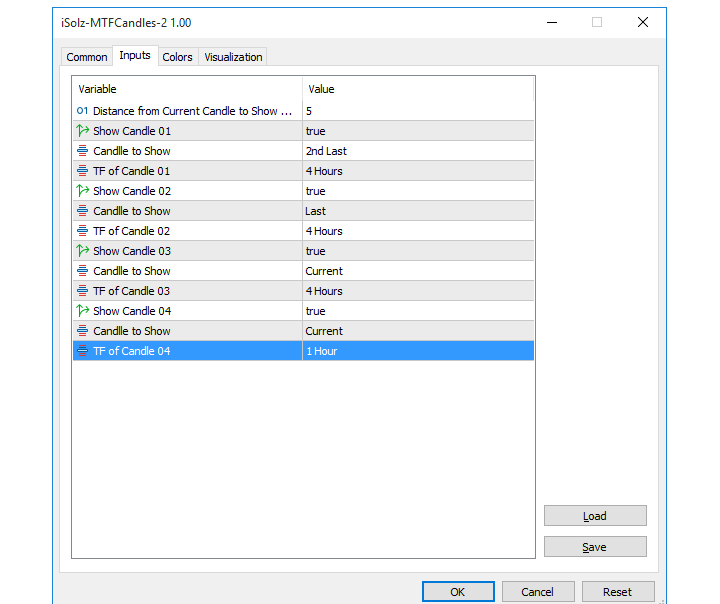
Customizable Settings are :
1. Where to place MTF Candles..
2. Show or Hide for each Candle
2. Time-Frame for each Candle
3. Current/ Last / 2nd Last of Each Candle


Super usefull tool