Gold Venamax MT5
- インディケータ
- Sergei Linskii
- バージョン: 4.0
- アップデート済み: 10 2月 2024
- アクティベーション: 5
Gold Venamax - これは最高の株式テクニカル指標です。 指標アルゴリズムは資産の価格変動を分析し、ボラティリティと潜在的なエントリーゾーンを反映します。
インジケーターの機能:
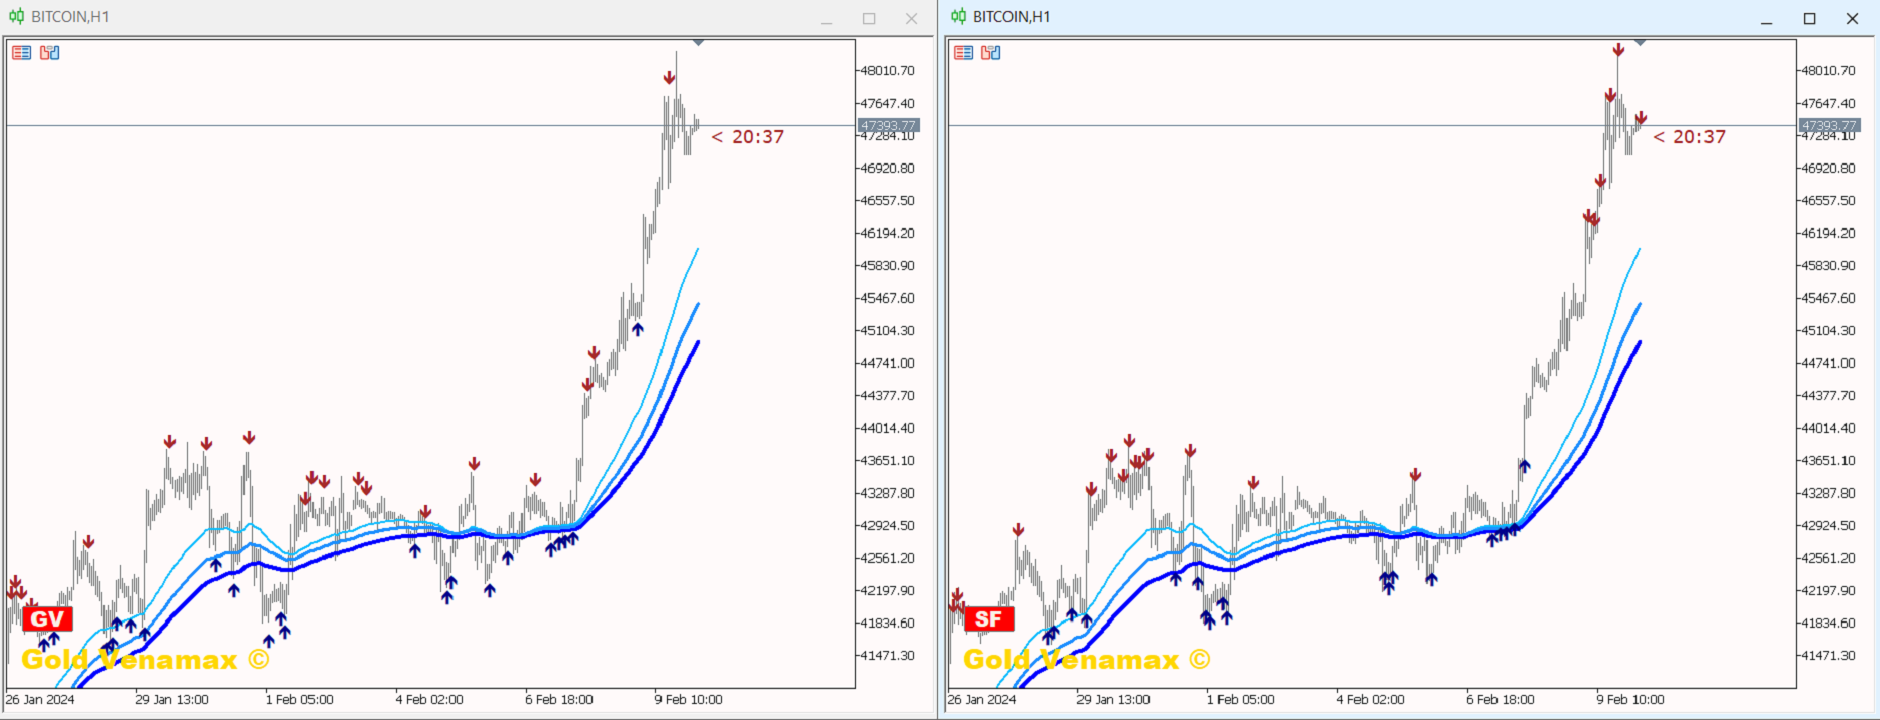
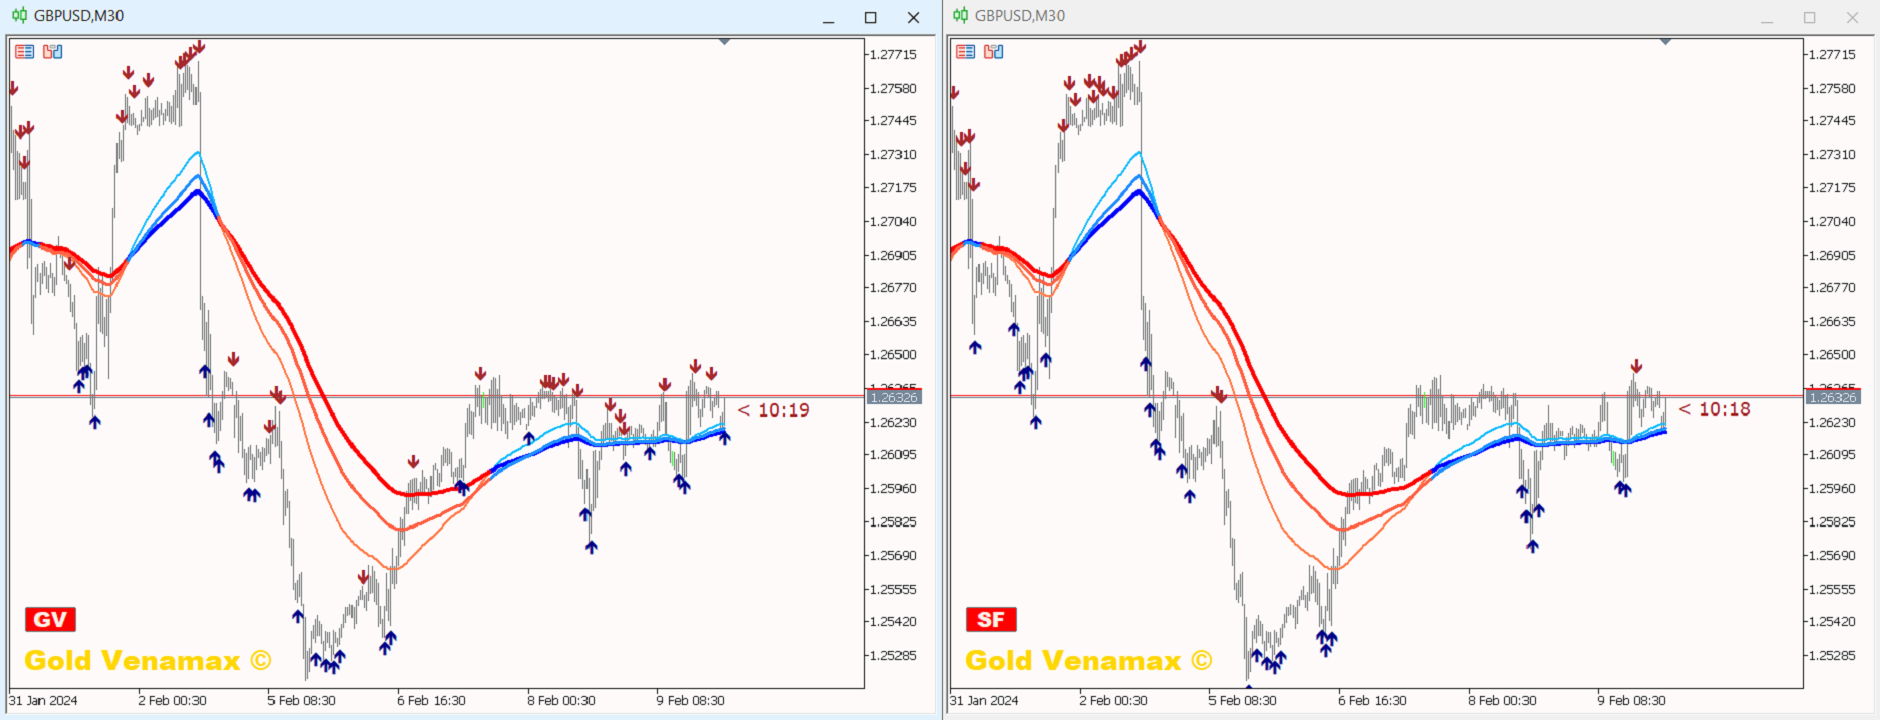
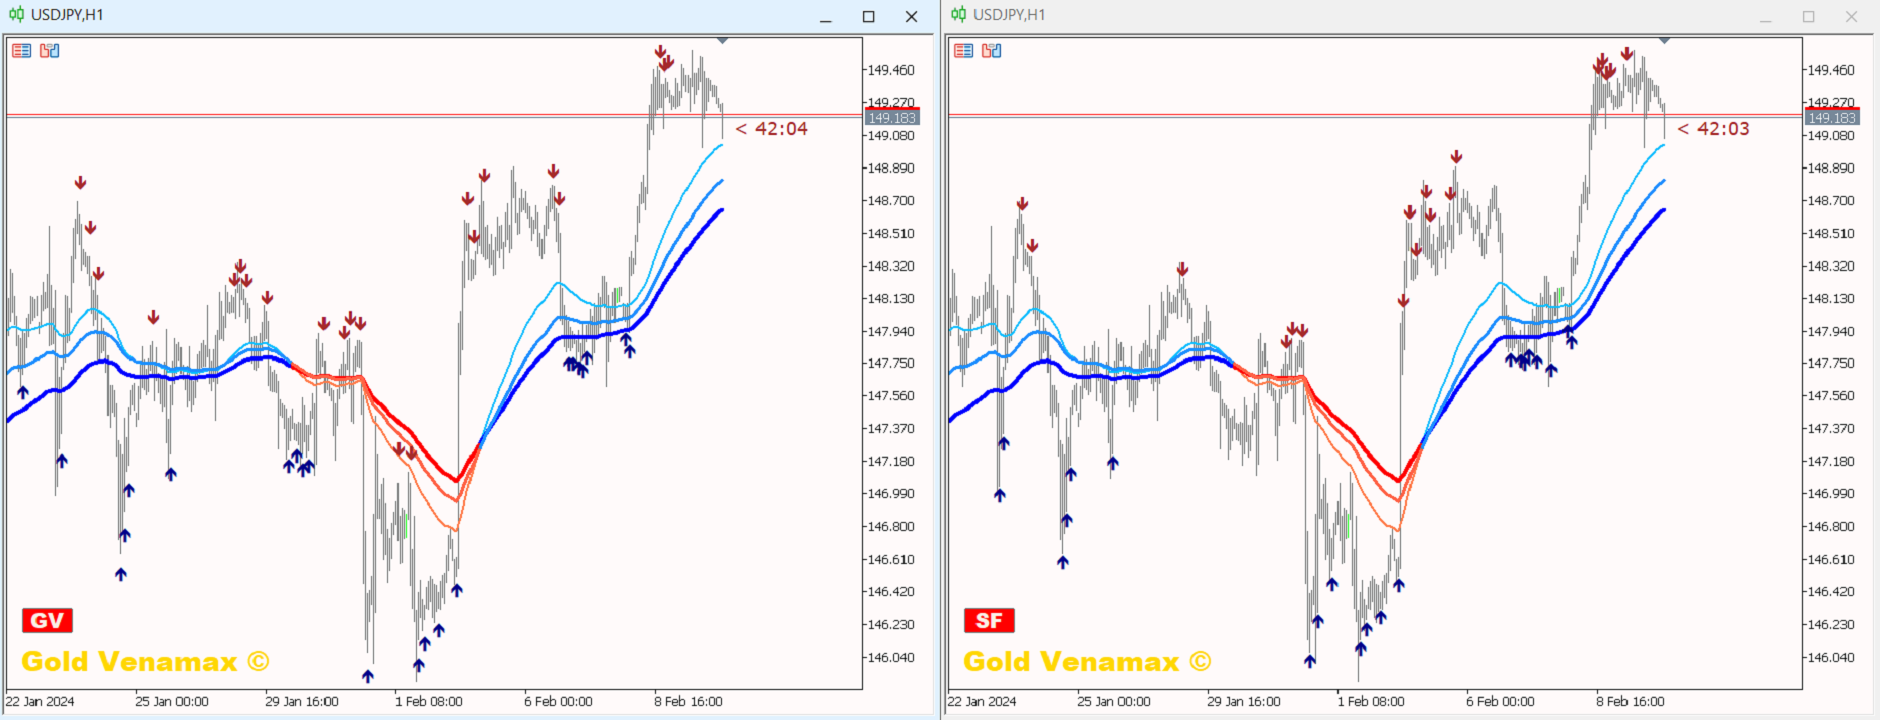
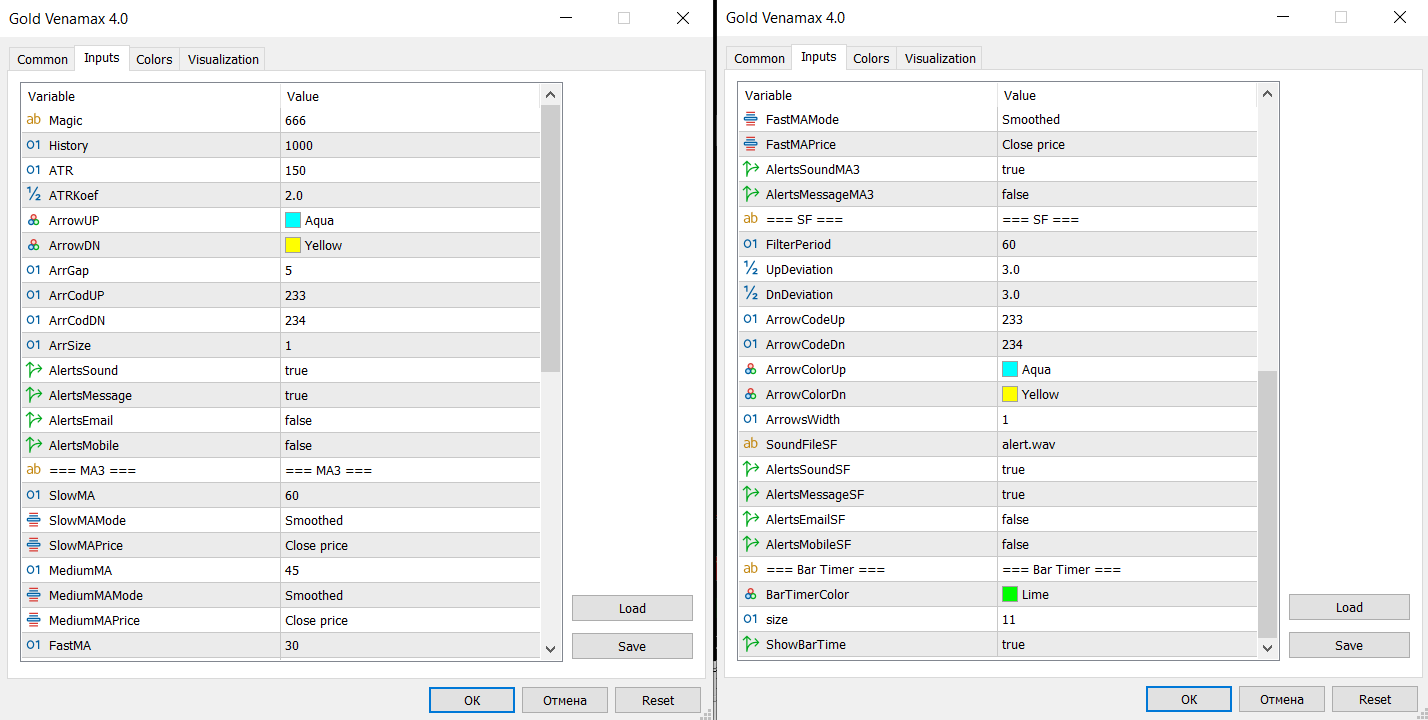
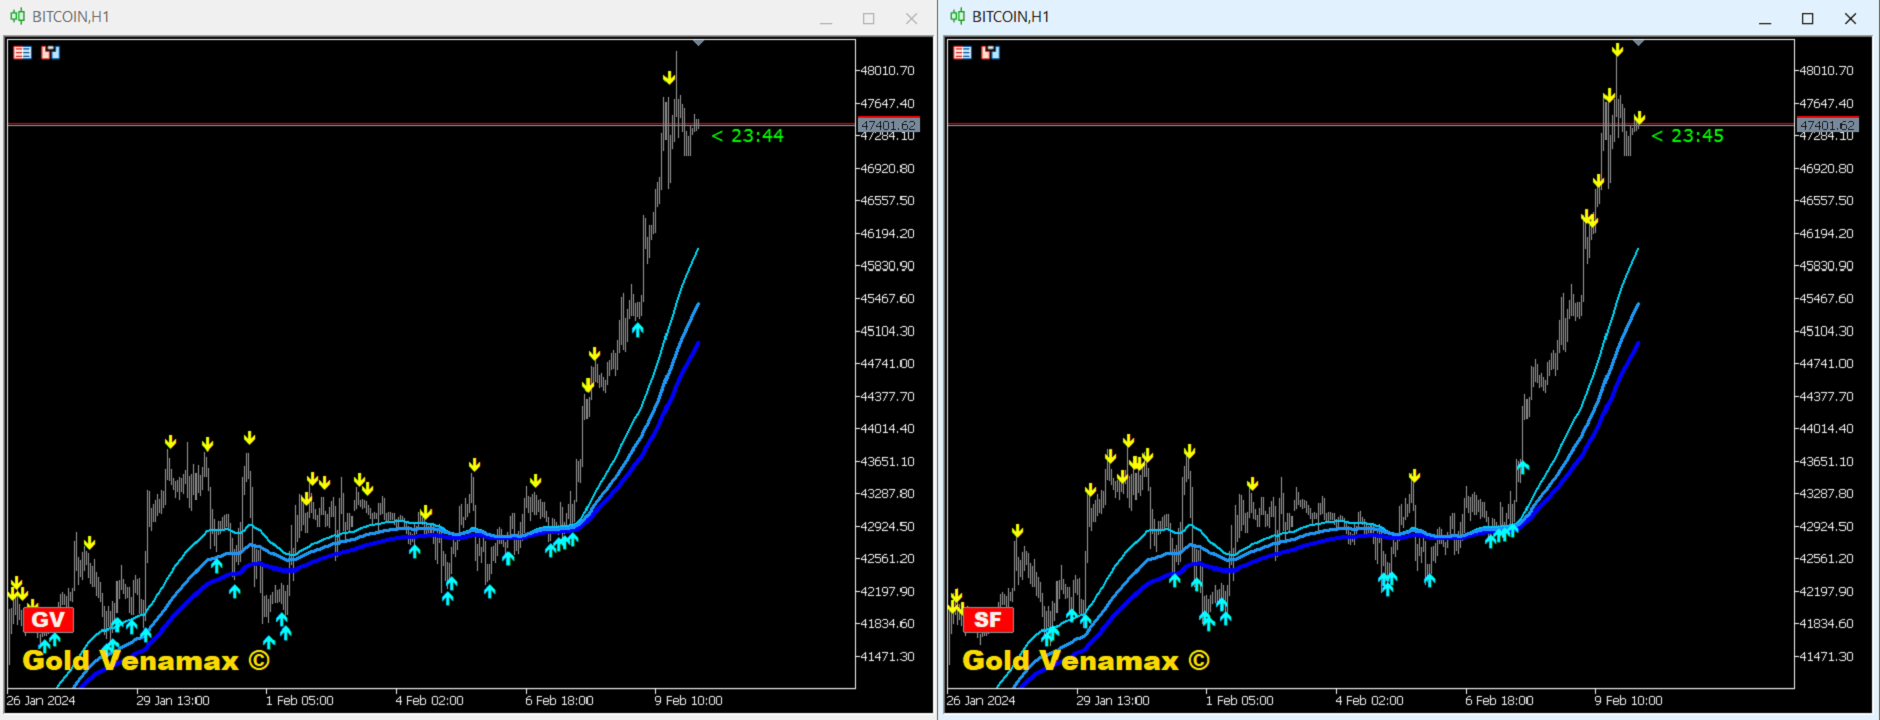
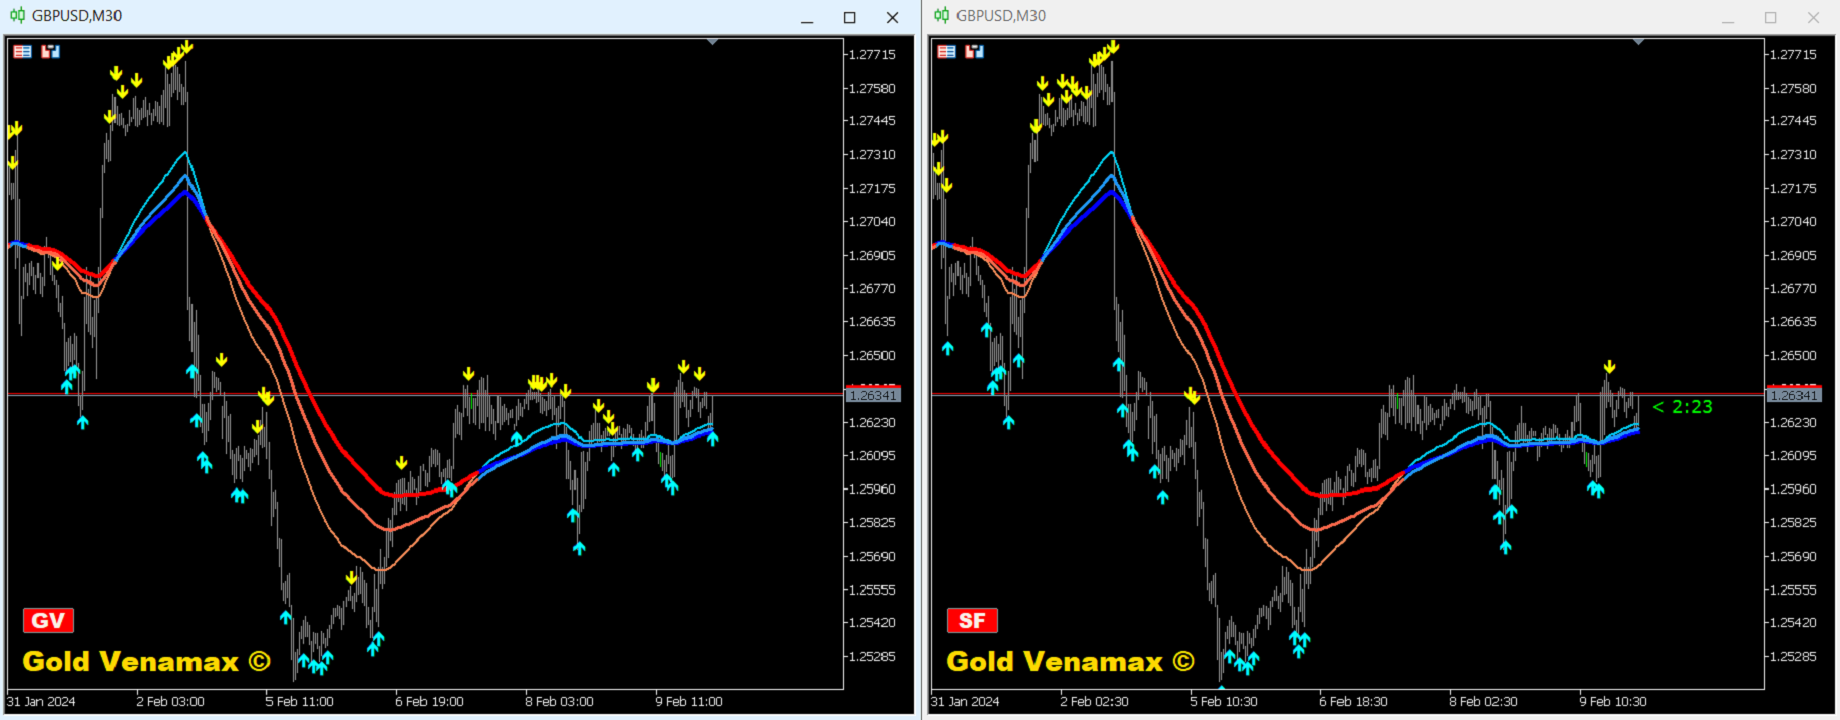
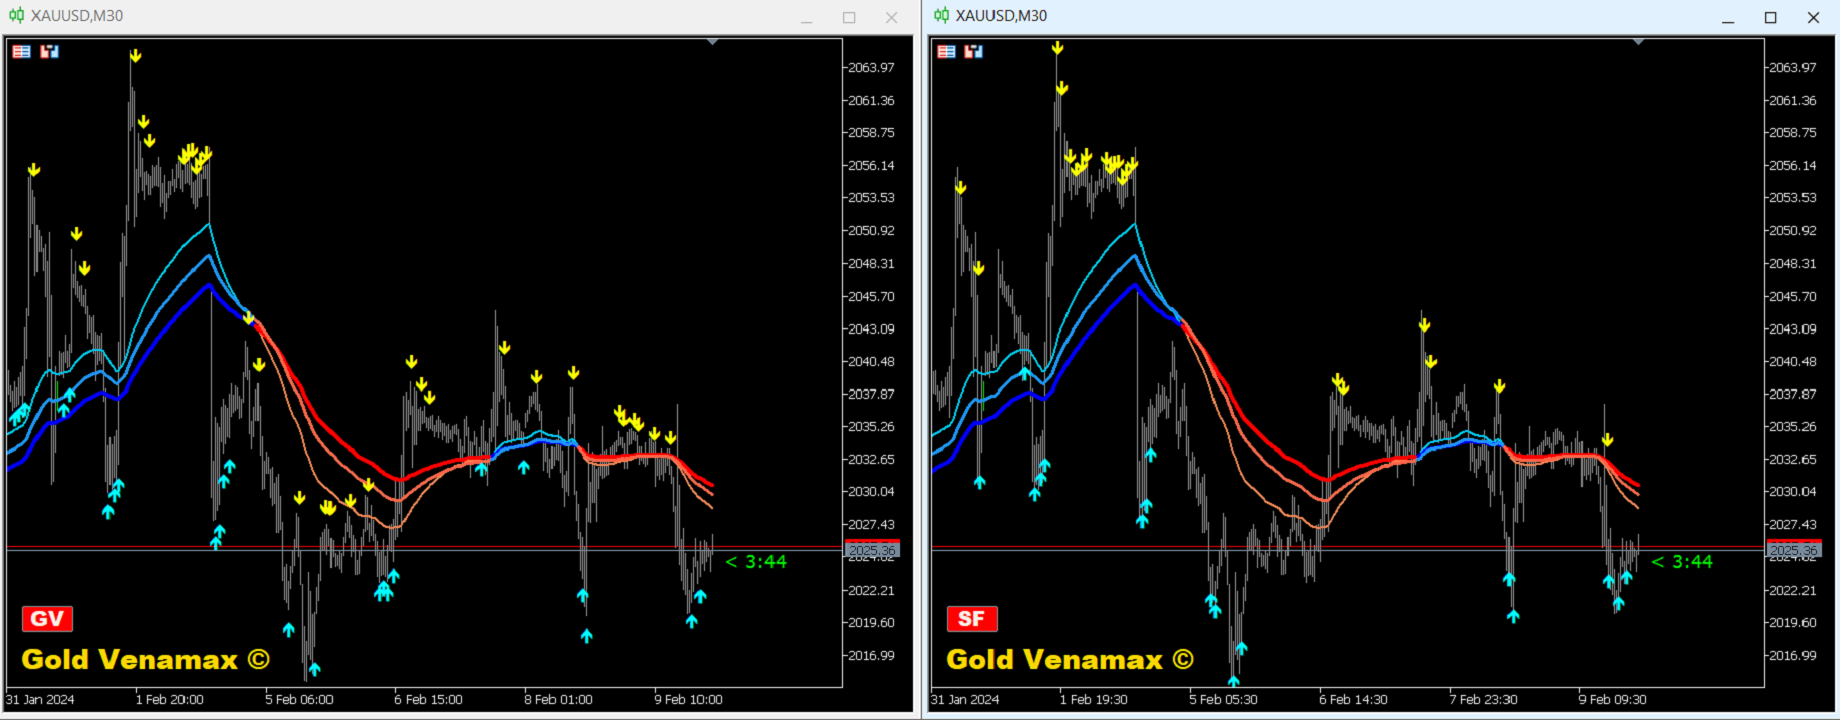
- これは、快適で収益性の高い取引のためのマジックとトレンド矢印の 2 つのブロックを備えたスーパー インジケーターです。 チャート上にブロックを切り替えるための赤いボタンが表示されます。 マジックはインジケーター設定で設定されているため、異なるブロックを表示する 2 つのチャートにインジケーターをインストールできます。
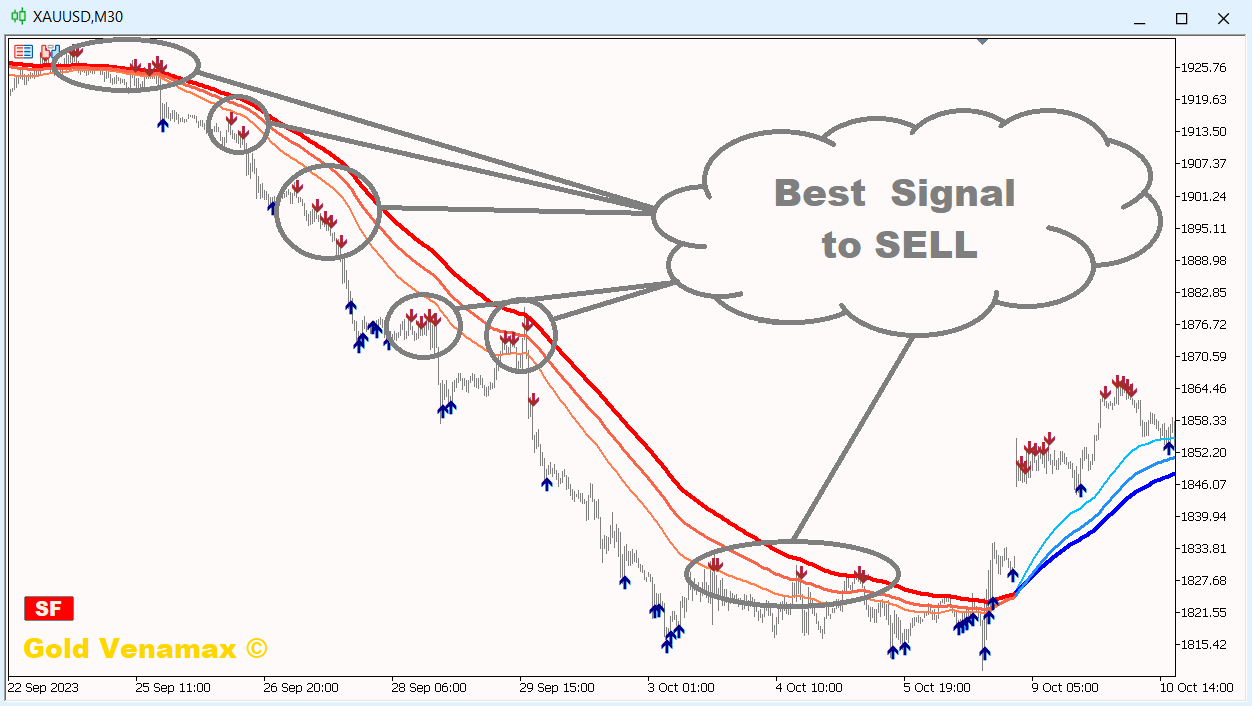
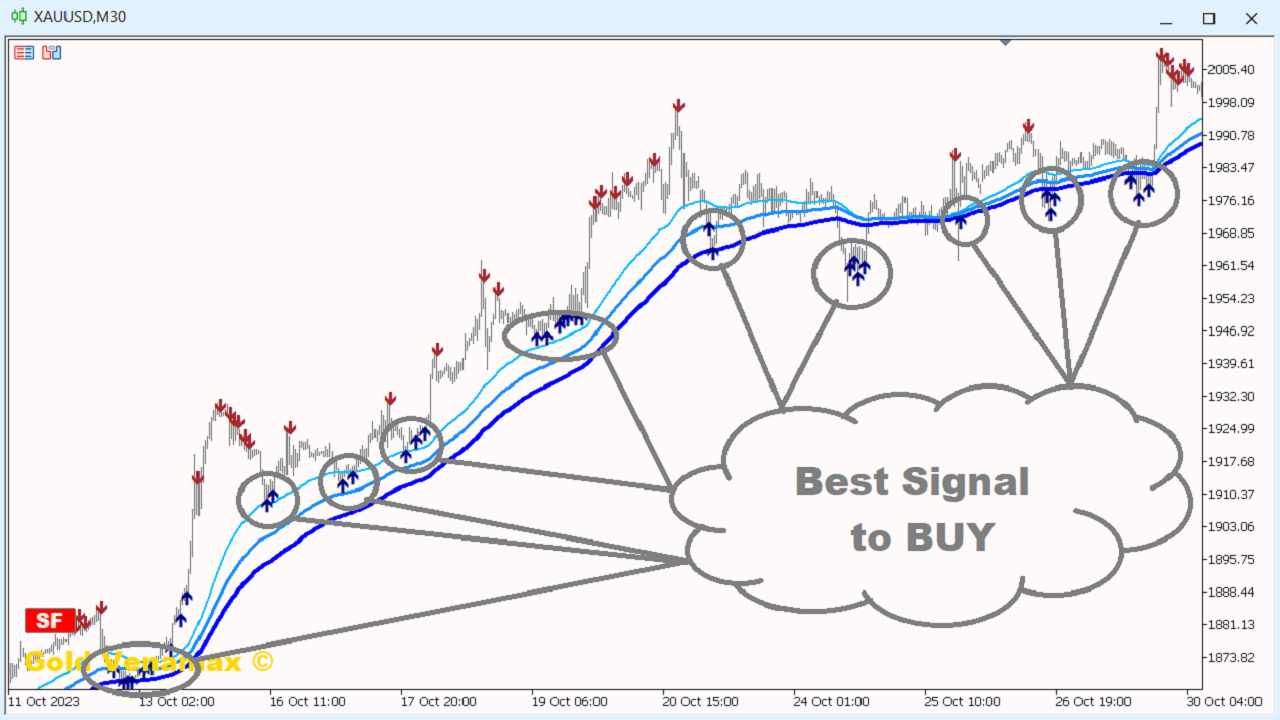
- Gold Venamax は、異なる矢印バッファー (GV と SF) を備えた 2 つのチャートに配置できます。 これを行うには、設定で異なる Magic を選択する必要があります。たとえば、あるマジック = 999、別のマジック = 666 を選択します。次に、チャート上の赤いボタンで矢印バッファを選択できます。
- 入力するのに最適な信号 = 両方のバッファ (GV および SF) の信号矢印 + 3 本すべての MA ライン (赤または青) の方向に従います。
インジケーターの利点:
1. インジケーターは高精度の信号を生成します。
2. 矢印信号が再描画されていないことを確認しました。
3. どのブローカーの MetaTrader 5 取引プラットフォームでも取引できます。
4. あらゆる資産(通貨、金属、暗号通貨、株、指数など)を取引できます。
5. M30 および H1 の時間枠で取引する (中期取引)。
6. インジケーター設定では個々のパラメーター (色など) を変更できるため、各トレーダーがインジケーターを自分用に簡単にカスタマイズできます。
7. このインジケーターは、独立した取引システムだけでなく、取引システムへの優れた主要な追加機能としても使用できます。
注意: 取引のエントリー精度と収益性はトレーダーのスキルのみに依存します。 どのインジケーターもトレーダーの単なるアシスタントであり、行動のガイドではありません。
皆様の取引の成功と安定した利益をお祈りしています。


Still testing and had also doubts about repainting arrows but you have to wait until candle is fully closed. In my example I am testing on 4H TF to have more accurate signals so I have to wait 4h. During this 4h can arrow flash on/off but important if arrow stay there after 4h candle is closed. If not, signal is invalidated. If yes signal is in place.