ECM Channel MT4
- インディケータ
- Paulo Rocha
- バージョン: 1.0
- アクティベーション: 10
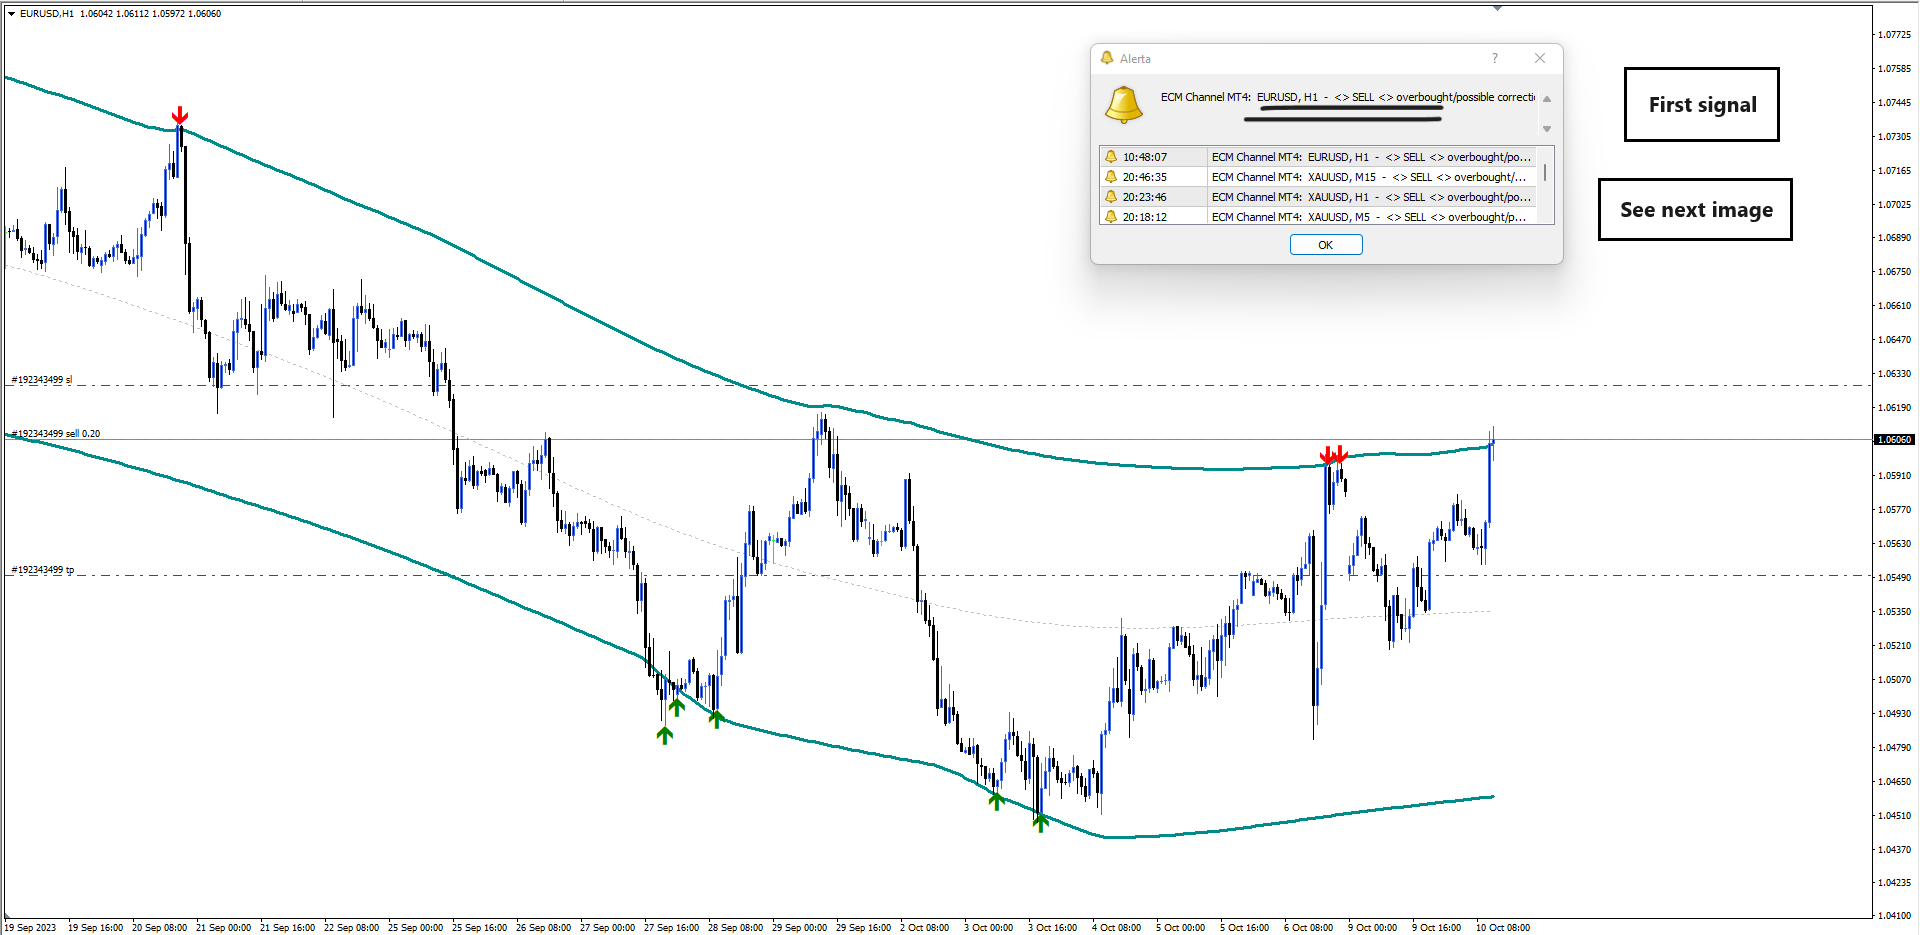
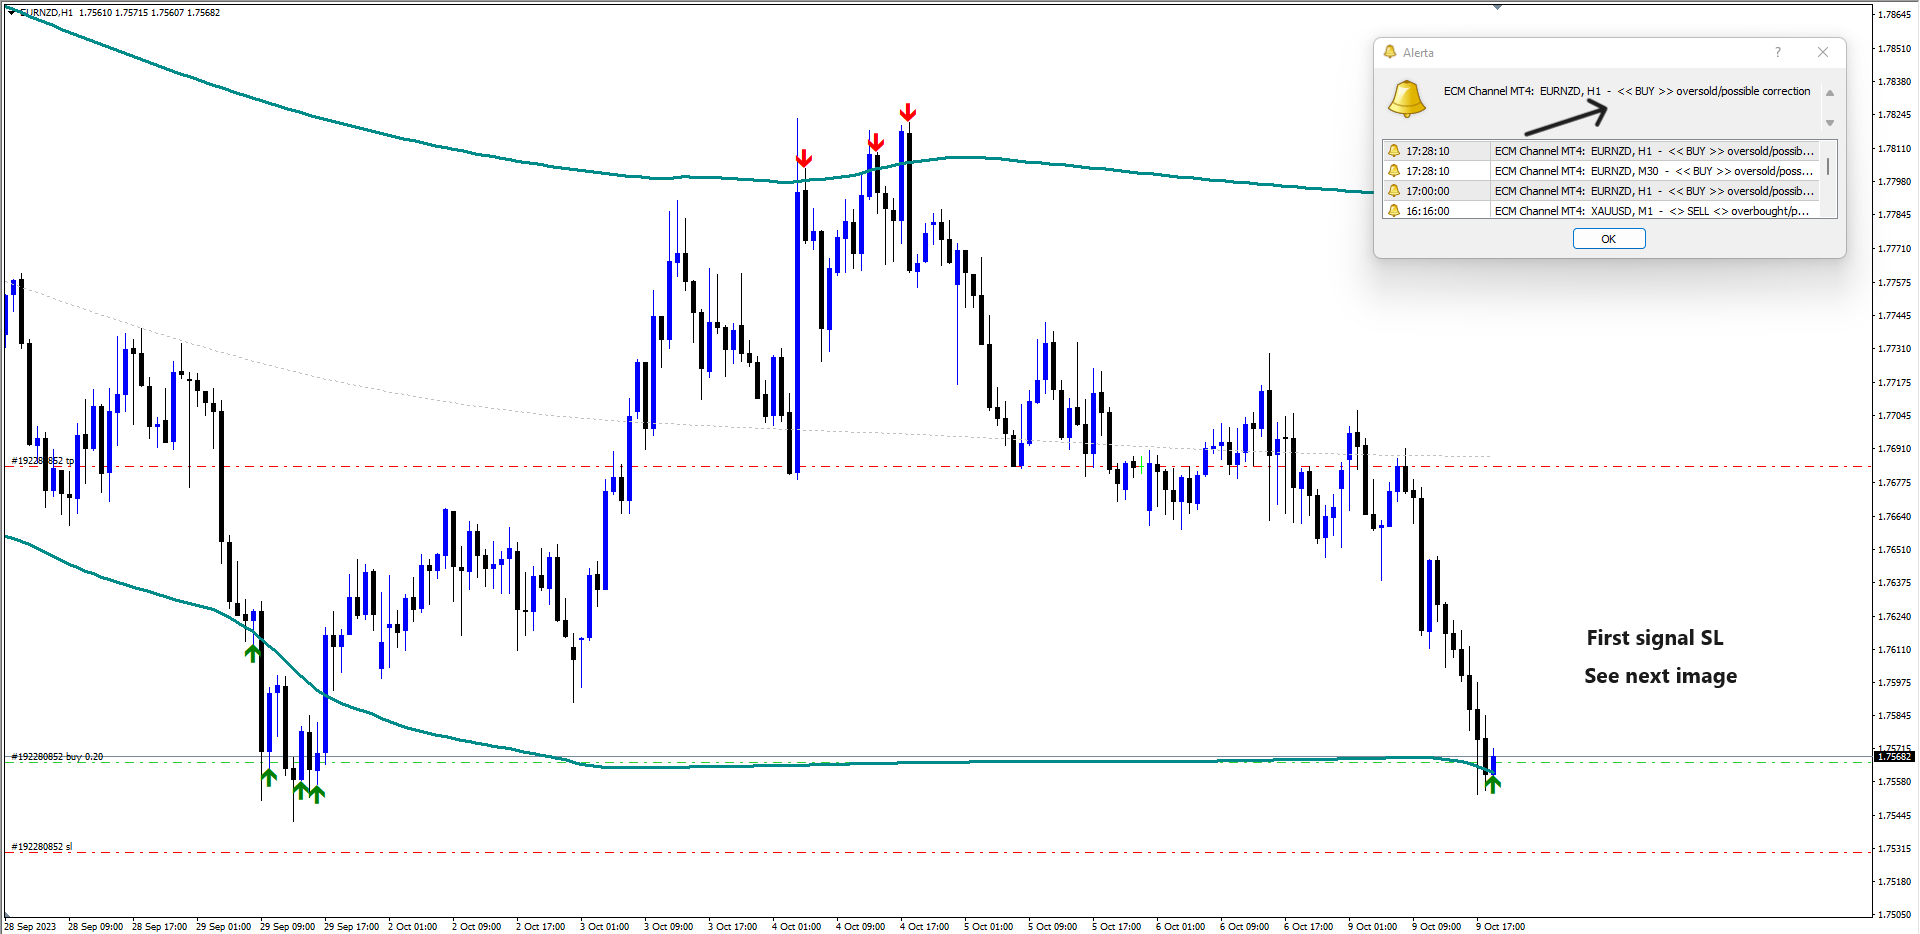
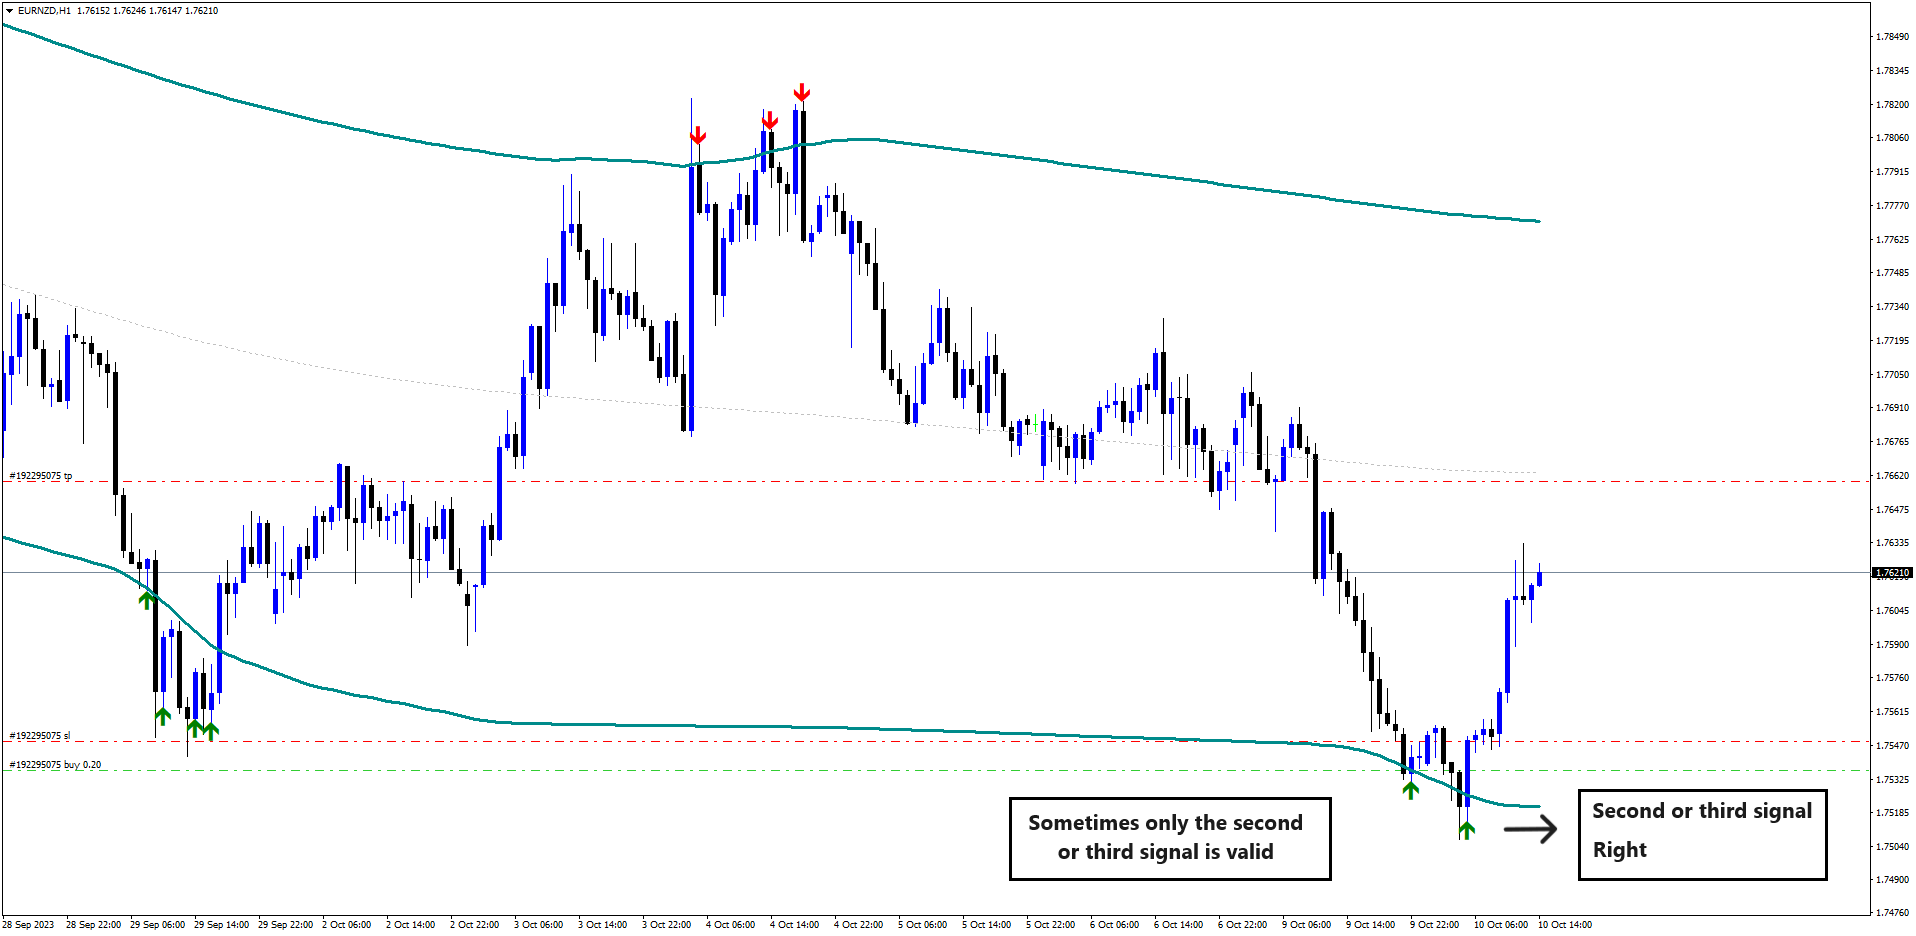
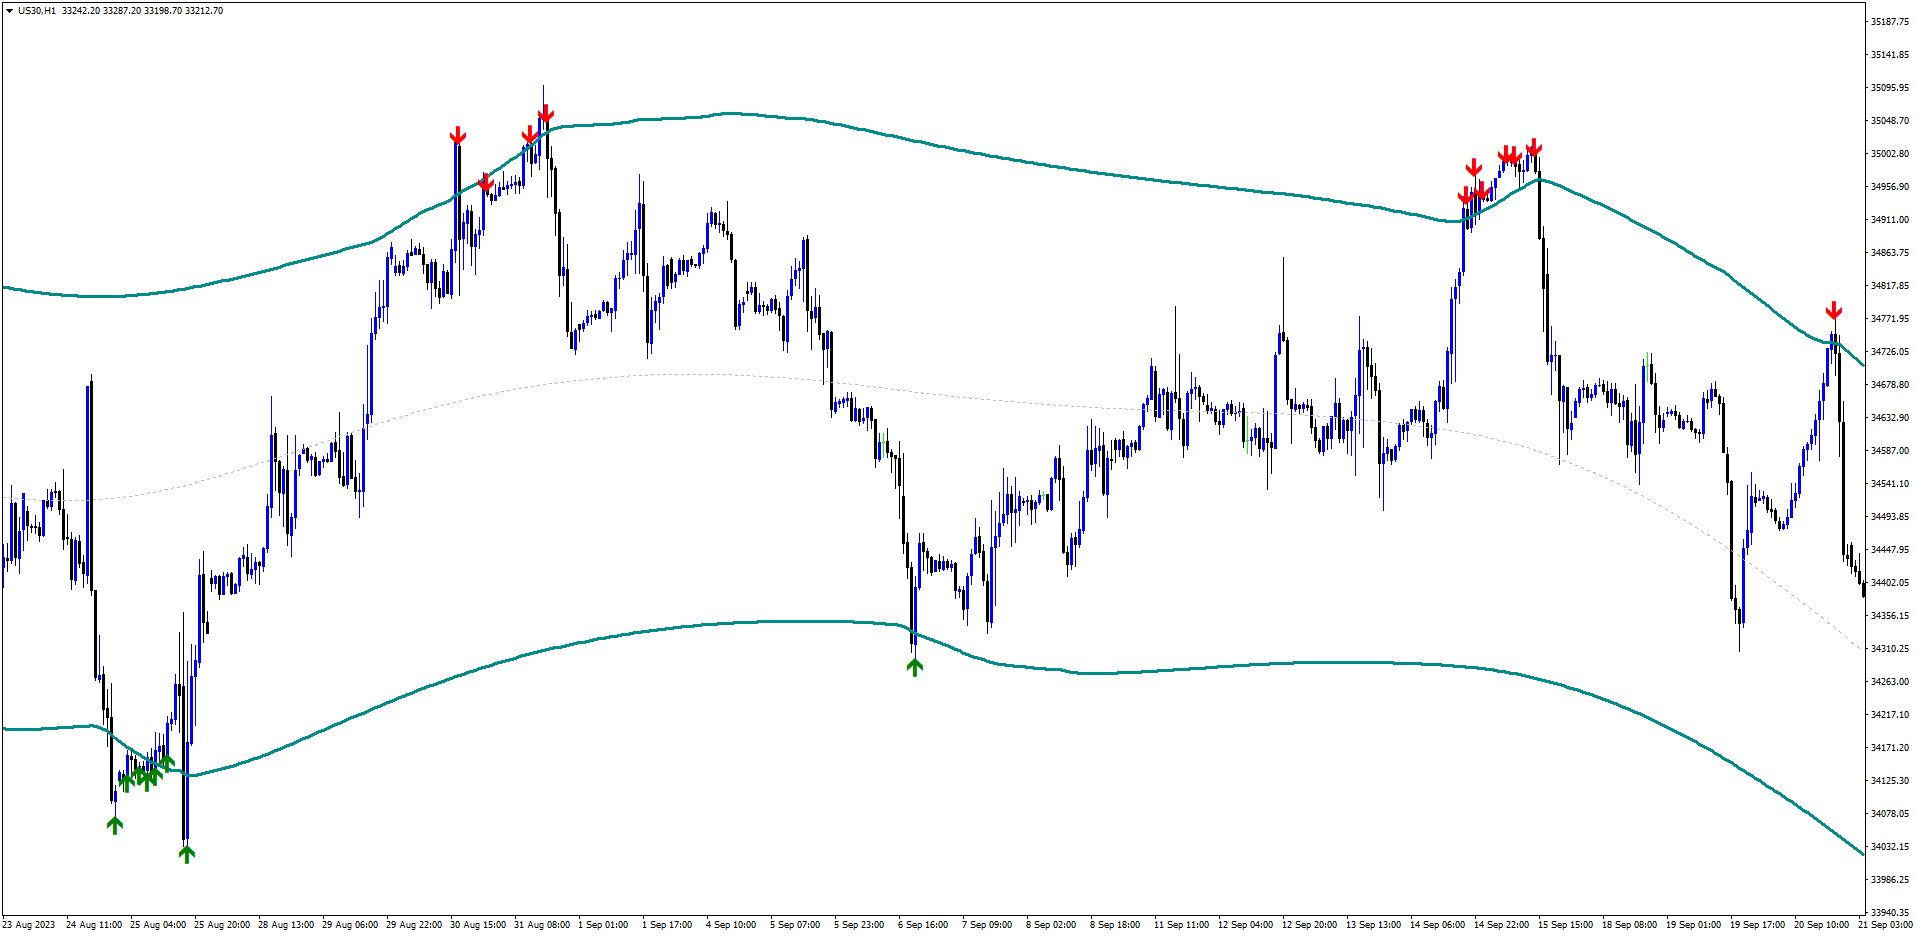
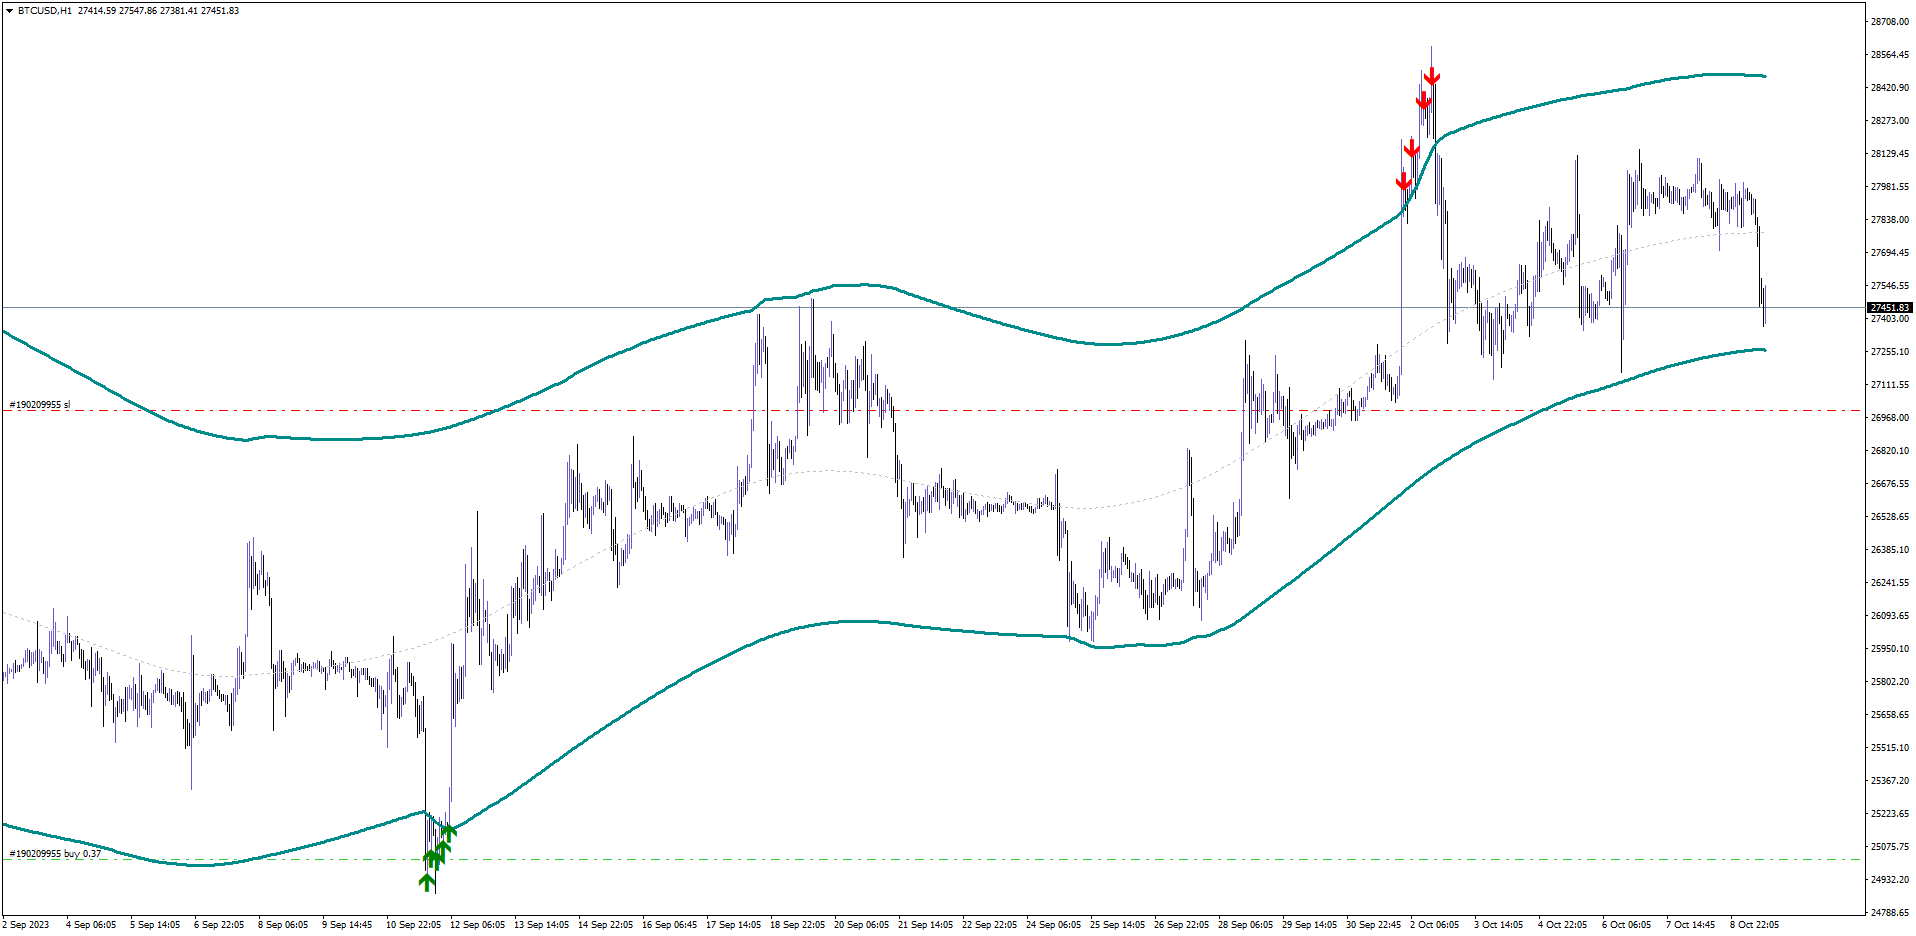
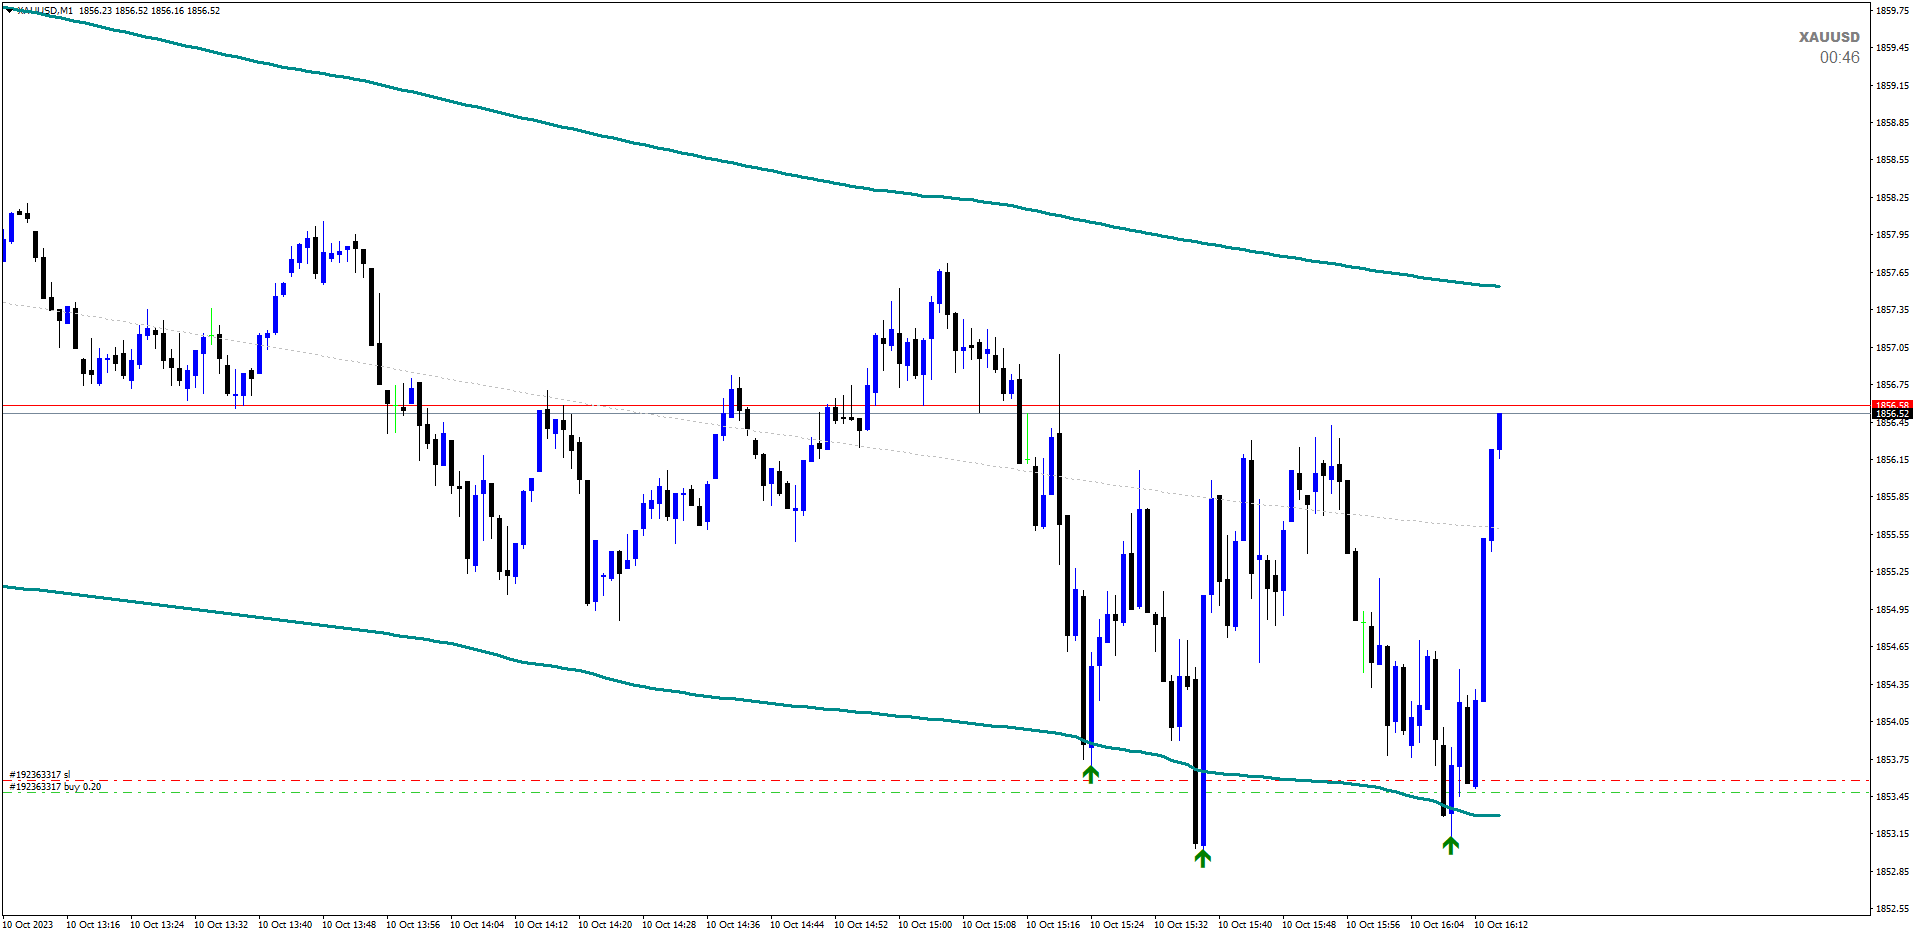
ECM Elite Channel is a volatility-based indicator, developed with a specific time algorithm, which consists of finding possible corrections in the market.
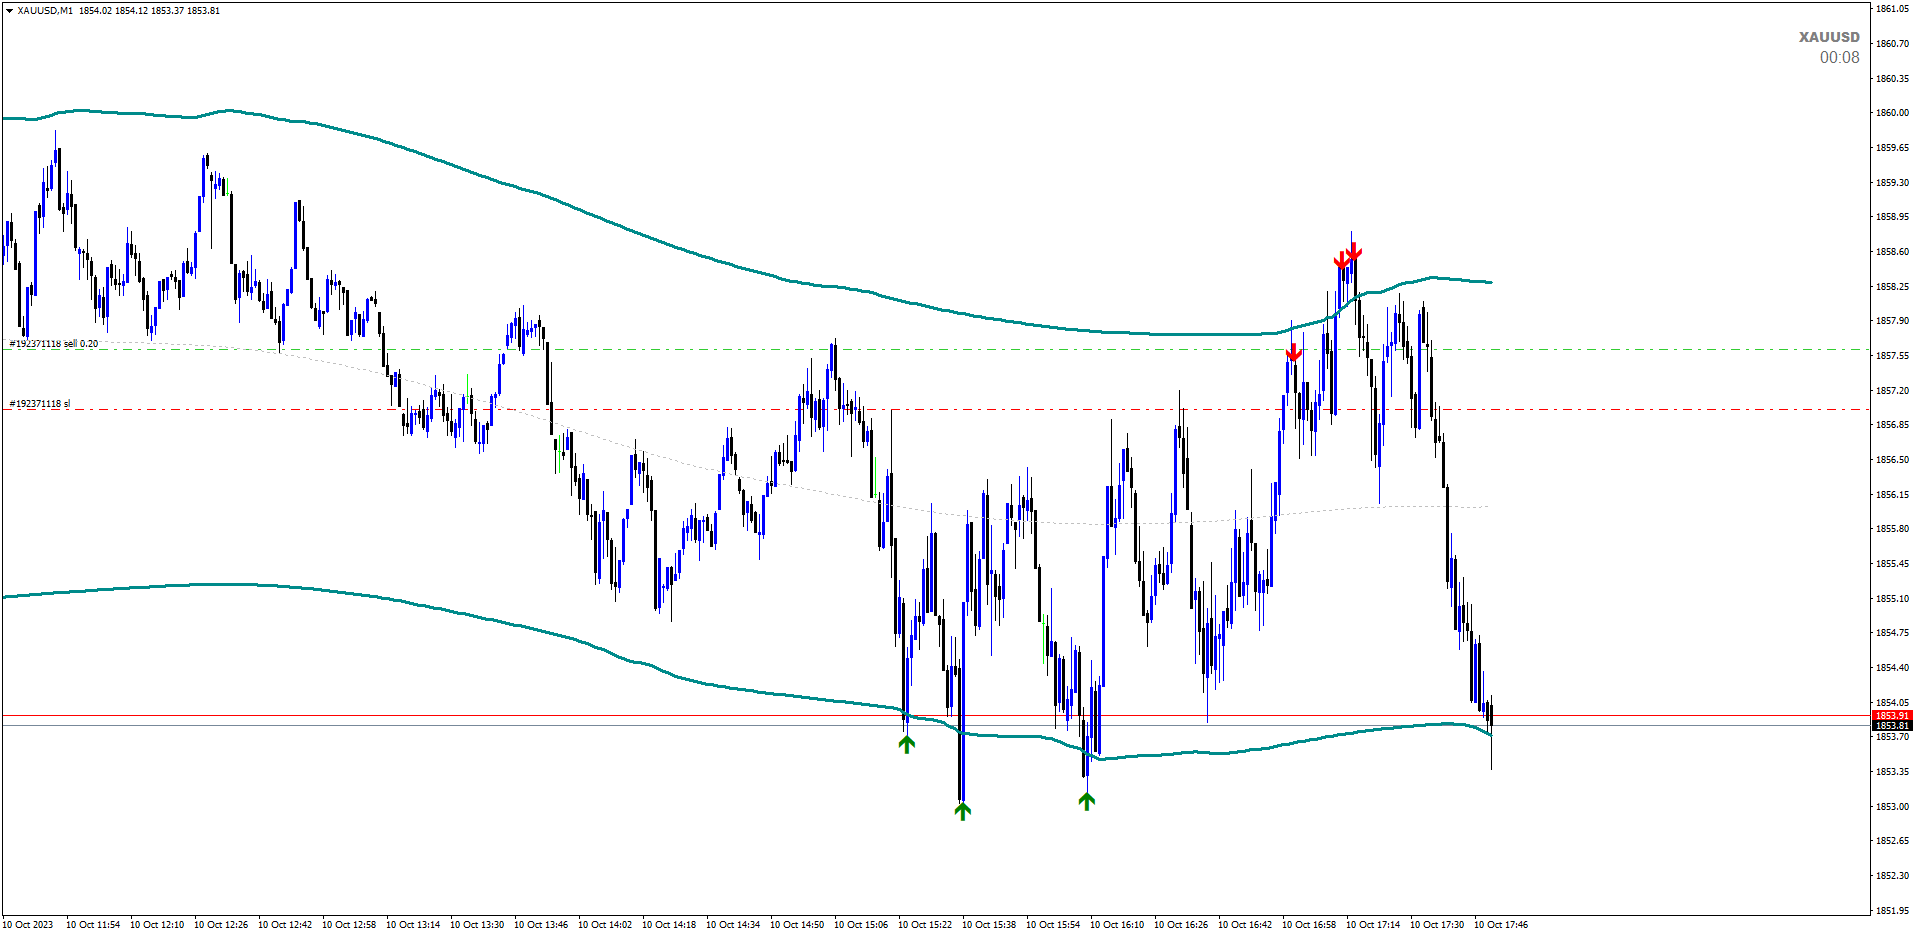
This indicator shows two outer lines, an inner line (retracement line) and an arrow sign, where the channel theory is to help identify overbought and oversold conditions in the market.
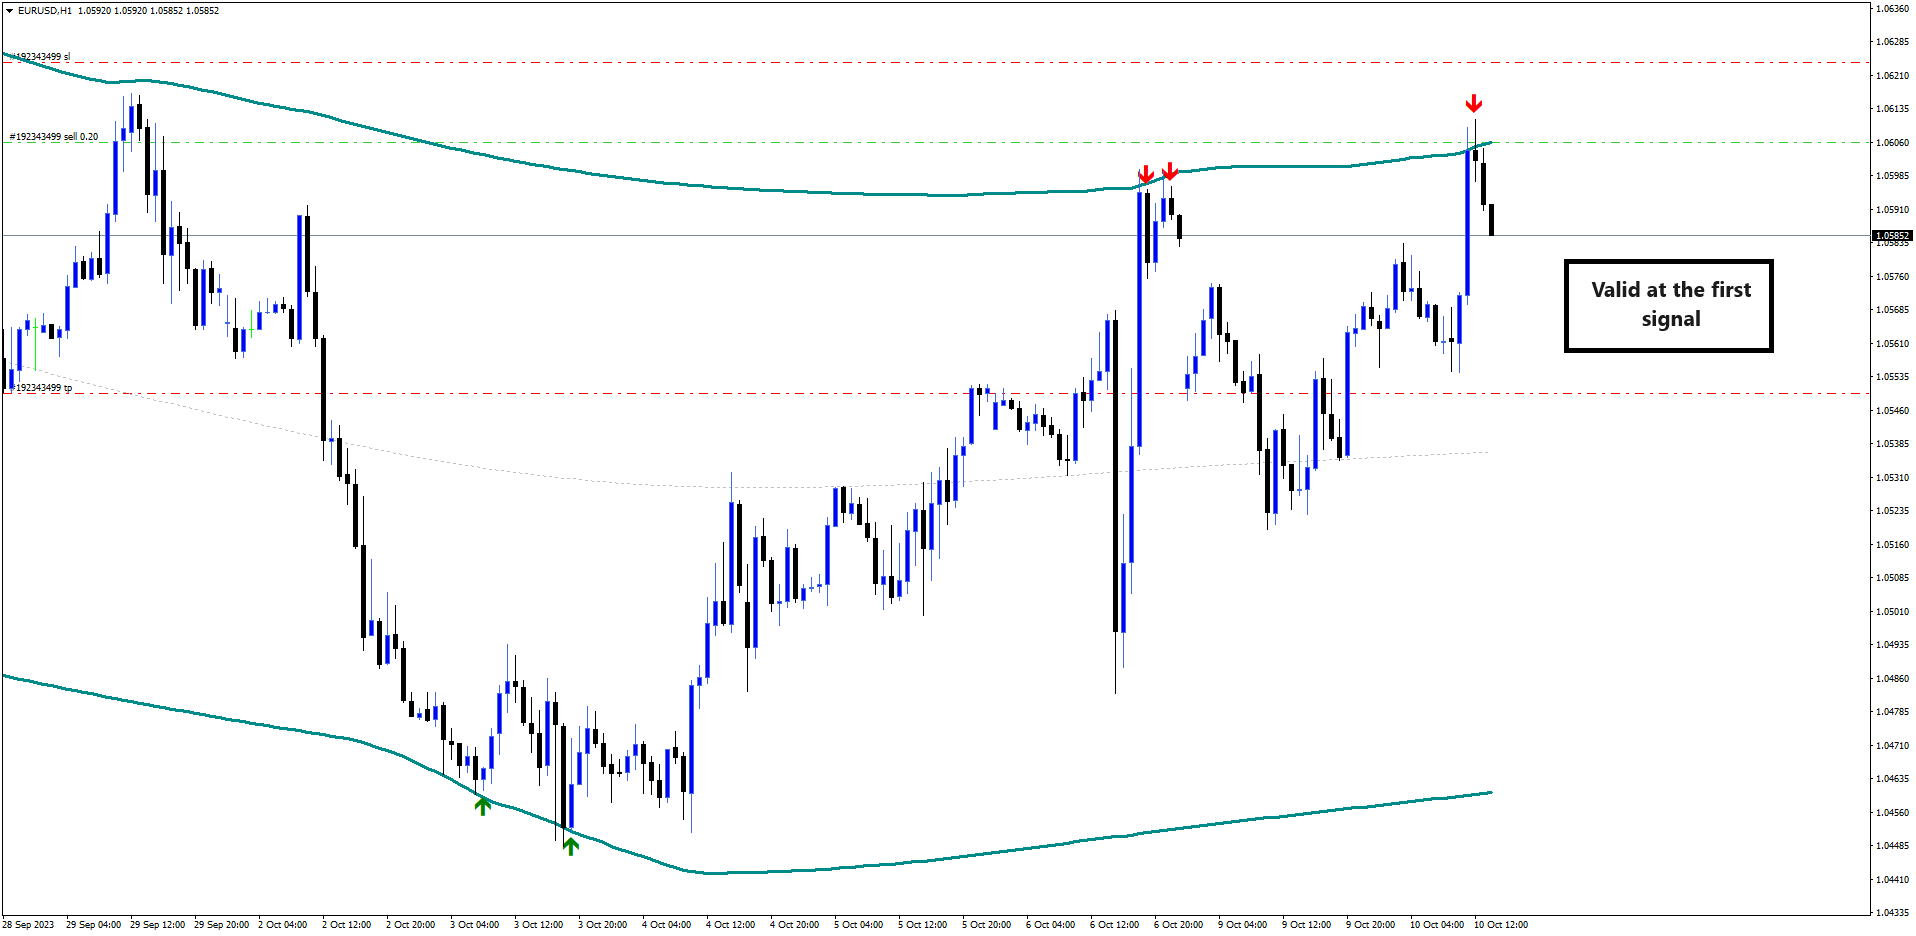
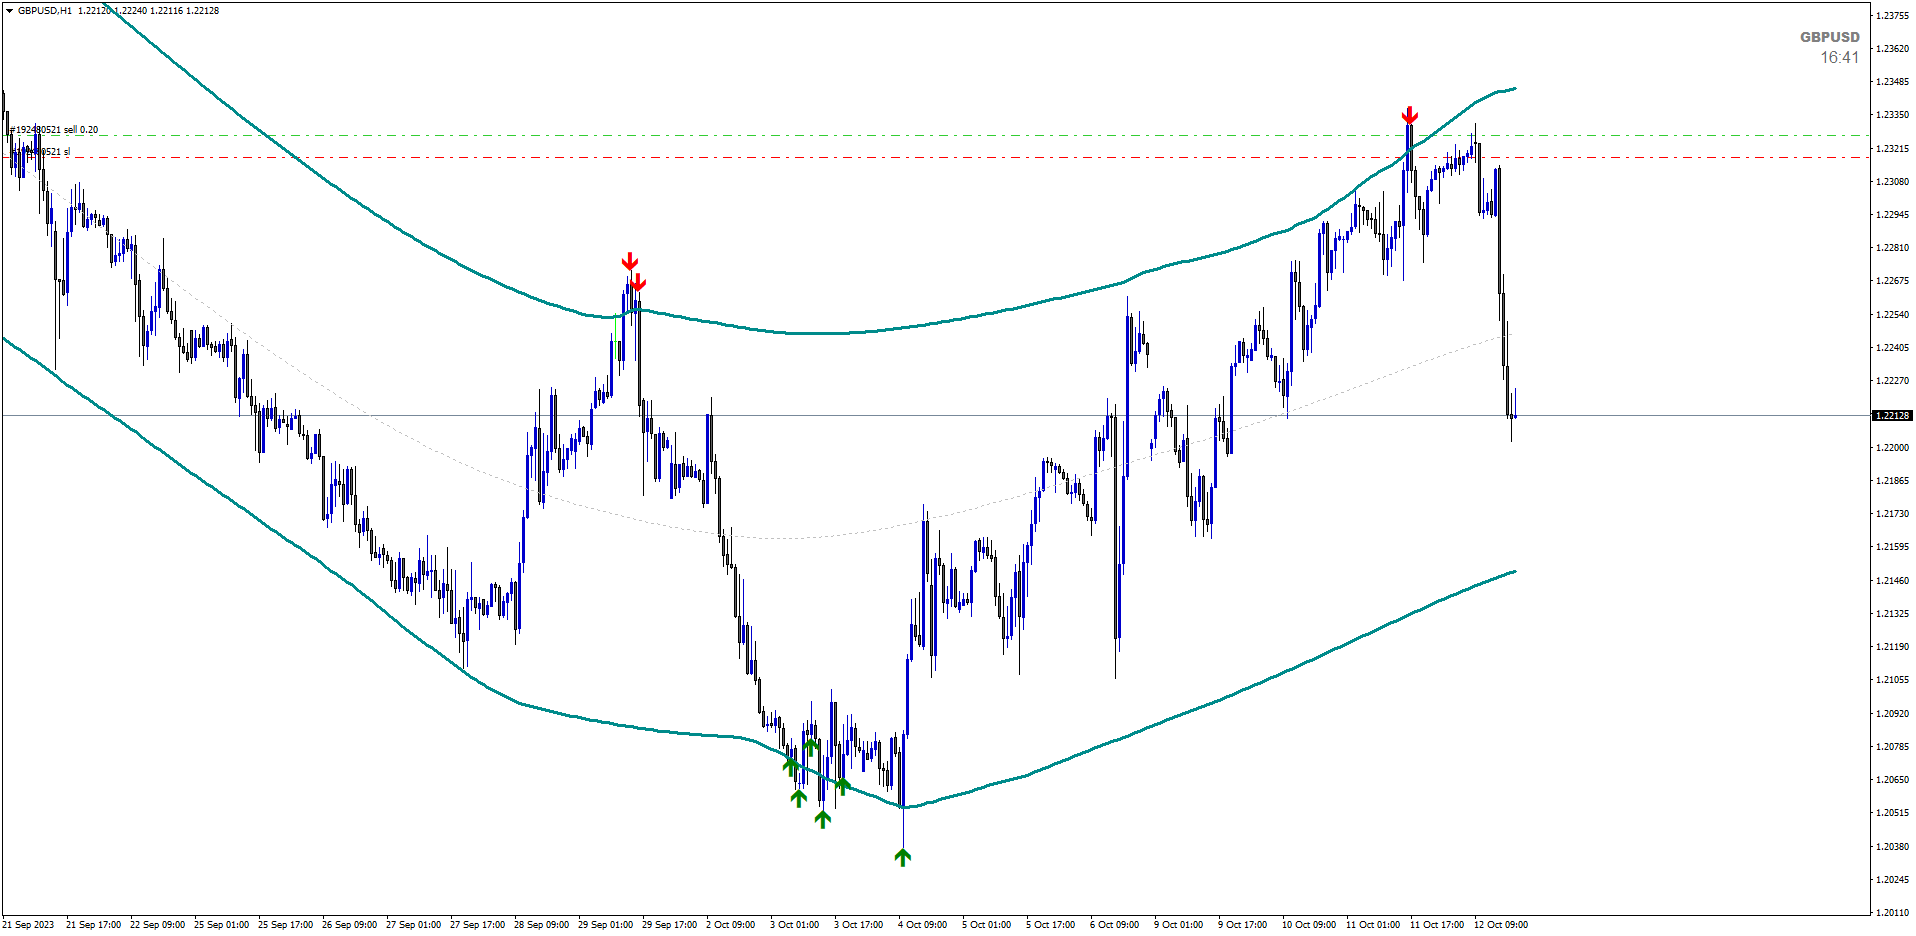
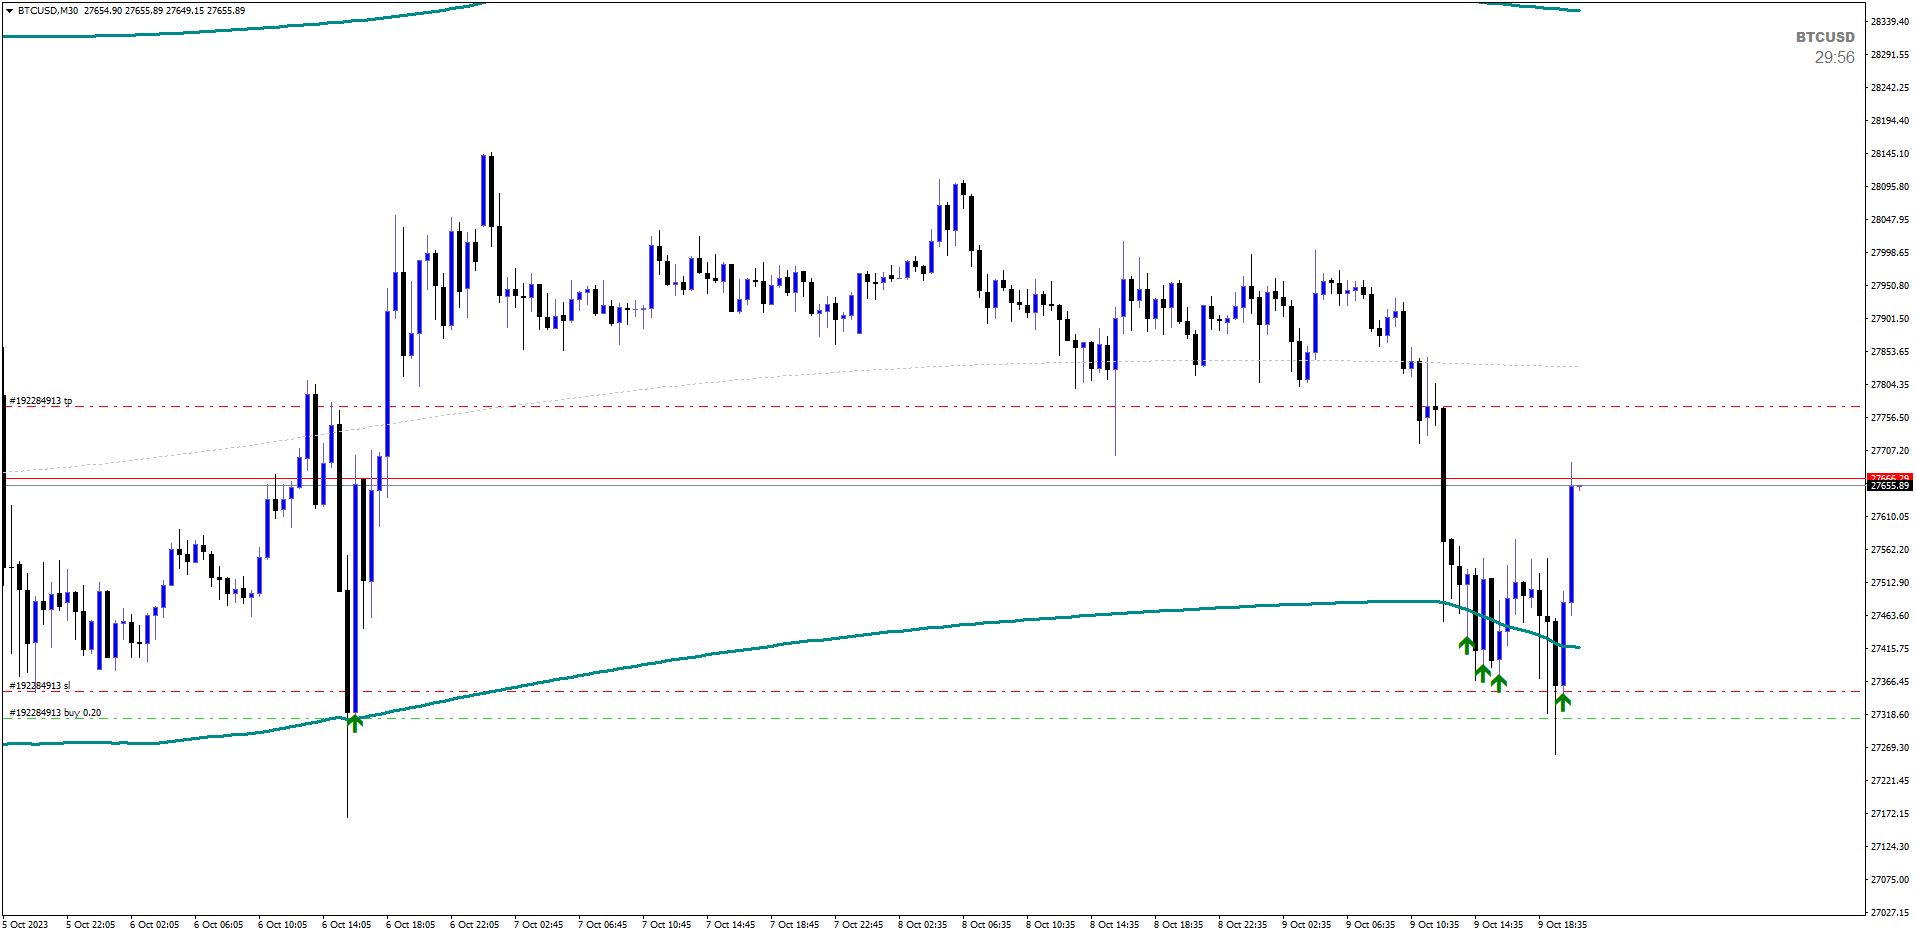
The market price will generally fall between the boundaries of the channel. If prices touch or move outside the channel, it's a trading opportunity.
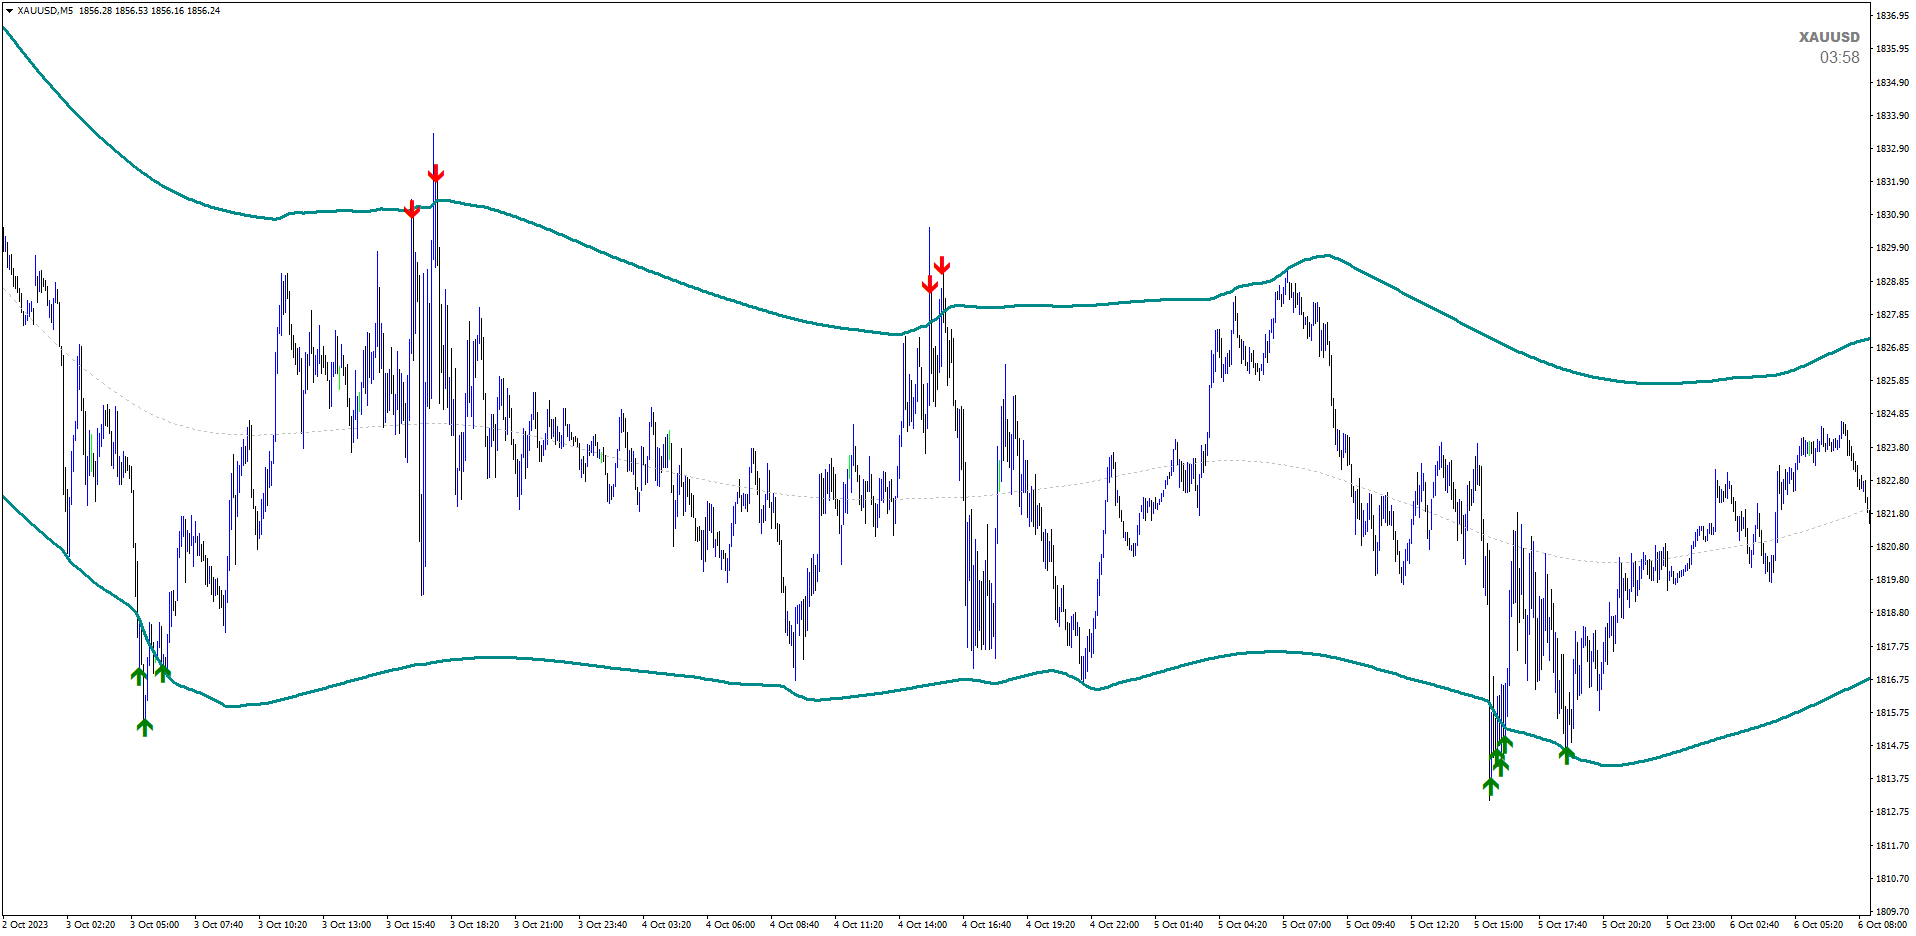
The indicator gives you a signal on a possible reversal. When the price is close to the upper line, the market is considered overbought, when it is close to the lower line, it is considered oversold.
It's a ready-to-use trading system for trading any instrument.
This tool simplifies the analysis of financial markets and proves to be the trader's right-hand man.
ECM Elite Channel is a visual and intuitive tool that is easy to understand and use.
Information
Using the channel:
M1/M5 (Scalping/more opportunities/more noise)
M5 (Scalping/day trading)
M15/M30/H1 (best windows M30/H1 more precision )
H4/D1 (long negotiations/swing trade)
PS: Leave your comments and rating
Good negotiations!
Author
Paulo Rocha all rights reserved
ユーザーは評価に対して何もコメントを残しませんでした