VFlow Trading System
- インディケータ
- Thiago Duarte
- バージョン: 1.0
- アクティベーション: 5
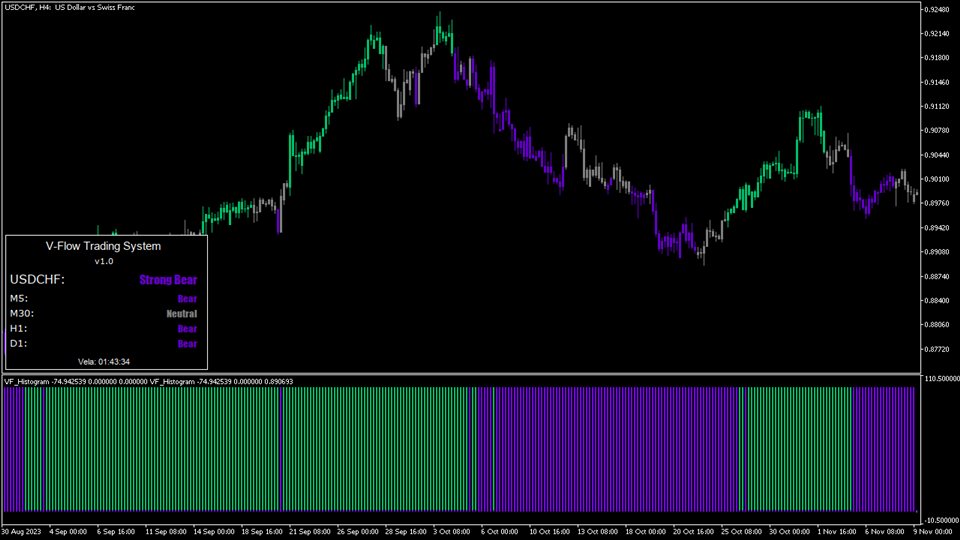
V-Flow is a Trading System that takes into account volume, flow and other factors to give a signal when to enter, hold and close a position.
There are two trading modes: conservative and aggressive.
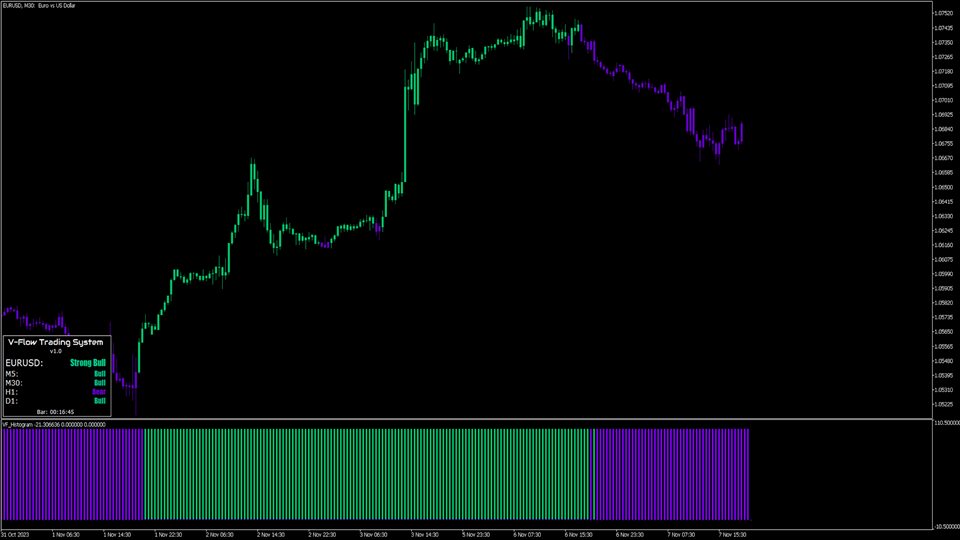
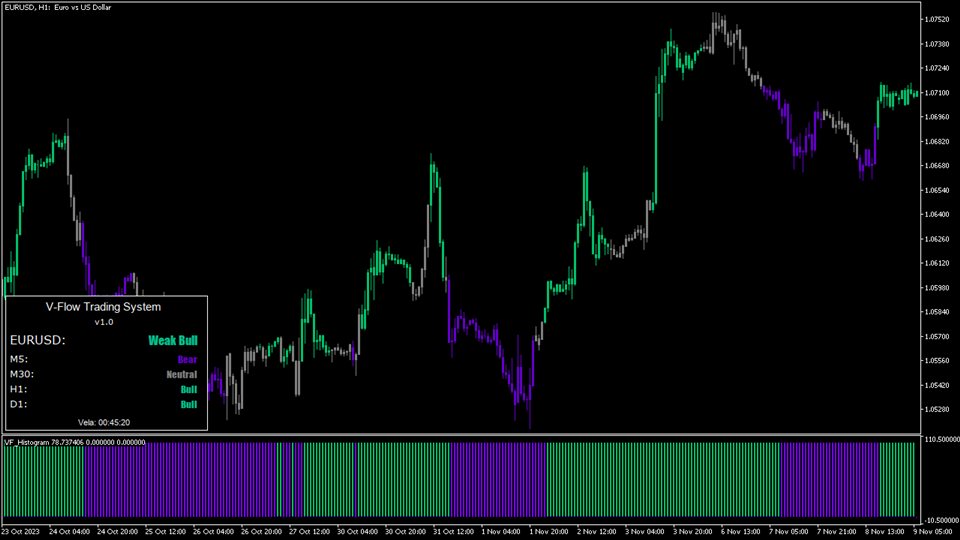
CONSERVATIVE: In this mode, the system shows you when to trade by painting the graph according to the signal (buy or sell). After that, when the trend ends, the graph turns gray, indicating the time to exit the operation. However, if the histogram at the bottom still points to the same trend, it is up to you to remain in the trade.
AGGRESSIVE: Unlike the conservative mode, the aggressive mode does not display the trend without strength, but only bullish or bearish. Therefore, you will only see buy or sell signals, always taking into account the histogram.
Description of Input Parameters
- Strategy
- Mode - conservative or aggressive strategy, as described above.
- Wait candle close - makes the system less aggressive by causing the signal to be issued only when the candle is closed.
- Histogram confirmation bar - causes the histogram to have a delay of one bar for the trend change, reducing false entries.
- Alerts
- Type - whether you want to activate alerts and what type of trend you want to be notified of (strong or weak or just one of the two).
- Trend end alert - warning when the trend ends (turns neutral) in conservative mode.
- Direction - alerts for both directions or only high or low.
- Push - notification to the MT5 mobile app.
- E-mail - notification also by e-mail.
- Visual dashboard
- Period 1 to 4 - Configures specific periods for monitoring in the visual panel, making the system Multi-Timeframe (or MTF).
- Others
- Bars for calculation - number of candles (bars) for calculating the indicator. The bigger it gets, the heavier it gets.
- Debug - Technical information for troubleshooting.
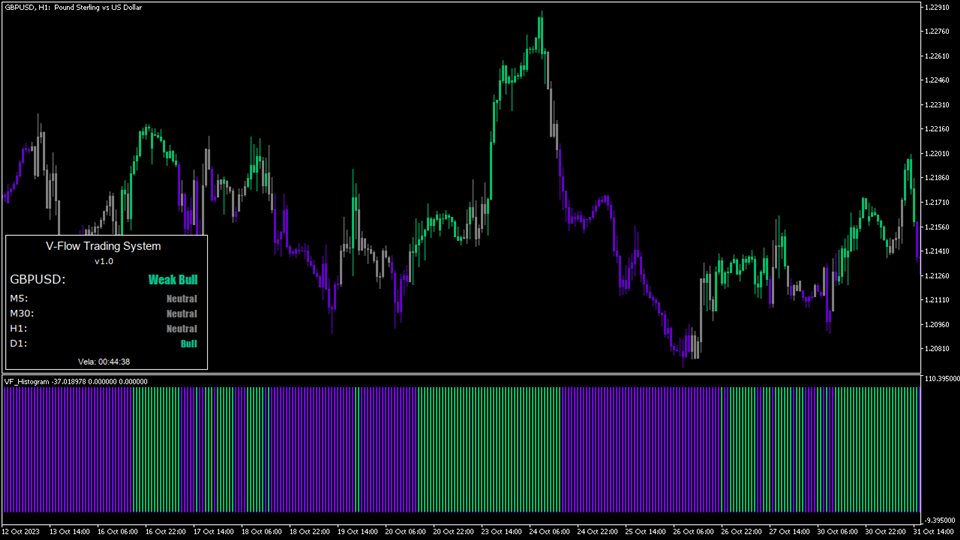
In addition to having the graph colored according to the trend and having the histogram at the bottom, you will also have an informative panel on the bottom left side of the graph. This panel informs the current asset and the trend state in the other 4 chart times, as well as their average. You can also view the remaining time of the current candle.
If you wish to purchase at a lower price, contact me on chat.
Enjoy it!
