Smart Market Structure Opportunity Scanner
- インディケータ
- Wen Rui Tan
- バージョン: 4.9
- アップデート済み: 20 9月 2024
- アクティベーション: 20
1. Updated usage descriptions in blog below:
https://www.mql5.com/en/blogs/post/760322
Smart Market Structure Trading System and Automatic Scanner - Trading Systems - 13 October 2023 - Traders' Blogs (mql5.com)
https://www.mql5.com/en/blogs/post/754495
2. YouTube video link for introduction: https://youtu.be/tMU04wo0bc8
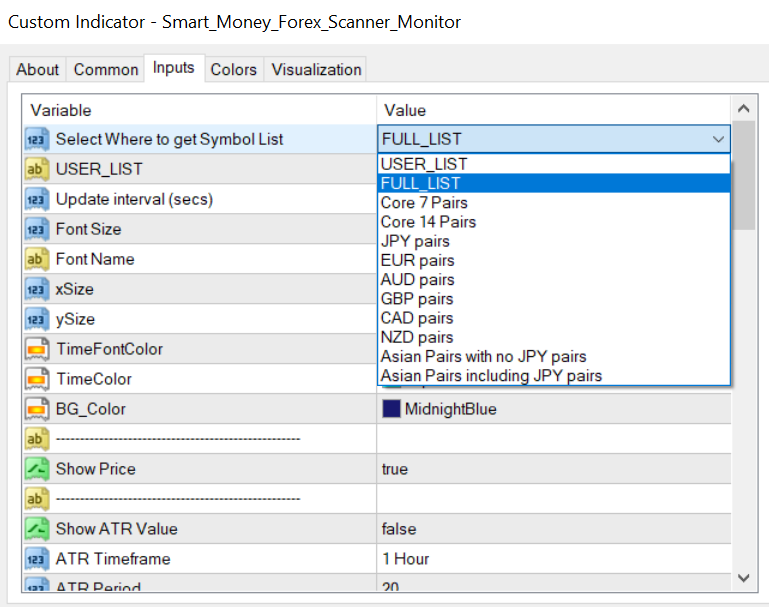
3. The Smart Market Structure Opportunity Scanner is a great tool to find trading entries and exits based on Smart Money
Concepts. It has a build-in custom choice of Forex pair lists to choose from for the scan, and it also has a user-defined
entry choice to put down your own list of Forex, Crypto, Index or any markets that you're interested in following to find
great opportunities for entries and exits.
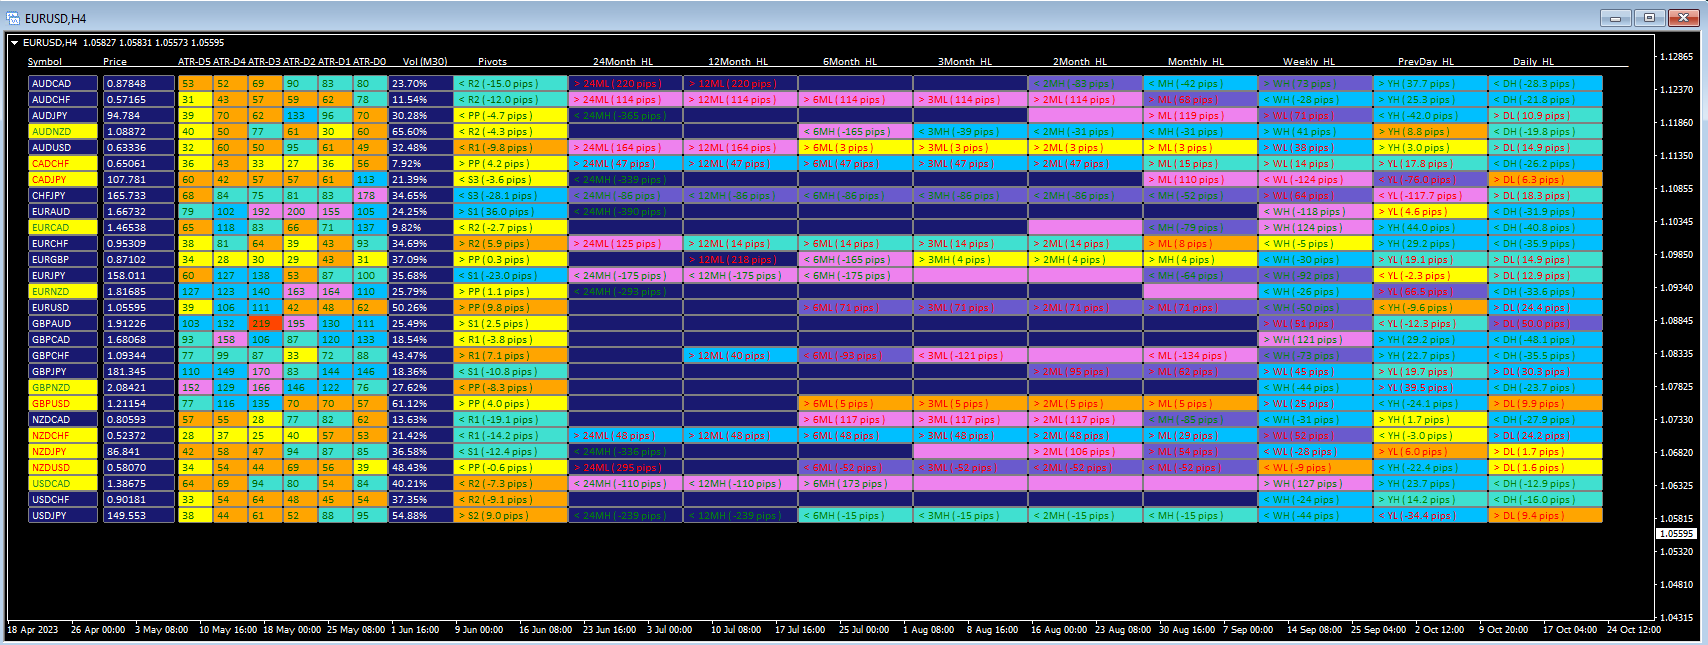
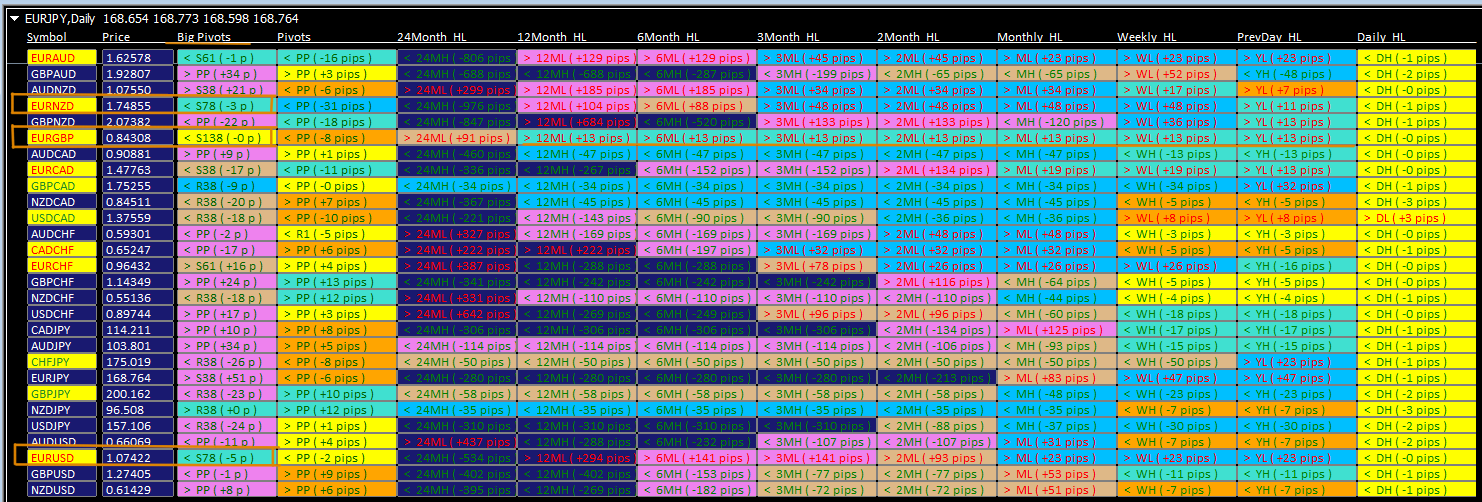
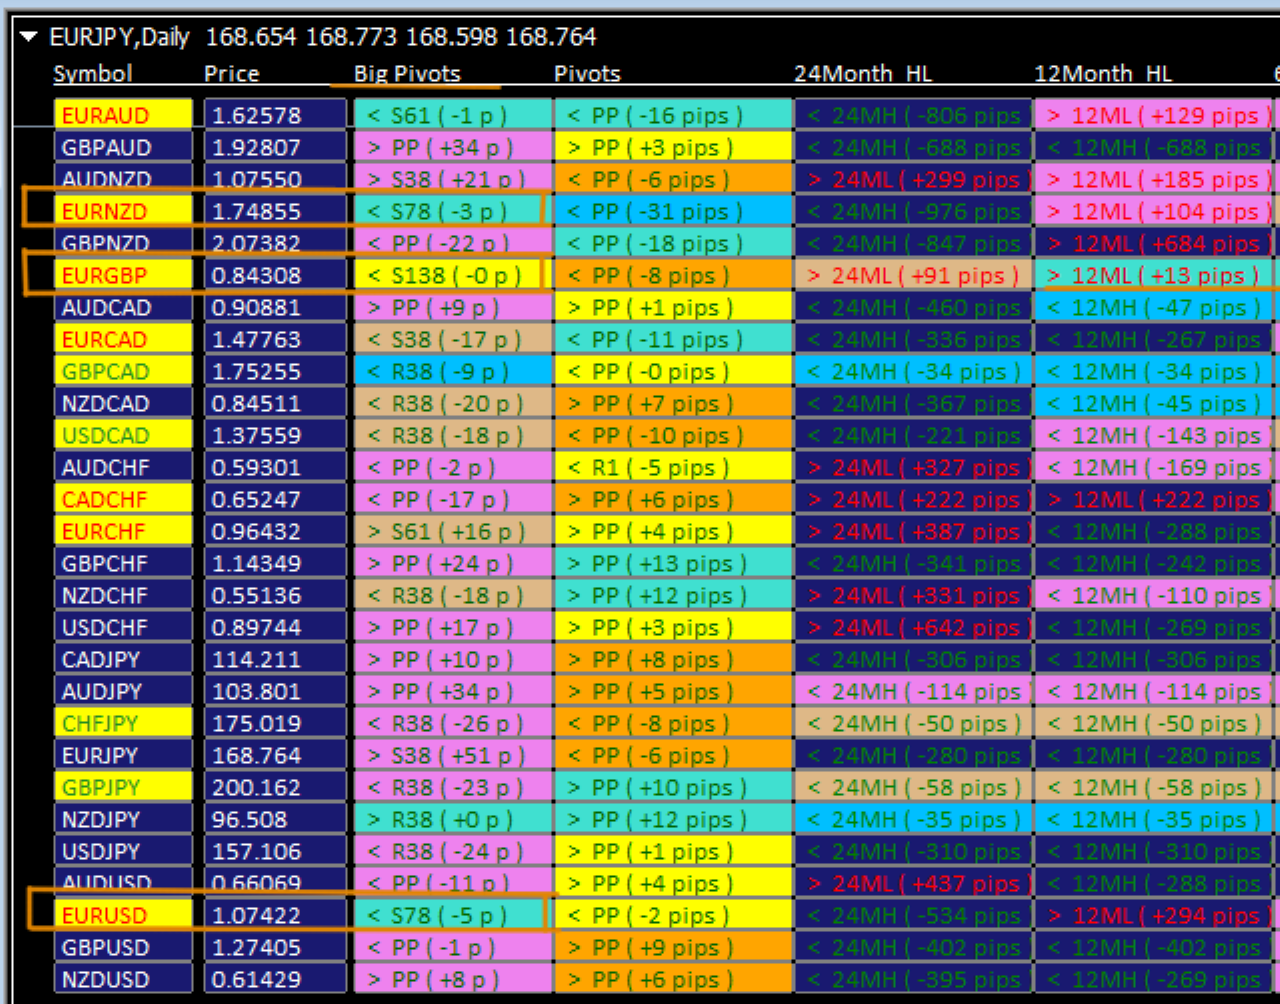
By default, it will scan the whole 28 list of forex pairs, and display in real time the Highest and Lowest values on Today,
Yesterday, the Week, the Month, 2 Months, 3 Months, 6 Months, 12 Months and 24 Months. And it displays the price
difference of current value of all forex pairs to those Highest/Lowest values, and shows the pip difference on a graphic
form in real time.
Based on the Smart Money Concepts, these important Higher Timeframe High and Low values are what smart money
(institutions) use for their entries and exits.
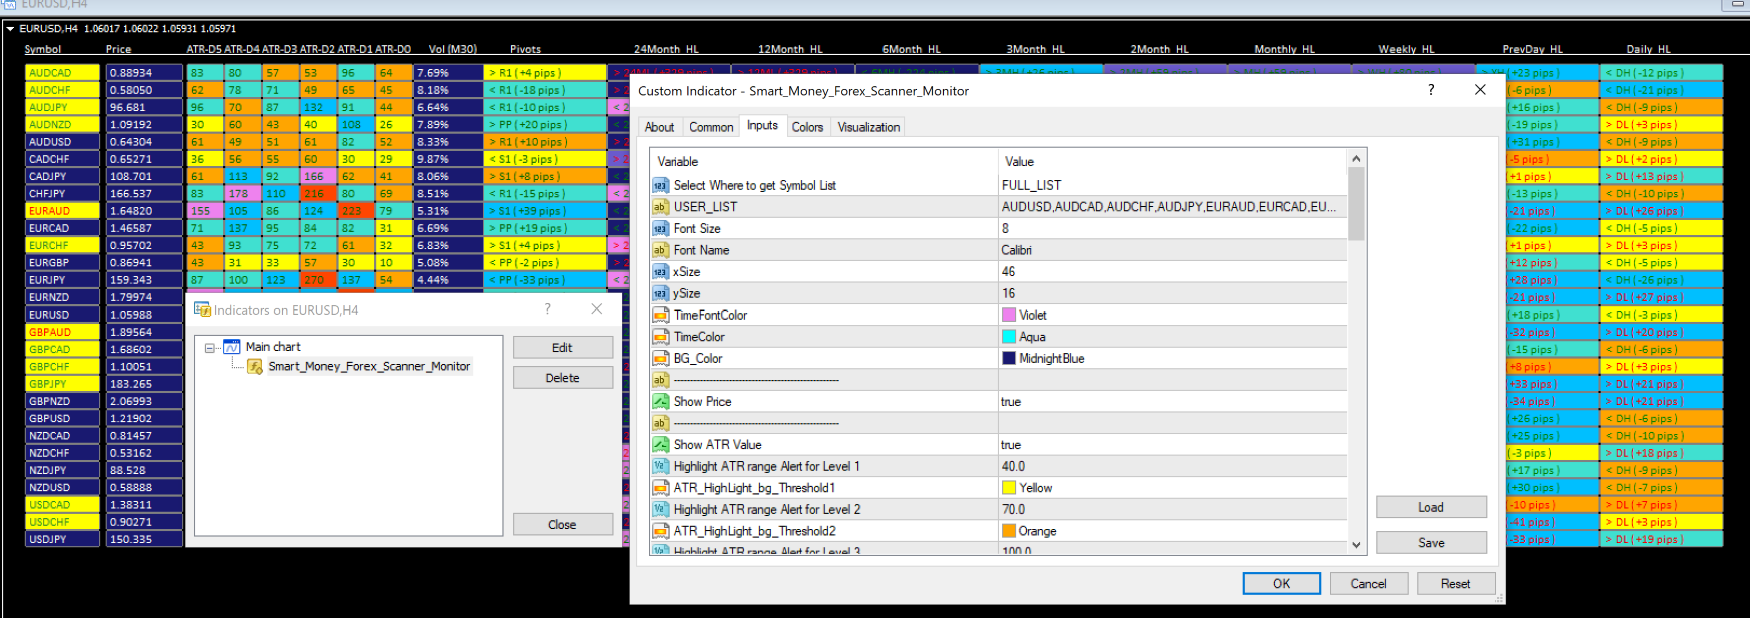
It also gives the user the option to choose and change the color settings, and alerts based on the pip difference levels.
For example, when we set the 30-pip difference on 2-month or 3-month charts, it will highlight all pairs that has <= 30
pip from its highest or lowest values of this time periods.
This way, there is no need to flipping charts of different pairs to find which pairs are closer to an important price level
and are at a prime time for entry. It will help greatly to find low-risk opportunities to trade, and not have to wait for
days or weeks before an opportunity is ready, no matter what your trading timeframe is.
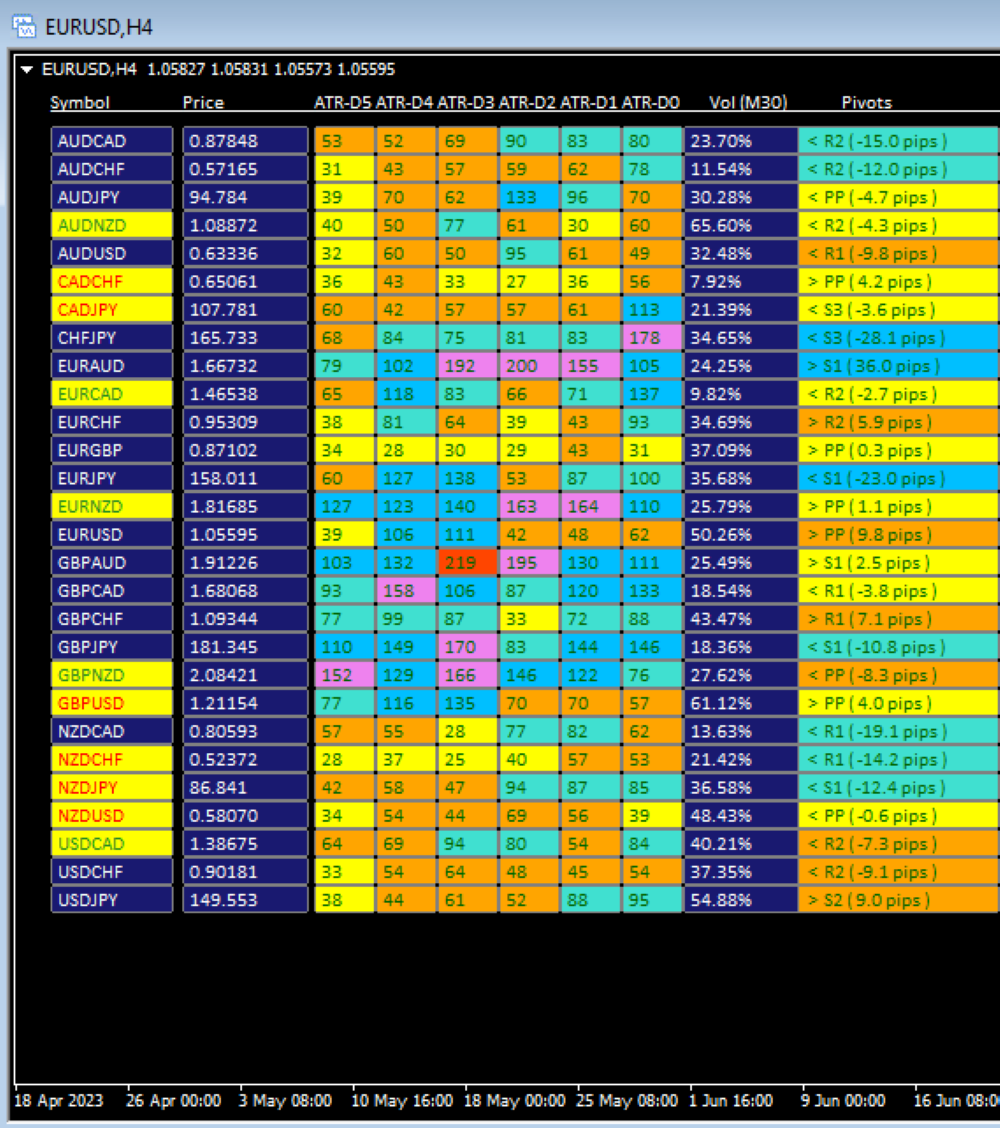
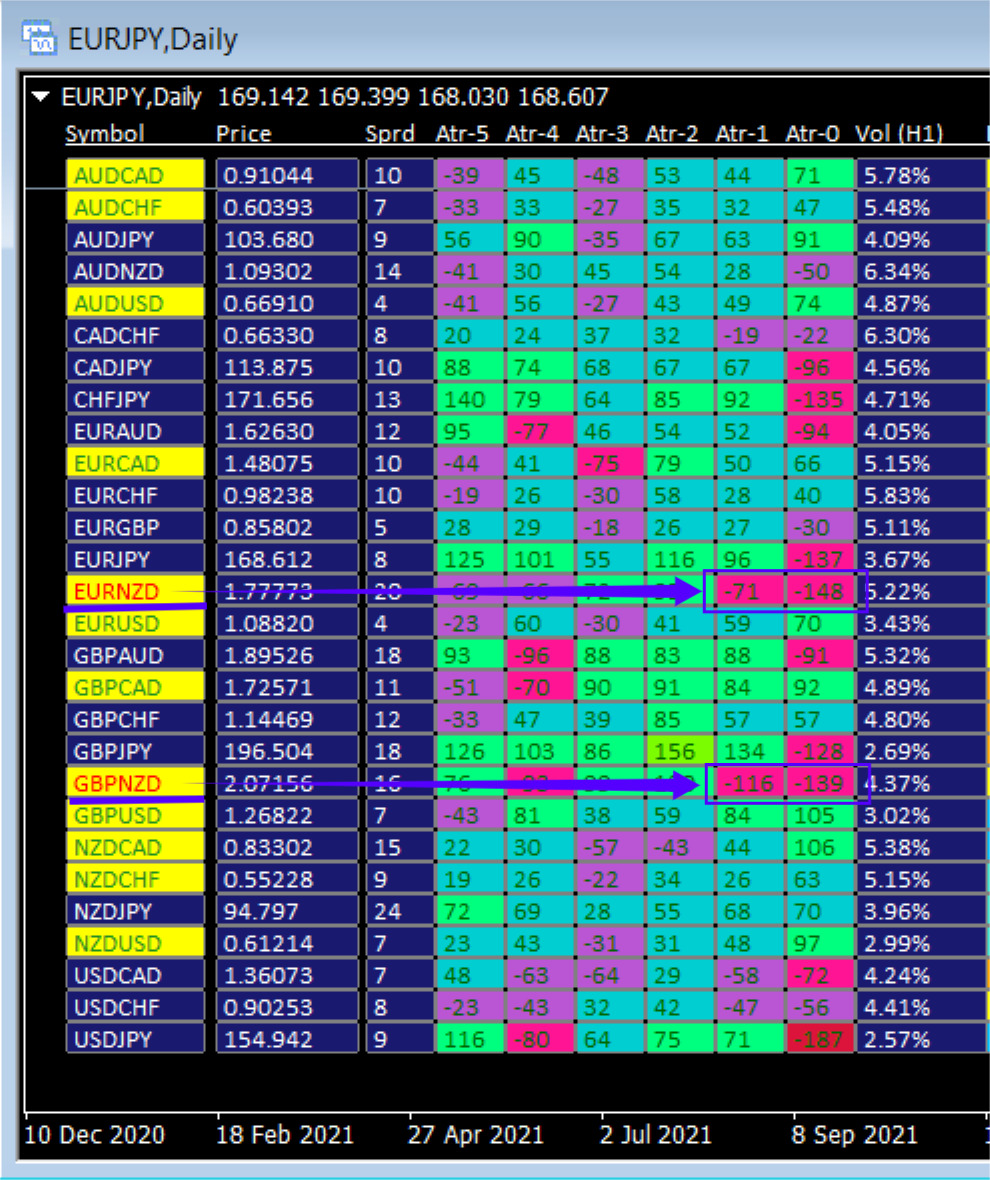
- Columns for 6 days of ATR ( Average True Range ) for the whole week, plus one day. We could see the maximum price
movements for each day for the last 6 trading days for all pairs. It can help us pinpoint the pairs that were consolidating
in the last few days and would have big impulse move soon. It can also help us pinpoint the pairs that have just finished
big impulse moves and may reverse soon.
- 6 color settings for 6 custom levels of ATR ( for example, to set the color to yellow when ATR is less than 30 pips in one
day, or set the color to OrangeRed when ATR is greater than 200 pips in one day. ) The best part is you can decide the
pip distance levels in the input screen for your own specific trading needs.
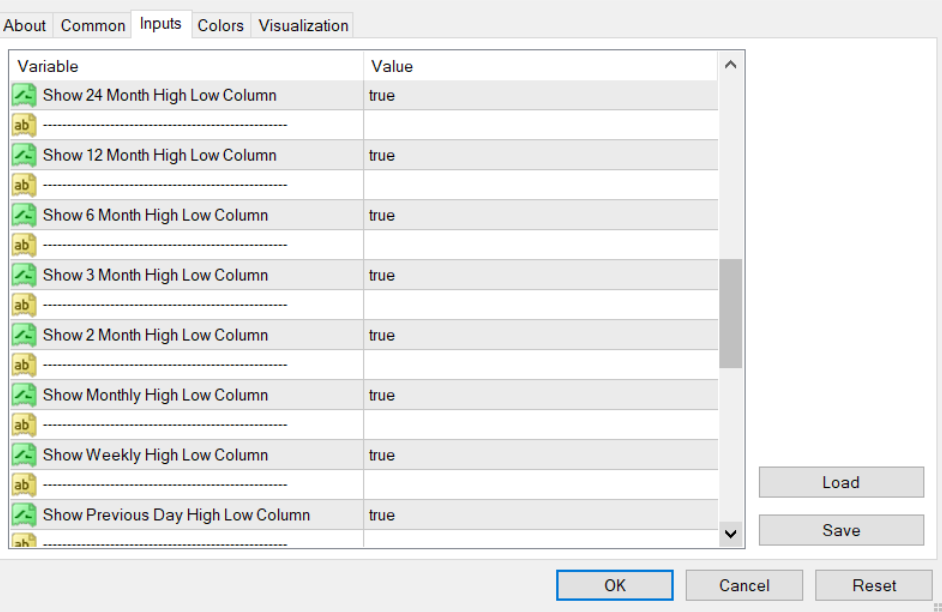
- 6 color settings for 6 custom levels of Higher-Level Highs and Lows. ( for example, to set the color to yellow when
current price is less than 5 pips to a higher-level High/Low, or set the color to Violet when current price is in between
100 pips and 200 pips to a Higher-level High/Low. ) You can choose the pip distance in the input screen to fine-tune the
level you want to be noticed about.
- For example, I have pre-set the pip distance to 5 pips for yellow color for Yesterday's High/Low, Today's High/Low, and
Pivot columns. It'll be so easy to pick up the most accurate Double tops and Double bottoms for day-trading with the 5-pip
setting, as color Yellow would highlight all the pairs in real time when price approaches Yesterday's High/Low, and Today's
High/Low. It's just one example on how to take advantage of the vast calculating power for a day trader, to get the most
accurate entry price without waiting anxiously for a long time for price to get to these levels that Smart Money uses for
reversals on the daily basis.
- With pivots, you can even set the pip distance to 1 or 2 pips to be notified with the color settings you prefer, and trade
from one pivot level to another pivot level. This one tip alone, would provide countless opportunities for day trading based
on price move in between pivots for all forex pairs. With one glance over the table, you'll see which pair is only 1 or 2 pip
away from a major pivot level and may reverse from there imminently. It's just a great tool to find super accurate entry
opportunities without much waiting. And super accurate entry point is more than half of the battle for trading success!
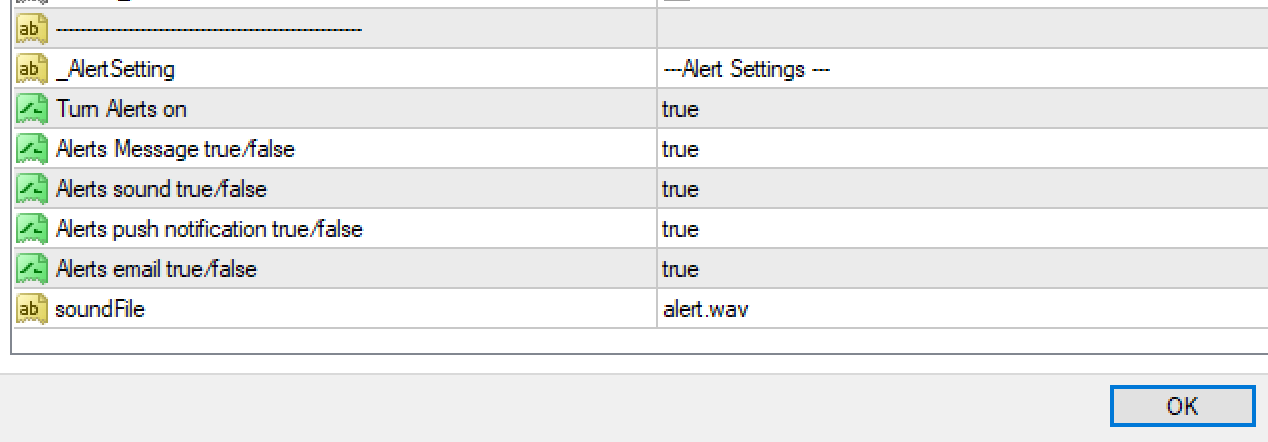
- Alert function options for all signals, including Alert Messages on MT4 desktop app, push notification to mobile phone MT4
app, sound notifications, and email notifications.
- The ability to write all signals to an output file under MQL4/File directory. So users would have the luxury to examine
today's signals at ease anytime, and prepare for his/her next trade.
- All signals ( pip distance to significant levels ) can be customized at the input screen.
- The display panel would show all the pip distances for all pairs and for all the Higher Level High/Lows. So user can decide
to trade into the HTF High/Low level with the trend direction, or wait for reversal when current price gets close to these
levels. One more option for the trader to decide based on his/her own preference.
4. Big Pivots ( Weekly Pivot Points and Monthly Pivot Points ) has been added in the newer version. The detailed description
is in the other product I have called "Higher TimeFrame Pivots Scanner". All explanations and usages are described there.
Since weekly pivot levels don't change quickly( unlike the daily pivot points, or indicators that keep changing their values ),
when price cross one of these extreme levels, it has a much higher probability of reversal. That's where accurate entries
can be located for very low risk.
-------------------------------------------------------------------------------------------------------------------------------------------------------


Must have if you trade high/lows. Very positive attitude from seller is huge plus.