バージョン 3.0
2025.02.19
The indicator has been completely rewritten.
All functions are displayed as buttons on the chart, ensuring quick responsiveness during trading. The right tool at the right moment.
Second and third deviations have been added.
Volume analysis has been added.
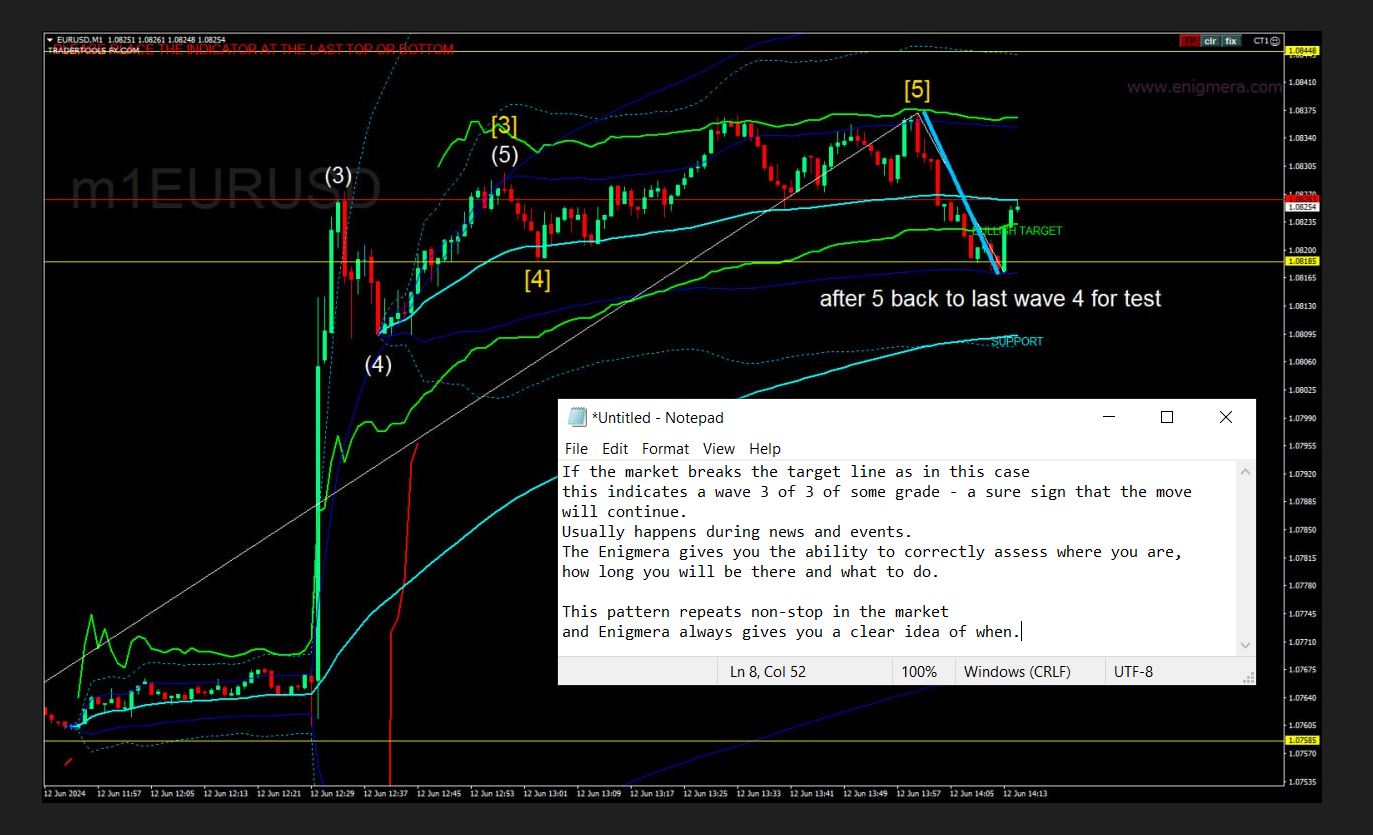
A signal when the target line is reached.
Automatic color change of the indicator, resulting in new themes being applied automatically.
バージョン 2.60
2025.01.12
Version 2.60
In the new version, the indicator automatically assigns the next identifier number. This allows you to add as many indicators as you want to your charts without mixing the buffers of individual indicators, ensuring the indicator's position remains unaffected. Previously, this was done manually.
バージョン 2.50
2025.01.04
Good new functionality added.
1. First bullish and and first bearish deviation lines
The first deviation line in Enigmerа refers to measuring the deviation of the price from its average value, that is, how much the price has deviated from the support line.
High deviation indicates high volatility, while low deviation indicates stability.
Traders use this information to determine entry and exit points. For example, in high volatility, breakout strategies can be applied, while in low volatility – range trading strategies.
Sensitivity to Anomalies: Single sharp movements can distort the calculation of deviation.
2. Support channel of two additional optional support lines (a bearish and bullish)
バージョン 2.40
2024.12.26
Two new lines added to Enigmera in ver. 2.4
These are the first bullish and bearish deviations of the support line.
If the price primarily moves between the Enigmera line and its 45 deg lines, the market is in consolidation or sideways movement, which does not indicate a clear trend.
What is the difference between 45 deg line and Single deviation line?
45 deg lines defines the trend. If below non-sustainable, if over strong, if alongside the 45 deg line - sustainable.
Deviation line defines the acceptable distance whithin we consider lack of trend.
Outside the first devition is a trend sign, and it is simply because the market reached a new land.
The first standard deviation often acts as a boundary for normal price fluctuations around this average value.
バージョン 2.30
2024.10.07
- Bugs removed.
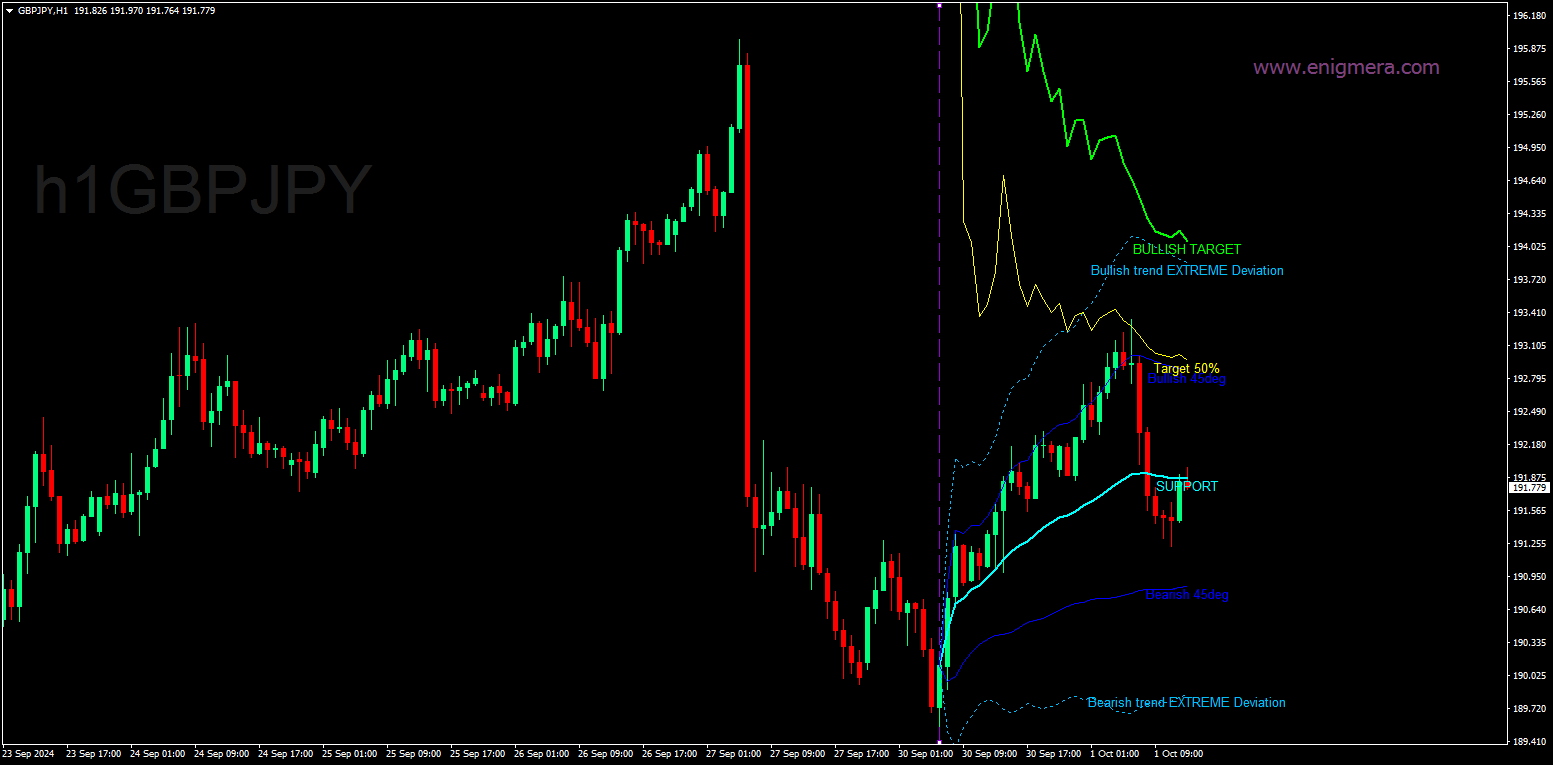
- 50% target line added. Be default is off.
- Non-Enigmera functionality removed.
Generally better performance.
バージョン 2.24
2024.08.06
More friendly labels.
バージョン 2.23
2024.06.18
The update is quite important. The convenience is undeniable:
- Just add the indicator to the chart. It is no longer necessary to enter the date and time.
- Putting a top or bottom is done by pulling and dragging the indicator.
- Reestimation of the trend is much more faster.
Enjoy!
バージョン 2.1
2024.06.09
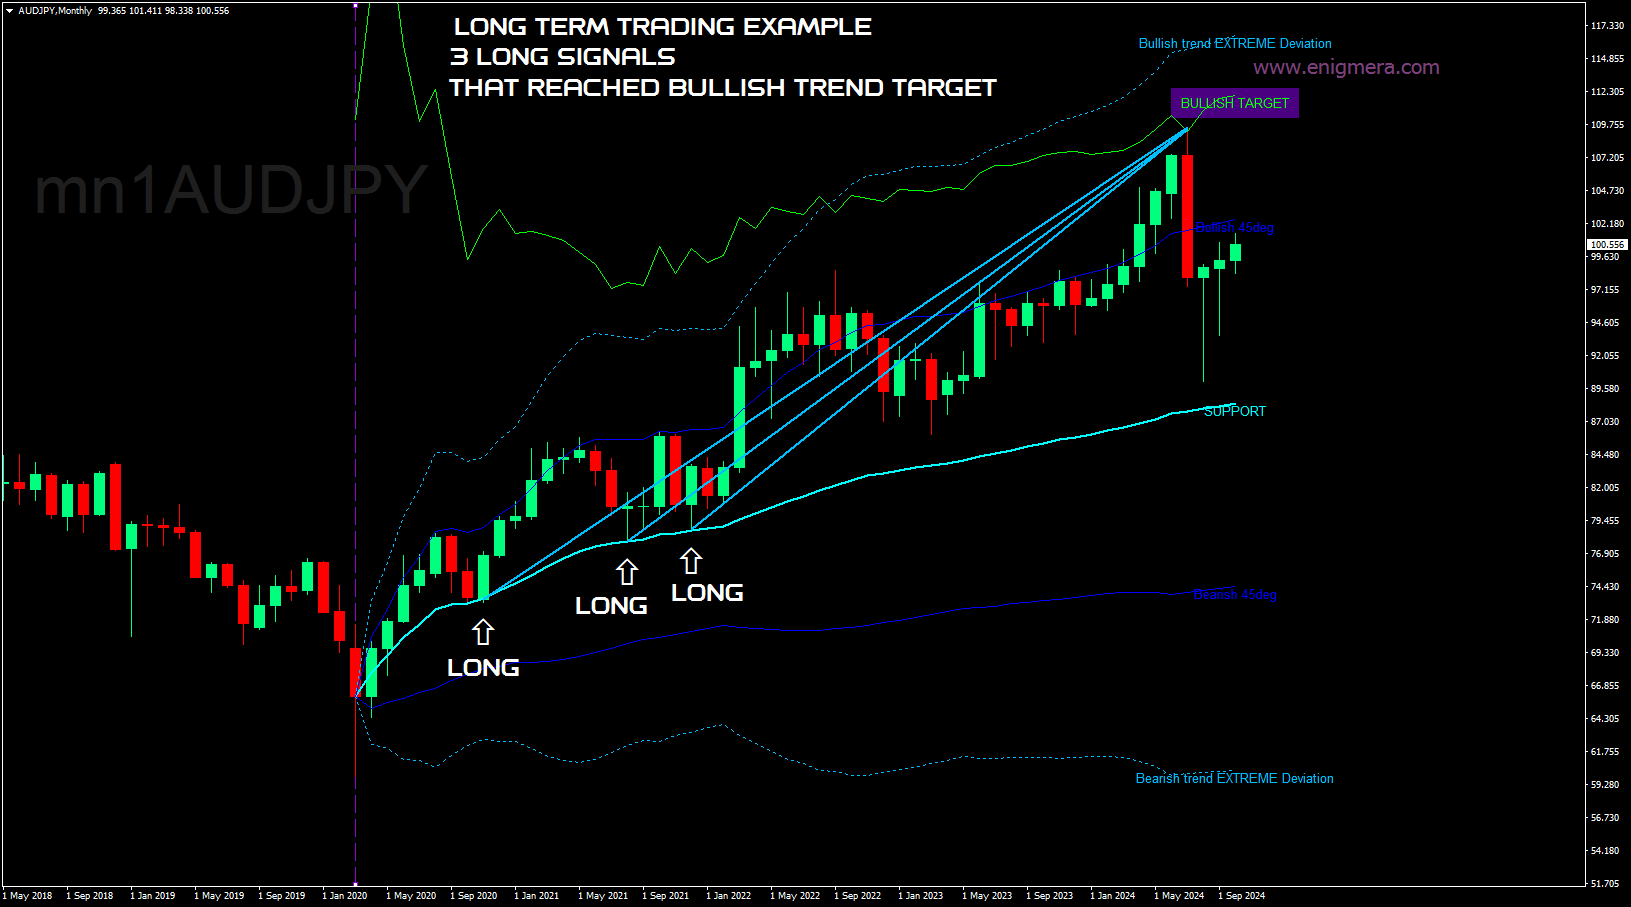
- Warning when target is reached
- Line labels added. On/Off option
- Warning if indicator is not placed correctly
- Indicator identifier (when using more than one indicator on a graphic)
バージョン 2.0
2024.06.02
1. エリオット・チャネルを追加。エリオット・チャネルに任意の時間枠を使用できるようになりました。デフォルトは4時間足です。これでカウントが簡単になります。
2. オートフィボナッチタイムゾーンを追加しました。これもカウントを容易にします。
3. オート50%ラインを追加しました。どのレベルの動きにも有効です。
4. インジケータが計算するローソク足の数を制限するオプションがあります。デフォルトは377本です。この数は、ほとんどの動きを測定するのに十分です。あなたのアイデア次第で変更できます。
5. 5.高時間枠から低時間枠へ移動する際の、大量のフラクタル計算による無反応が解消 されました。もはや問題はありません。
6. コードの最適化によりパフォーマンスが向上しました。
7. 色と線のオプションを追加。
8. 識別子を追加。インジケータをチャート上で複数回使用したい場合は、インスタンスごとに新しい識別子を使用するのがよいでしょう。こうすることで、インジケータはインスタンスごとに異なるバッファを使用します。
9. インターフェイスの一部変更。ターゲットラインを太字にし、より重要性を高め、注意を引くようにしました。
バージョン 1.3
2024.01.05
新バージョンでは以下のものが追加された。
トレンド測定器が追加されました:
- 角度45度線
- 偏差45度線


a very good indicator that composes all in one, entry, exit and reverse. Great!