CandlesPeriodMT5
//--- input parameters
input ENUM_TIMEFRAMES InpPeriod = PERIOD_D1; // Period
input int InpBandsShift = 15; // Shift
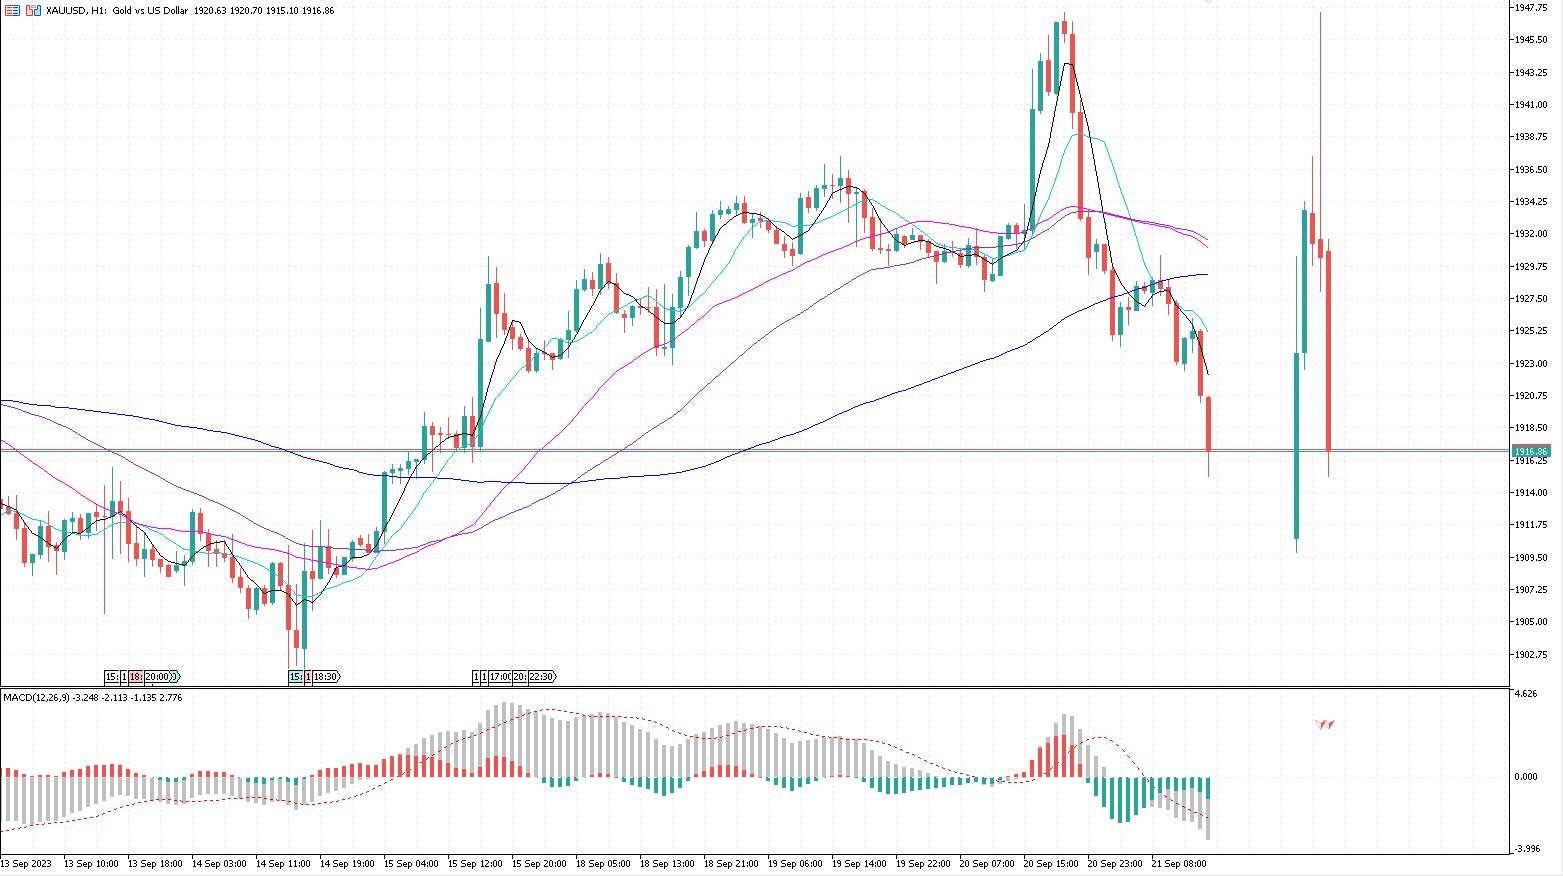
アイコンに他の任意の周期のろうそく図の終線を表示する指標で、市場の動きを効率的に分析することができ、より効果的で、より簡潔で、より直感的である。
ご購入とご利用に感謝します。より良いアドバイスがありましたら、コメントエリアにコメントしてください。私は最初に返事をします。ここであなたが市場で十分なお金を稼いだことをお祝いします。
アイコンに他の任意の周期のろうそく図の終線を表示する指標で、市場の動きを効率的に分析することができ、より効果的で、より簡潔で、より直感的である。
ご購入とご利用に感謝します。より良いアドバイスがありましたら、コメントエリアにコメントしてください。私は最初に返事をします。ここであなたが市場で十分なお金を稼いだことをお祝いします。