Scalper Terminal X30
- インディケータ
- Kenan Ozkarakas
- バージョン: 1.0
- アクティベーション: 7
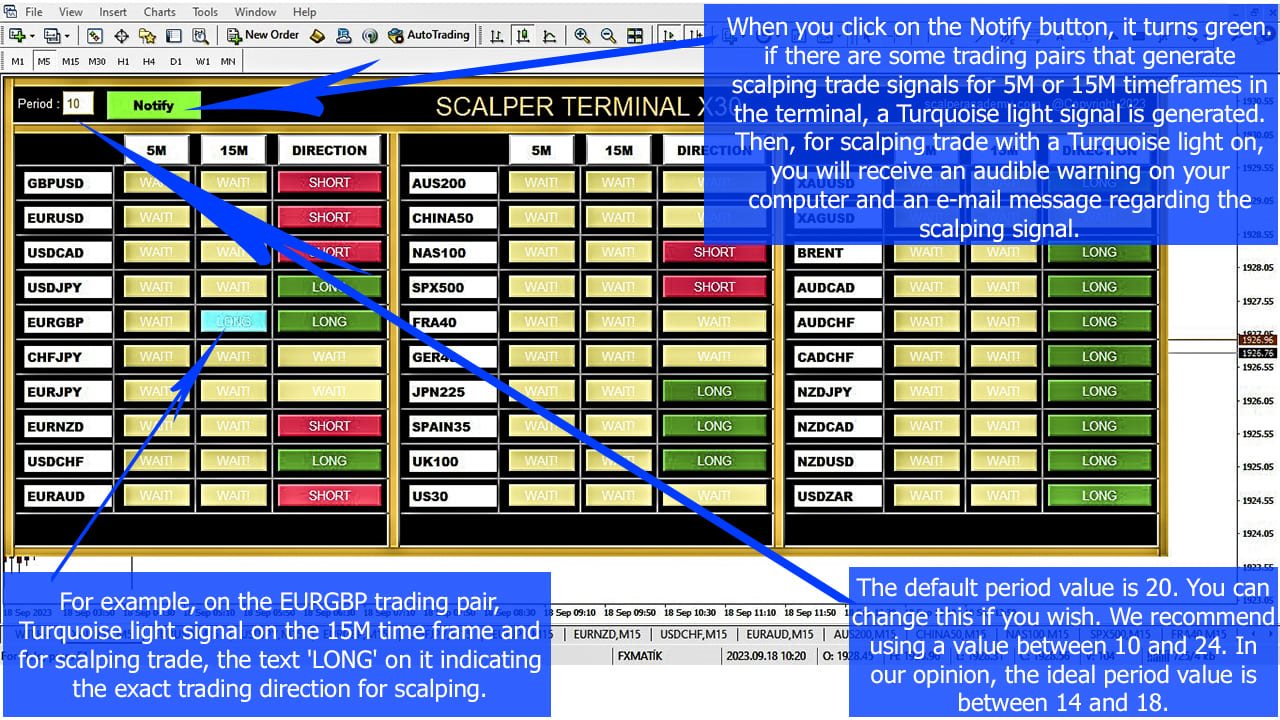
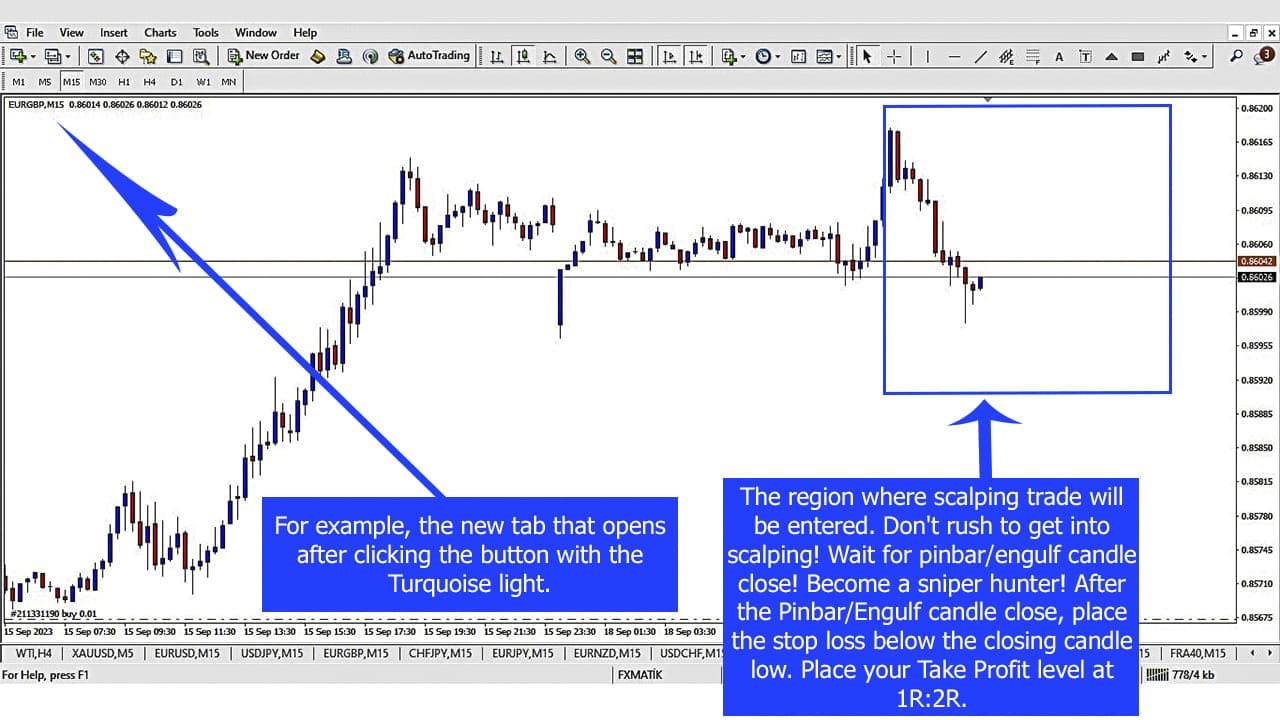
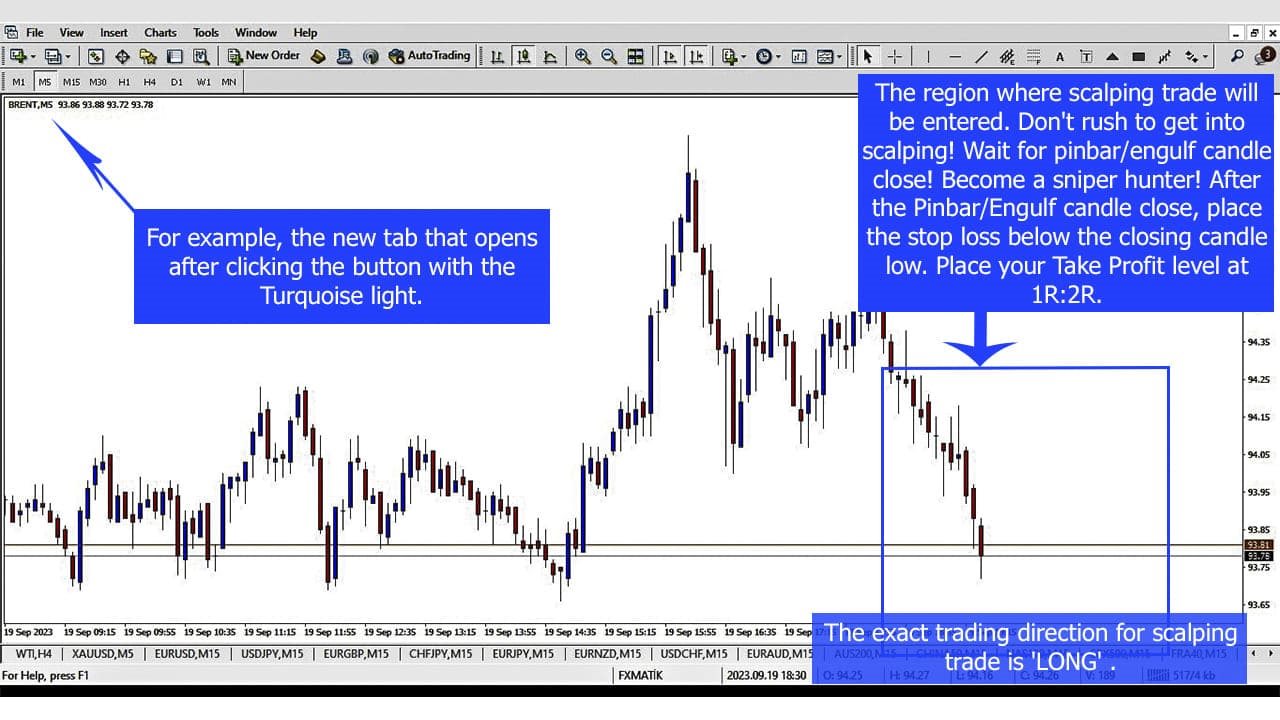
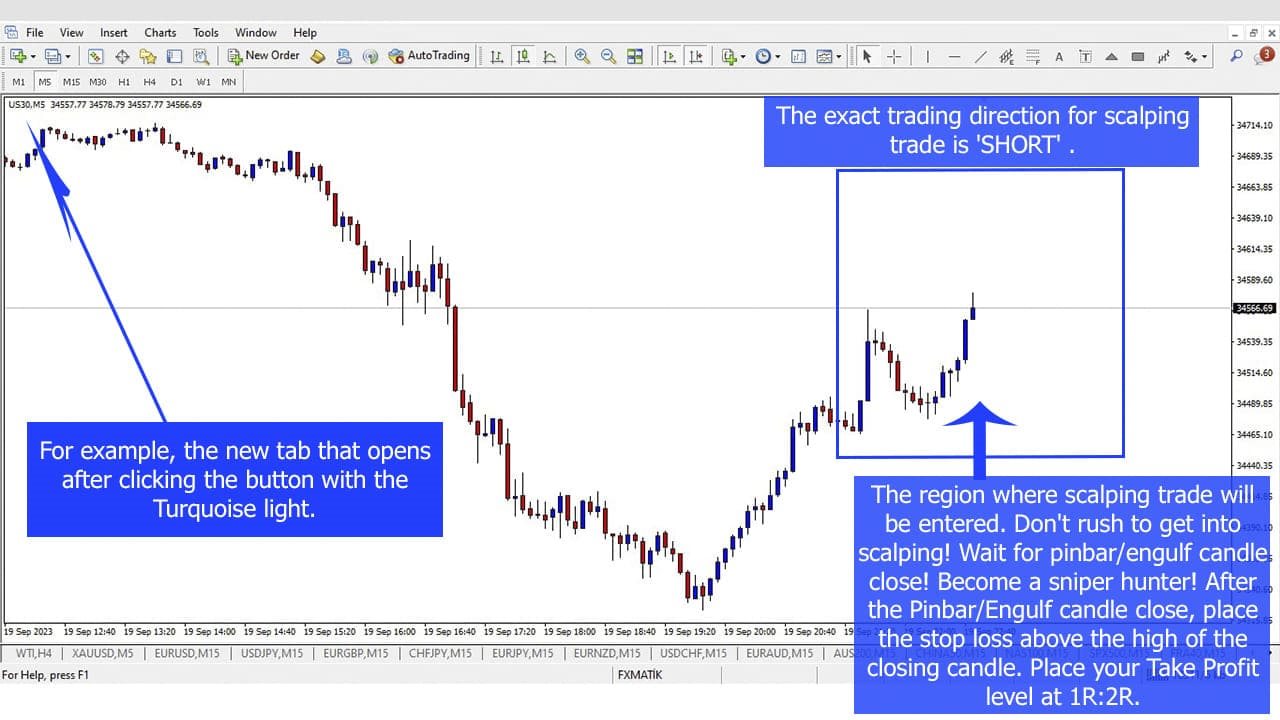
Scalper Terminal インターフェイス ソフトウェアはインジケーターであり、自動売買取引には関与しません。 このインジケーターは、スキャルピング取引機会が発生したときに取引を開始できる現在の取引ゾーンを示します。 スキャルピング シグナルがある場合、関連する取引ペアの右側にターコイズ色のライトが点灯し、その上に正確な取引方向が表示されます。 その後、「ターコイズ」ボタンをクリックしてトランザクションを入力します。 新しいタブが開きます。 その後、ローソク足の終値が予想され、これがスキャルピング取引に参加するための条件となります。
Scalper Terminal でスキャルピング取引取引を成功させるため;
- 説明セクションにあるビデオを必ずご覧ください。 兵士のように Scalper Terminal ソフトウェアに固執します。
- 各取引ペアの右側には、5M、15M、および DIRECTION 列があります。 まず、「通知」ボタンをクリックして緑色にします。
- 常に画面を見続ける必要はありません。 ターコイズ色の光信号またはメタトレーダー警告メッセージ音が鳴るのを待ってください。
- ターコイズ色のライトに書かれた操作の正確な方向 (DIRECTION 列のテキストも) を読みます。 正確な取引方向で、スキャルピングのターコイズボタンをクリックします。
- スキャルピング取引のために開いた新しいタブで、ハンターのようにピンバーまたはエンガルフキャンドルが閉じるのを待ちます。
- ピンバーまたはエンガルフローソクのクローズがポジションにエントリーするための条件である場合、スカルパーターミナルが示す方向にポジションをオープンします。
- ポジションのエントリー方向と反対側にストップロス注文を追加します。 (たとえば、LONG 取引の場合、ストップロス注文の場所は、最後に閉じられたローソク足の最低レベルです。)
- その後、テイクプロフィット注文を 1R:2R として追加します。
- 成功の唯一の条件は、すべてのポジションを同じリスク率でエントリーし、ストップロスを1R、テイクプロフィットを2Rにすることです。 ポジション サイズ計算機 (PSC Trader.ex4 など) などの追加の無料 Metatrader4 プラグインを使用して、固定リスクに適切なロット サイズでポジションを入力します。
- スキャルパーターミナルは、1 日中に 5 ~ 20 個のスキャルピング取引シグナルを生成できます。 (ソフトウェアの左上にある期間の値によって異なります。値 18 を使用することをお勧めします)
- スナイパーのようなハンターになろう! 我慢して! 青緑色の光信号を待ってから、ピンバー/ローソクを飲み込むまで待ちます。
- すべてのポジションの Excel スプレッドシートを作成してください。 1R:2R リスクリワードの法則に従えば、成功は避けられません。
- 同時にインデックス グループから 1 ペアだけを選択し、外国為替グループから 1 ペアだけを選択します。 同じグループから複数のパリティでトランザクションをオープンしないでください。
- ターコイズ色の光シグナルを受信してペアで取引を開始する場合は、次の取引に入るために 1 ~ 2 時間休憩を取ってください。 2 つの連続するトランザクションの間に時間があれば、より理想的であるためです。