Propsense MT5
- インディケータ
- Fahim Miah
- バージョン: 1.0
- アクティベーション: 20
Welcome to Propsense, the best solution for new and veteran traders with a simple FREE strategy! NEW to MT5!
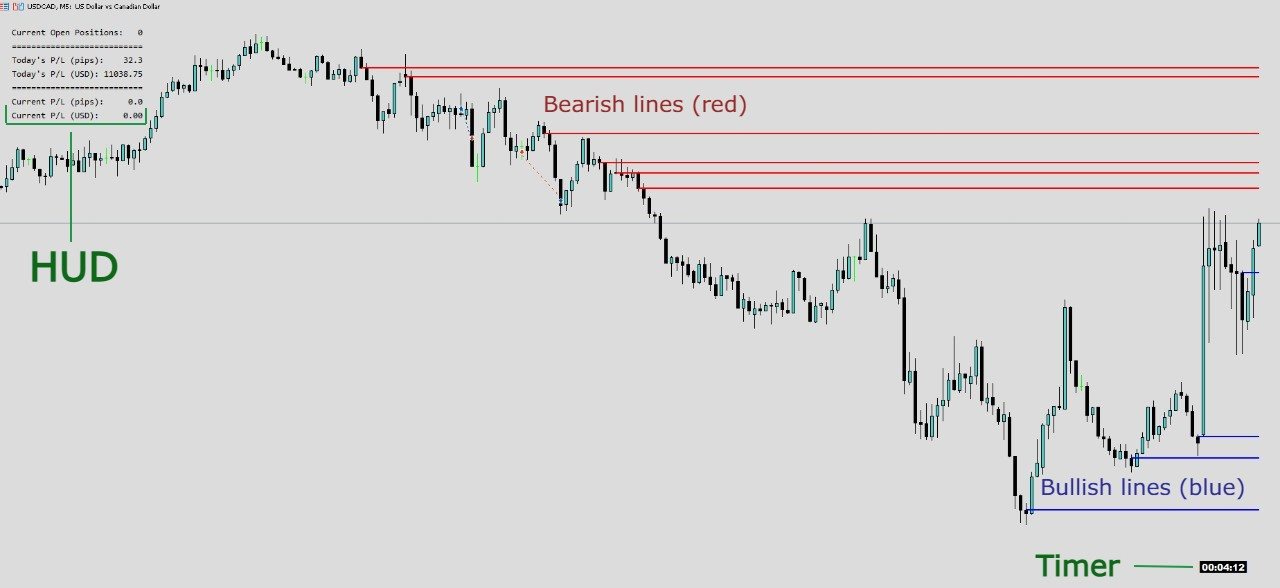
This indicator is a unique and affordable trading tool built on the teachings of a former bank trader. With this tool, you will be able to see inefficient points with ease. Additionally, traders will have a clean Heads Up Display which will show your running and closed P/L in pips AND currency units. As a highly requested option, a candle timer has been added which will allow you to judge your entries according to our strategy better.
IMPORTANT INFORMATION
Maximise the potential of Propsense by watching our video explaining the strategy. This is NOT smart money concepts, order blocks, but it is an easy-to-learn and FREE strategy straight from a reliable source. Join our thriving community to trade and learn for completely free!
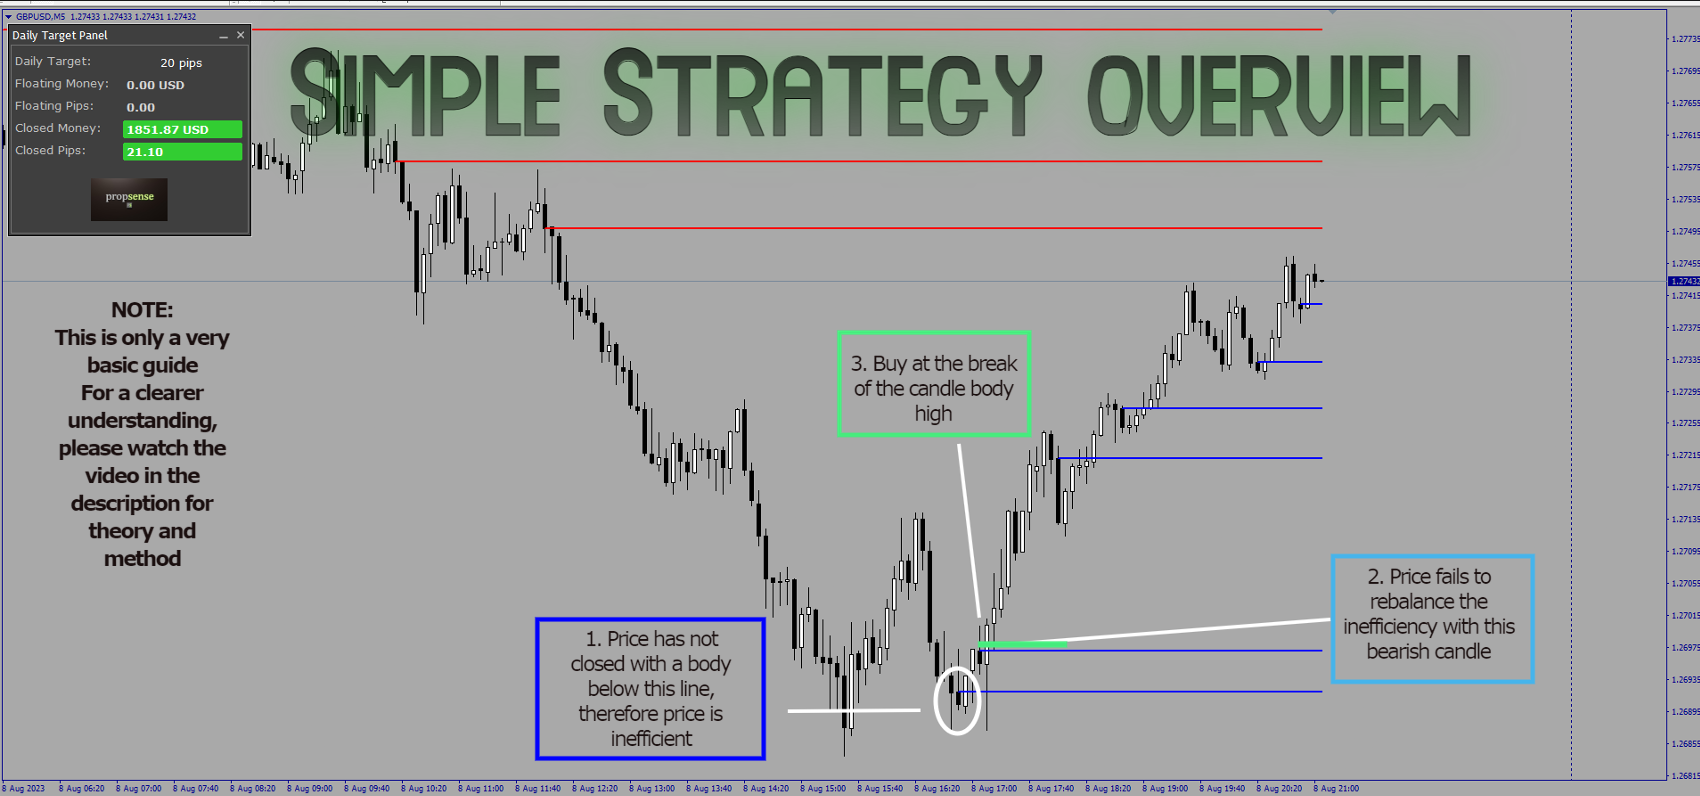
Imagine how much your trading can improve when you can pinpoint why the market is moving and where it's going to! Using a simple new algorithm, it gives you the seamless identification of inefficient price action in real time. This is because it graphically shows the most recent inefficient candles. This tells you where the market is reaching for and how probable it is for continuations versus how probable it is for a reversal (if large positions need to be closed out).
A very powerful and unique feature of this tool is that it focuses only on bear candles. This allows you, the trader, to only need to focus on 50% of the structure to determine if price is expanding in one direction or being delivered equally in a range.
Recommended pairs are USD pairs. All forex pairs are derivative of the US dollar (i.e. AUDJPY is priced by taking AUDUSD with USDJPY). For the most raw and accurate price action, we recommend using USD pairs.
This strategy is formulated on a framework that has existed since the markets began. This gives you a great advantage in trading - allowing you to adapt to market conditions while maintaining a solid framework of how and why the markets move.
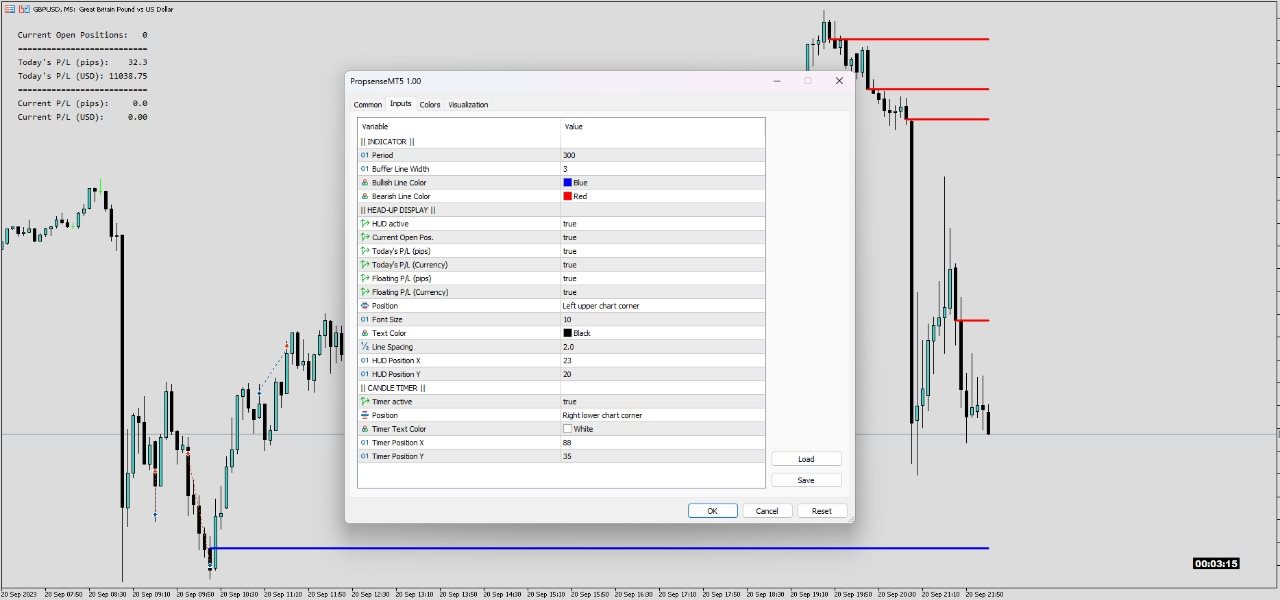
Parameters
Indicator:
- Period: Number of candles to calculate
- Buffer line width: Customise bearish and bullish line width (numbers 1 to 5, larger number being thicker)
- Bullish line colour: Select colour for bullish line
- Bearish line colour: Select colour for bearish line
Head-Up Display:
- HUD active: Toggle the entire HUD on and off (true or false)
- Current Open Pos: Toggle current open position on HUD on and off (true or false)
- Today's P/L (pips): Toggle closed P/L in pips on HUD on and off (true or false)
- Today's P/L (currency): Toggle closed P/L in currency on HUD on and off (true or false)
- Floating P/L (pips): Toggle floating P/L (pips) on HUD on and off (true or false)
- Floating P/L (currency): Toggle floating P/L (currency) on HUD on and off (true or false)
- Position: Select which corner of the screen the HUD should be in
- Font size: Customise font size based on your preference
- Text color: Customise text colour based on your preference
- HUD Position X: Change X coordinate position of HUD with pixel position
- HUD Position Y: Change Y coordinate position of HUD with pixel position
Candle Timer:
- Timer active: Toggle candle timer on and off
- Position: Select which corner of the screen the HUD should be in
- Timer text colour: Customise colour of text within the timer based on your preference
- Timer Position X: Change X coordinate position of timer with pixel position
- Timer Position Y: Change Y coordinate position of HUD with pixel position
Tips for optimal usage:
- Watch our free strategy videos to understand the method fully
- Join our community (YT channel description) to learn and trade with us live
The Propsense community will always do our best to help you!
Best regards,
Fahim.
**WATCH THE VIDEOS & PICTURES BELOW AND READ THE DESCRIPTION FOR BEST RESULTS AND LINK TO OUR COMMUNITY**
(NOTE: One of the screenshots below with a different panel is from the MT4 version of propsense - the purpose of the screenshot is only to show a basic overview of the strategy as the lines are the same)

Great bit of kit, makes it’s a whole lot easier and marks up for you