SyntheticaFX Zones
- インディケータ
- Hendrik Lodewyk Coetsee
- バージョン: 1.6
- アップデート済み: 4 12月 2023
The SyntheticaFX Zones Indicator simplifies the process of identifying key levels in the market where price reversals are likely to occur. By incorporating this tool into their trading strategies, traders can improve their decision-making, enhance risk management, and ultimately increase their chances of success in the financial markets. However, like all technical indicators, it should be used in conjunction with other analysis methods and not relied upon as the sole basis for trading decisions.
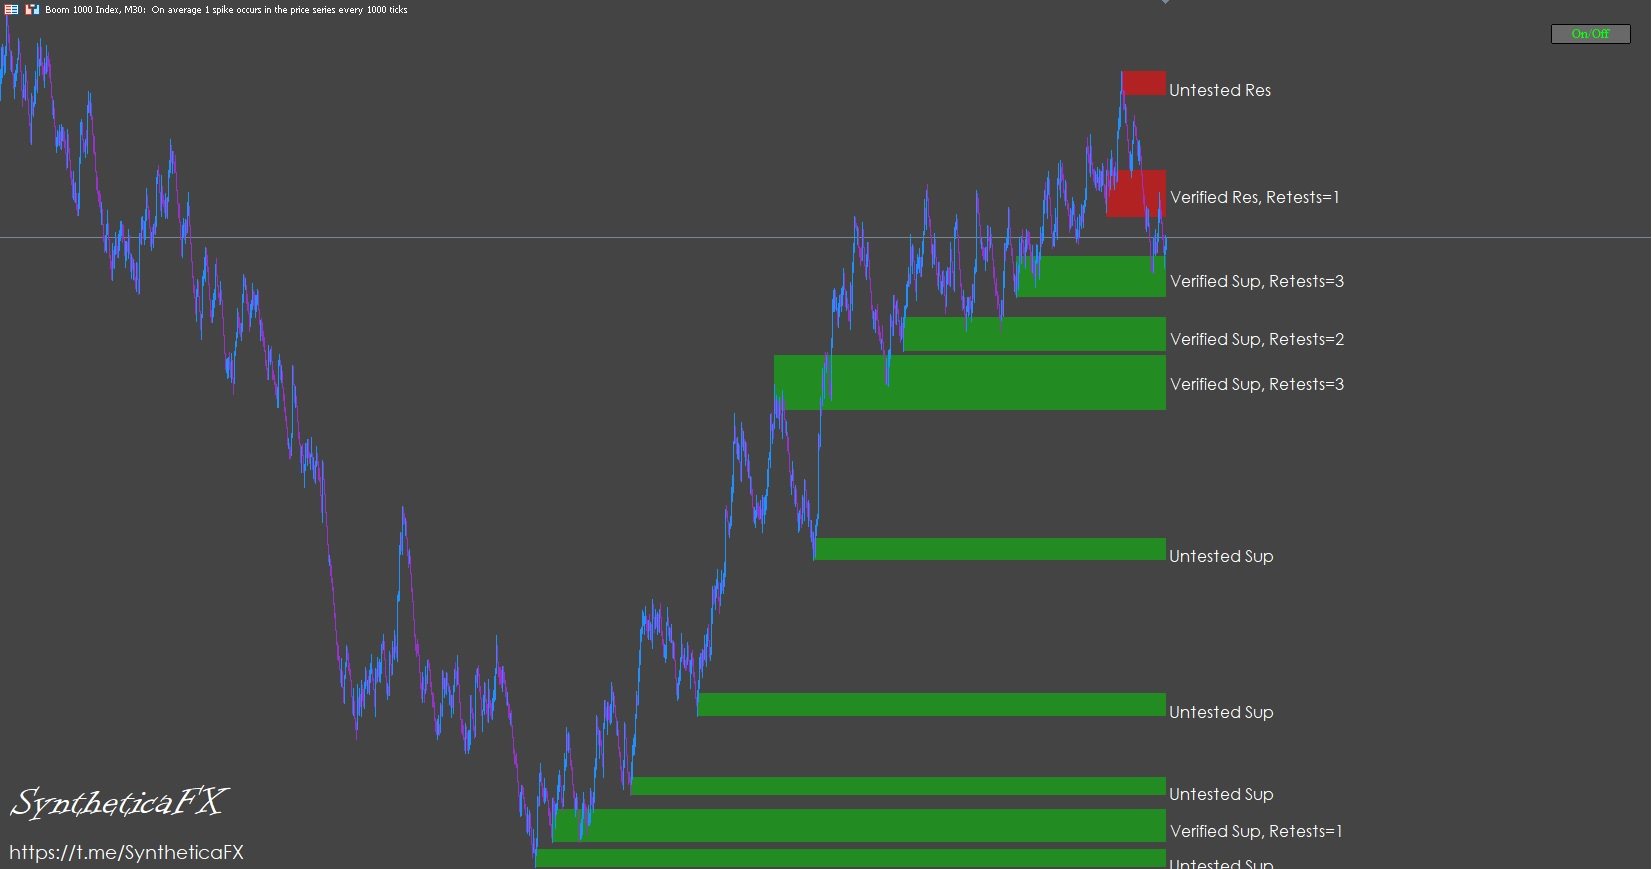
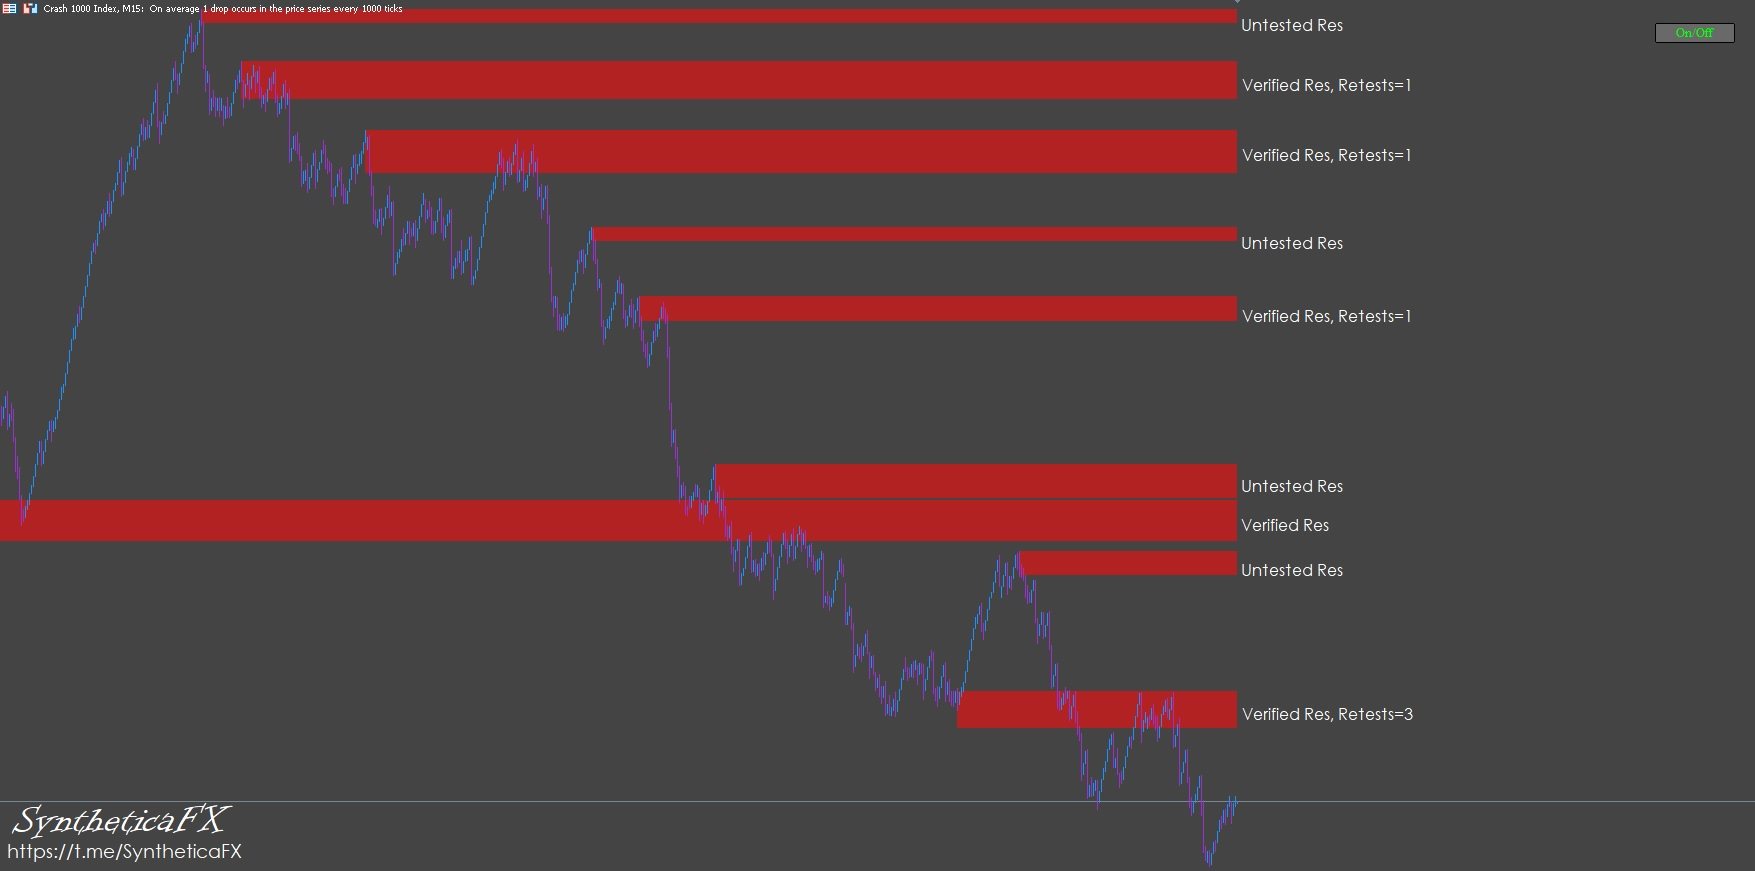

Very useful indicator compared to others I've used, for the simple fact that you can hide it. Compared to other indicators levels drawn are the same, but the option to hide it makes it stand out.