• 概要
  • レビュー
  • コメント

EA STO Stochastic Oscillator

The Stochastic Oscillator EA is a popular technical indicator used in financial markets, particularly in trading and investing. It helps traders and analysts assess the momentum and potential reversal points of an asset's price. Here's a brief explanation of the Stochastic Oscillator, often referred to as the Stochastics or simply Stoch:

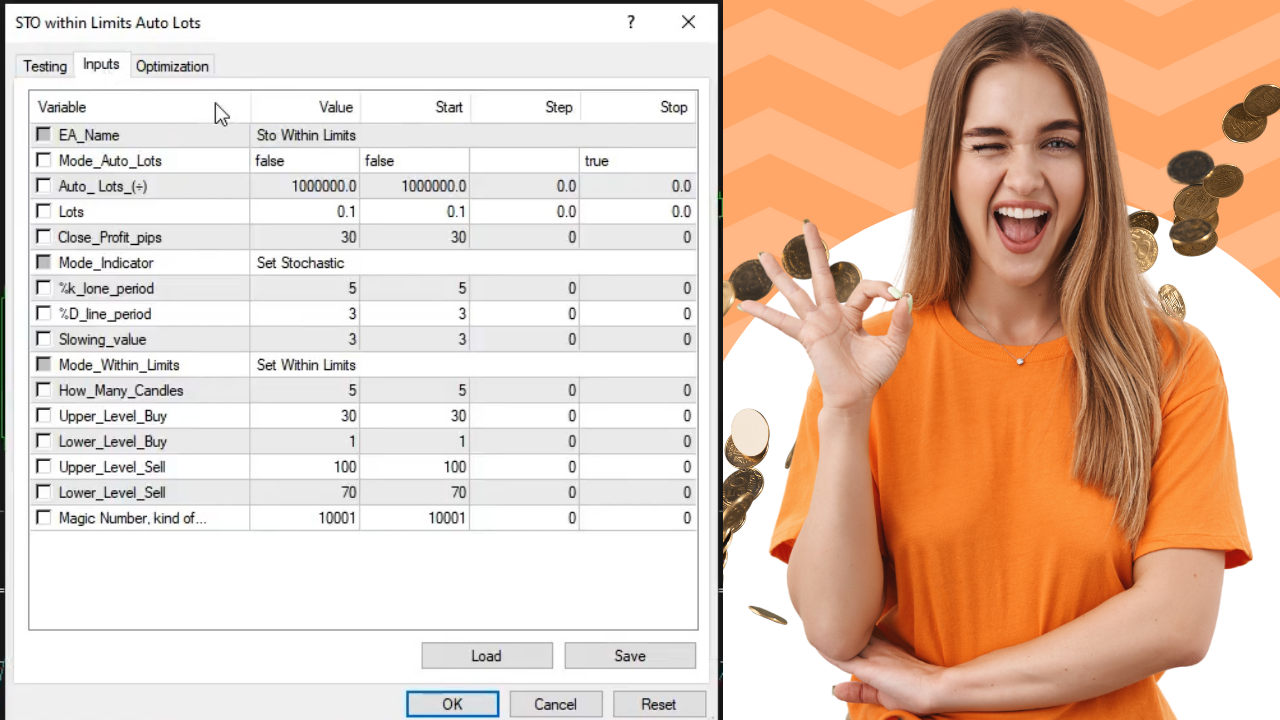
Definition: The Stochastic Oscillator is a momentum indicator that compares an asset's closing price to its price range over a specified period, typically 14 periods. The indicator consists of two lines: the %K line and the %D line.

Components:

  1. %K Line: This is the faster line and represents the current closing price's position relative to the high-low range over the specified period. The formula for %K is:

    %K = [(Closing Price - Lowest Low) / (Highest High - Lowest Low)] * 100

    The %K line moves within a range of 0 to 100 and is sensitive to short-term price fluctuations.

  2. %D Line: This is the slower, smoothed version of the %K line and is calculated by taking a simple moving average (SMA) of the %K values over a specific number of periods (usually 3). The formula for %D is:

    %D = SMA(%K, 3)

Interpretation: The Stochastic Oscillator provides signals to traders based on overbought and oversold conditions and potential bullish or bearish divergences.

  • Overbought: When the %K line rises above 80, it indicates that the asset is overbought, suggesting a potential downward reversal or correction.

  • Oversold: When the %K line falls below 20, it indicates that the asset is oversold, suggesting a potential upward reversal or bounce.

  • Bullish Divergence: When the price of the asset makes a lower low, but the Stochastic %K makes a higher low, it can signal a potential bullish reversal.

  • Bearish Divergence: When the price of the asset makes a higher high, but the Stochastic %K makes a lower high, it can signal a potential bearish reversal.

Traders often use Stochastic Oscillator signals in conjunction with other technical analysis tools and market information to make informed trading decisions.

It's important to note that the Stochastic Oscillator, like any technical indicator, has its limitations and should be used in conjunction with other forms of analysis and risk management techniques when making trading decisions.


おすすめのプロダクト
VR Cub
Vladimir Pastushak
VR Cub は、質の高いエントリーポイントを獲得するためのインジケーターです。このインジケーターは、数学的計算を容易にし、ポジションへのエントリーポイントの検索を簡素化するために開発されました。このインジケーターが作成されたトレーディング戦略は、長年にわたってその有効性が証明されてきました。取引戦略のシンプルさはその大きな利点であり、初心者のトレーダーでもうまく取引することができます。 VR Cub はポジション開始ポイントとテイクプロフィットとストップロスのターゲットレベルを計算し、効率と使いやすさを大幅に向上させます。取引の簡単なルールを理解するには、以下の戦略を使用した取引のスクリーンショットを見てください。 設定、設定ファイル、デモ版、説明書、問題解決方法は、以下から入手できます。 [ブログ] レビューを読んだり書いたりすることができます。 [リンク] のバージョン [MetaTrader 5] エントリーポイントの計算ルール ポジションをオープンする エントリーポイントを計算するには、VR Cub ツールを最後の高値から最後の安値までストレッチする必要があります。
Gold Bricks FX USES THE TREND WAVE INDICATOR AND IT CAN IDENTIFY THE BEGINNING AND THE END OF A NEW WAVE TREND MOVEMENT. AS AN OSCILLATOR, THE INDICATOR IDENTIFIES THE OVERBOUGHT AND OVERSOLD ZONES. IT WORKS GREAT TO CATCH THE SHORT TERM PRICE REVERSALS AND USES A MARTINGALE STRATEGY TO CLOSE ALL TRADES IN PROFIT. USE DEFAULT SETTINGS ON H1 OR HIGHER TIME FRAME ON ANY PAIR FOR MORE ACCURATE TRADES WHY THIS EA : Smart entries calculated by 4 great strategies The EA can be run on even a
"The trend is your friend" is one of the best known sayings in investing, because capturing large trendy price movements can be extremely profitable. However, trading with the trend is often easier said than done, because many indicators are based on price reversals not trends. These aren't very effective at identifying trendy periods, or predicting whether trends will continue. We developed the Trendiness Index to help address this problem by indicating the strength and direction of price trend
Owl smart levels
Sergey Ermolov
4.58 (55)
MT5版  |   FAQ Owl Smart Levels Indicator   は、 Bill Williams   の高度なフラクタル、市場の正しい波構造を構築する Valable ZigZag、エントリの正確なレベルをマークする Fibonacci レベルなどの一般的な市場分析ツールを含む 1 つのインジケーター内の完全な取引システムです。 利益を得るために市場と場所に。 戦略の詳細な説明 インジケータを操作するための指示 顧問-取引助手 プライベートユーザーチャット ->購入後に私に書いて、私はプライベートチャットにあなたを追加し、あなたはそこにすべてのボーナスをダウンロードすることができます 力はシンプルさにあります! Owl Smart Levels   取引システムは非常に使いやすいので、専門家にも、市場を勉強し始めて自分で取引戦略を選択し始めたばかりの人にも適しています。 戦略と指標に秘密の数式や計算方法が隠されているわけではなく、すべての戦略指標は公開されています。 Owl Smart Levels を使用すると、取引を開始するためのシグナルをすばやく確認し、
発見が困難で頻度が少ないため、分岐は最も信頼できる取引シナリオの1つです。このインジケーターは、お気に入りのオシレーターを使用して、通常の隠れた分岐点を自動的に見つけてスキャンします。 [ インストールガイド | 更新ガイド | トラブルシューティング | よくある質問 | すべての製品 ] 取引が簡単 通常の隠れた発散を見つけます 多くのよく知られている発振器をサポート ブレイクアウトに基づいて取引シグナルを実装します 適切なストップロスおよび利益レベルを表示します 設定可能なオシレーターパラメーター カスタマイズ可能な色とサイズ バー単位でサイズ別に分岐をフィルタリング パフォーマンス統計を実装します 電子メール/音声/視覚アラートを実装します 幅広い市場の見通しを提供するために、異なるオシレーターを使用して、干渉なしで同じチャートにインジケーターを何度もロードできます。このインジケーターは、次のオシレーターをサポートしています。 RSI CCI MACD オスマ 確率的 勢い 素晴らしい発振器 加速器発振器 ウィリアムズパーセントレンジ 相対活力指数 特に外国為替市
This is an arrow indicator without a future function,developed based on the most advanced profit trading algorithms.It has the most innovative and advanced dual trend analysis module, as well as the latest and highly effective market trend prediction algorithm.Trends are your friends, and following larger trends can earn the maximum profit in foreign exchange. This indicator helps traders identify current trends and track them. Someone once made a profit of 10 times in a week by relying on it.No
Description : Rainbow EA MT4 is a simple Expert advisor based on  Rainbow MT4 technical indicator witch is based on Moving average with period 34. The indicator is incorporated in the EA, thus, it is not required for the EA to operate, but, if you wish you can download it from my product page . The Expert Advisor settings are as follows : Suitable for Timeframes up to H1 The parameters below can be set according to your trading rules. StopLoss ( Stop Loss in pips) TakeProfit ( Take Profit in pip
Introducing the "Magic Trades" for MetaTrader 4 – your ultimate tool for precision trading in dynamic markets. This innovative indicator revolutionizes the way you perceive market trends by harnessing the power of advanced analysis to detect subtle changes in character, paving the way for optimal trading opportunities. The Magic Trades Indicator is designed to empower traders with insightful entry points and well-defined risk management levels. Through its sophisticated algorithm, this indica
For sure, this indicator has become very popular amongst traders. Through coding this indicator will give you the most accurate levels possible for your trading analysis. We have also added in the ability for you to receive alerts when the price breaks above or below a Support or Resistance lines! HOW TO USE The red rectangles represent your resistance/supply zone. The green rectangles represent your support/demand zone.  BONUS FEATURES We coded this indicator with the ability to switch between
Noize Absorption Index - is the manual trading system that measures the difference of pressure between bears forces and bulls forces. Green line - is a noize free index that showing curent situation. Zero value of index shows totally choppy/flat market.Values above zero level shows how powerfull bullish wave is and values below zero measures bearish forces.Up arrow appears on bearish market when it's ready to reverse, dn arrow appears on weak bullish market, as a result of reverse expectation. S
Trade with Gann on your side!! MASTER CIRCLE 360 CIRCLE CHART, originally created by Gann admitted that this is “The Mother of all charts”. It is one of the last studies that this great trader left for us. The numeric tab le is apparently quite simple like all the tables and is based on square numbers, the SQUARE OF 12 and is by evolution, one of the most important square numbers. Here we can find CYCLE, PRICE AND TIME thanks to angles and grades, to show past and future support and resistance.
This is a trend indicator without redrawing Developed instead of the binary options strategy (by the color of the Martingale candlestick) Also works well in forex trading When to open trades (binary options) A signal will appear in the place with a candle signaling the current candle It is recommended to open a deal for one candle of the current timeframe M1 and M5 When a blue dot appears, open a deal up When a red dot appears, open a trade down. How to open trades on Forex. When a signal is rec
The indicator displays the data of the Stochastic oscillator from a higher timeframe on the chart. The main and signal lines are displayed in a separate window. The stepped response is not smoothed. The indicator is useful for practicing "manual" forex trading strategies, which use the data from several screens with different timeframes of a single symbol. The indicator uses the settings that are identical to the standard ones, and a drop-down list for selecting the timeframe. Indicator Parame
Requirements Optimized to work with   EURUSD-EURCHF-USDJPY, AUDUSD-CADJPY-AUDNZD, CHFJPY-NZDJPY-NZDUSD For timeframe 4H. *(Minimum recommended deposit is $300 for each Pair) for initial lot set to 0.10, My favorite Pair are (CHFJPY-NZDJPY-EURUSD-AUDNZD-USDJPY) Warning it will be SALE only 5 Copys at 60$ Then it will be update up to 200$  You can use it the way it is, For new Set Files will be add on (Comments) ECN broker with low spread is recommended to get better results. Setup is
標準パラメーターを使用したMACDインジケーター波に基づく 最後と最後の2つのMACDウェーブで、それぞれ正と負のフィボナッチレベルを扱います。 現時点でMACDインジケーターで負の波が終了している場合、色は緑です。 現時点でMACDインジケーターの正の波が終了している場合、色は赤です。 Waveの終了基準は、MACDの符号が異なる2ティックです。 最後の4つのMACDウェーブのトレンドラインをプロットします。 専門家とうまく働く  その他のスクリーンショット: Figures MACD   https://www.mql5.com/ru/market/product/42031 https://www.mql5.com/en/charts/10581596/audusd-h1-alpari-international https://www.mql5.com/en/charts/10631979/usdjpy-m1-alpari-international https://www.mql5.com/en/charts/10628704/gbpusd-
Chart Patterns Detect 15 patterns (Ascending Triangle, Descending Triangle, Rising Wedge, Falling Wedge, Bullish Flag, Bearish Flag, Bullish Rectangle, Bearish Rectangle Symmetrical triangle, Head and Shoulders, Inverted Head and Shoulders, Triple top, Triple Bottom, Double Top, Double Bottom) Use historical data to calculate the probability of each pattern to succeed (possibility to filter notification according to the chance of success) gives graphic indication about the invalidation level and
Next level of trend trading here. Possibility 75%, the indicator analyzes the current market to determine short (small dot), middle (circle with a dot inside) and long (cross with a circle and a dot inside) trends.  Wingdings characters of  Aqua color represents the beginning of the UP trend. Wingdings characters of  Orange color represents the beginning of the DOWN trend. Possibility 75% Indicator will improve your trading in the world of forex, commodities, cryptocurrencies and indices.
The Th3Eng PipFinite indicator is based on a very excellent analysis of the right trend direction with perfect custom algorithms. It show the true direction and the best point to start trading. With StopLoss point and Three Take Profit points. Also it show the right pivot of the price and small points to order to replace the dynamic support and resistance channel, Which surrounds the price. And Finally it draws a very helpful Box on the left side on the chart includes (take profits and Stop loss
ROYAL DUTCH SKUNK USES THE TREND WAVE INDICATOR AND IT CAN IDENTIFY THE BEGINNING AND THE END OF A NEW WAVE TREND MOVEMENT. AS AN OSCILLATOR, THE INDICATOR IDENTIFIES THE OVERBOUGHT AND OVERSOLD ZONES. IT WORKS GREAT TO CATCH THE SHORT TERM PRICE REVERSALS AND USES A MARTINGALE STRATEGY TO CLOSE ALL TRADES IN PROFIT. USE DEFAULT SETTINGS ON H1 OR HIGHER TIME FRAME ON ANY PAIR FOR MORE ACCURATE TRADES WHY THIS EA : Smart entries calculated by 6 great strategies The EA can be run on even a $20000
サポート線と抵抗線のプロットにうんざりしていませんか? サポートレジスタンス は、非常に興味深いひねりを加えてチャート内のサポートとレジスタンスラインを自動検出およびプロットするマルチタイムフレームインジケーターです。価格レベルは時間とともにテストされ、その重要性が高まるにつれて、ラインは太くなり、暗くなります。 [ インストールガイド | 更新ガイド | トラブルシューティング | よくある質問 | すべての製品 ] 一晩でテクニカル分析を強化 チャートを閲覧せずに重要な価格レベルを検出 一目ですべての価格レベルの相対的な強さを認識する すべての取引で最大30時間のプロットラインを節約 インジケーターは、すべての価格レベルの年齢を表示します インジケーターは再描画されていません 過去および現在の価格レベルは近接によって崩壊し、現在の市場行動に合わせて調整されます。動作は、必ずしもピークではない場所に線が引かれます。 価格レベルは、時間とともに拒否されるにつれて、より暗く、より広くなります ノイズを避けるために、重要でない価格レベルは定期的にクリアされます カスタマイズ可能な時間枠の
PipFinite Trend PRO
Karlo Wilson Vendiola
4.9 (2780)
Breakthrough Solution For Trend Trading And Filtering With All Important Features Built Inside One Tool! Trend PRO's smart algorithm detects the trend, filters out market noise and gives entry signals with exit levels. The new features with enhanced rules for statistical calculation improved the overall performance of this indicator. Important Information Revealed Maximize the potential of Trend Pro, please visit www.mql5.com/en/blogs/post/713938 The Powerful Expert Advisor Version Automa
Towers - Trend indicator, shows signals, can be used with optimal risk ratio. It uses reliable algorithms in its calculations. Shows favorable moments for entering the market with arrows, that is, using the indicator is quite simple. It combines several filters to display market entry arrows on the chart. Given this circumstance, a speculator can study the history of the instrument's signals and evaluate its effectiveness. As you can see, trading with such an indicator is easy. I waited for an a
5 signal in 1  Product     TimeFrame   Recommend   1m-5m recommend  signal   TF  5m    Banks Pro Binary Option is Indicator for binary option Can Use Manaul Trade or Robot on Platform  Mt2Trading  https://www.mt2trading.com/?ref=104    Time Trading   good work  EU session    Recommend  Curency   EUR  GBP USD        careful   AUD JPY      Recommend  Martingale 2-5 Step   Recommend  set profit  2%-5%/Day Setting Brake  News Event High volatility   recommend  15-30 min Have Problem Contract
Signal trend indicator. Detects the direction of the trend and is coloured accordingly.  Has built in audible and visual alerts when trends change. Can send notifications to your phone or email. Allows Trend and Counter-Trend trading. Works on all timeframes, all currency pairs, metals, indices and cryptocurrencies. Can be used with binary options. Distinctive features No re-drawing; Simple and clear settings; Four types of alerts; Works on all timeframes and all trading tools; Su
Price Breakout pattern Scanner is the automatic scanner for traders and investors. It can detect following patterns automatically from your chart. Head and Shoulder - Common tradable pattern. Reverse Head and Shoulder - This pattern is the reverse formation of the Head and Shoulder. Double Top - When the price hits resistance level twice and decline toward the support level, the trader can anticipate sudden bearish breakout through the support level. Double Bottom - The double bottom pattern is
How to use Pair Trading Station Pair Trading Station is recommended for H1 time frame and you can use it for any currency pairs. To generate buy and sell signal, follow few steps below to apply Pair Trading Station to your MetaTrader terminal. When you load Pair Trading Station on your chart, Pair Trading station will assess available historical data in your MetaTrader platforms for each currency pair. On your chart, the amount of historical data available will be displayed for each currency pai
回帰取引を意味する専門的かつ定量的なアプローチを実装する独自の指標。これは、価格が予測可能かつ測定可能な方法で迂回して平均に戻るという事実を利用しており、非定量的な取引戦略を大幅に上回る明確な出入りルールを可能にします。 [ Installation Guide | Update Guide | Troubleshooting | FAQ | All Products ] 明確な取引シグナル 驚くほど簡単に取引できます カスタマイズ可能な色とサイズ パフォーマンス統計を実装します ほとんどの取引戦略を上回ります 適切なSLおよびTPレベルを表示します 電子メール/音声/視覚アラートを実装します 使い方 インディケータは、より高い時間枠からの完全にカスタマイズ可能な移動平均の周りの標準偏差を測定し、トレンドフォローアプローチを使用して正確に取引を見つけます。取引は、現在のチャートの価格アクションに飛び込むことによって見つけられ、価格が選択したより高い時間枠から計算された平均価格帯に戻ったときに閉じられます。それがコード化される方法のために、指標は高ボラティリティと強いトレンドの
Trend PA
Mikhail Nazarenko
5 (3)
The Trend PA indicator uses   Price Action   and its own filtering algorithm to determine the trend. This approach helps to accurately determine entry points and the current trend on any timeframe. The indicator uses its own algorithm for analyzing price changes and Price Action. Which gives you the advantage of recognizing, without delay, a new nascent trend with fewer false positives. Trend filtering conditions can be selected in the settings individually for your trading style. The indicator
This product is a part of  ON Trade Waves Patterns Harmonic Elliot Wolfe you can test free version on EURJPY from this link  Wolf Waves Indicator ウルフウェーブを発見しよう - あなたの究極の取引ツール! どんな時間軸でも簡単にウルフウェーブを見つけるための強力なツールを探していますか?もう探す必要はありません!私たちのウルフウェーブインジケーターは、その仕事を簡単にこなします。なぜこのインジケーターがあなたにぴったりか、以下でご紹介します。 主な特徴: 自動検出: ウルフウェーブインジケーターは、複雑なアルゴリズムを使用して、チャート上のキーポイントを自動的に見つけ、対応するラインを描画します。手動でパターンを探す手間が不要です。 使いやすさ: このインジケーターはシンプルなデザインで、経験豊富なトレーダーからウルフウェーブ初心者まで、誰でも簡単に利用できます。 高精度: 数多くのウルフウェーブインジケーターの中で、当社のものは完璧
[ZhiBiCCI]インディケータは全てのサイクル使用に適しており、そして全ての市場品種にも適しています。 [ZhiBiCCI]緑色の実線は強気の発散の逆転です。緑色の点線は古典的な強気の発散です。 [ZhiBiCCI]赤への実線は逆弱気の発散である。赤い点線は古典的な弱気の発散です。 [ZhiBiCCI]はパラメータ(アラート、メール送信、通知送信)で設定でき、(true)に設定するとインスタント信号をアラームウィンドウに送信し、Eメール、インスタントメッセージを送信できます。 パラメータ設定の説明 [displayAlert]:これはアラームスイッチで、trueに設定され、矢印が表示されればプロンプトに自動的に警告され、falseに設定されれば警告されません。 [sendmail_NO_OFF]:これはメールを送信するためのスイッチで、trueに設定します。矢印が表示されていればMT4で設定したメールボックスにメールを送信し、falseに設定されていればメールを送信しません。 [sendnotification_NO_OFF]:これはインスタントメッセー
このプロダクトを購入した人は以下も購入しています
The Gold Reaper MT4
Profalgo Limited
4.72 (32)
プロップしっかり準備完了!   (   SETFILEをダウンロード ) ローンチプロモーション: 現在の価格で残りわずかです! 最終価格: 990ドル EA を 1 つ無料で入手 (2 取引アカウント用) -> 購入後に連絡してください Ultimate Combo Deal   ->   click here JOIN PUBLIC GROUP:   Click here Live Signal ゴールドリーパーへようこそ! 非常に成功した Goldtrade Pro を基にして構築されたこの EA は、複数の時間枠で同時に実行できるように設計されており、取引頻度を非常に保守的なものから非常に不安定なものまで設定するオプションがあります。 EA は複数の確認アルゴリズムを使用して最適なエントリー価格を見つけ、内部で複数の戦略を実行して取引のリスクを分散します。 すべての取引にはストップロスとテイクプロフィットがありますが、リスクを最小限に抑え、各取引の可能性を最大化するために、トレーリングストップロスとトレーリングテイプロフィットも使用します。 このシステムは、重要なサポート
AI Gen XII EA This is an Expert Advisor with the latest use of Artificial Intelligence and Neural Networks. The EA runs on the top-of-the-line GPT-4o platform and also uses Advanced Discrete Fourier Imaging in ATFNet aligns the frequency spectrum of the input series, allowing for a more complete analysis of time series data. The EA also boasts trading on different strategies simultaneously and matching backtest trades and real trading, which is very important in its time.  Details about Advisor
Adapt EA
Alexander Kozachuk
5 (5)
過去 24 年間のバックテスト (2000 年以降) 高い収益性 市場のさまざまな状態に対応する適応型アルゴリズム あらゆるブローカーと互換性があります 実証済みのドローダウン制御システム ペア: USDCAD、EURUSD、AUDUSD、EURGBP、USDJPY 標準バックテストのダウンロード: ここをクリック 99% TickData (Ducascopy) バックテストのダウンロード: ここをクリック ライブ アカウント : ここをクリック ライブ アカウント(アグレッシブ) : ここをクリック 開発について: 当社は、 15 年以上にわたり Forex Expert Advisors (ロボット) の開発を専門とす るプロのトレーダー チームです。当社が作成するロボットのほとんどは、実際にはエンド ユーザーに届きません。その理由は、すべてのテストを終えた後、最終的に、収益性と信頼性に優れたロボットの基準を満たさないためです。当社の開発アプローチは、12 個の「普通の」ロボットを破棄して、本当に優れた開発を少数リリースすることを好むというものです。 動作原
way to starsは、市場のボラティリティが低い期間に低リスクの機会を活用して取引するために特別に設計された夜間スキャルピングeaです。この夜のスキャルピングeaは頻繁な取引のための小さな価格の動きをキャプチャすることに焦点を当て、それによって時間をかけて利益を蓄積します。1トレードあたりの潜在的な損失を抑制するために、厳格なストップロス対策を採用し、効果的なリスク管理を確保しています。way to starsは、ニューラルネットワーク、人工知能、chatgpt、または完全な直線バックテスト結果に依存しない、本物で正直な取引システムです。 MT5       マニュアル   signal:   https://www.mql5.com/en/signals/2220466 次価格: $699 setfile of signal このeaの特徴: 適切な通貨ペア:GBPUSD 時間枠の読み込み:任意の時間枠です 格子なし、マーチンゲールなし、一度に単一の取引 リスクを低減するために、注文を小さい注文に分割します リミット最大ポジションと最大浮動損失率を通じてリスクを管理します タイ
注意事項 EAには最大6つのエントリーポイントが含まれ、各取引のロット数は注文ロット数に6を乗じたものとなるため、ロット数が大き過ぎないようご注意ください。 ロット数のデフォルトの計算方法は資金のパーセンテージではありません。デフォルトの計算方法はレバレッジの影響を受けないため、リスクをより正確に管理できます。  リスク耐性を高めるために、1,000ドル以上の資金のご利用をお勧めします。 複数の通貨ペアを同時に使用するとリスクが蓄積される可能性があるためご注意ください。 こちらはMT5バージョンです。MT5バージョンは市場環境をより正確に再現できます。 MT4バージョンが必要な場合は、後日リリースいたします。 取引にはリスクが伴うため、こうしたリスクを理解し効果的に管理することが非常に重要です。 リアルマネーシグナル: クリックして表示 ライブシグナル: クリックして表示 MT5バージョン: MT5へ移動 618セール、期間限定で300ドル割引 現在、ゴールドEAを無料で提供するキャンペーンを行っています。購入後にご連絡いただければ、お受け取りいただけます。このキャンペーンは期間
Gold Trade Pro
Profalgo Limited
4.63 (24)
プロモーションを開始します! 449ドルで残りわずかです! 次の価格: 599ドル 最終価格: 999ドル EA を 1 つ無料で入手 (2 取引アカウント用) -> 購入後に連絡してください Ultimate Combo Deal   ->   click here New live signal:   https://www.mql5.com/en/signals/2084890 Live Signal high risk :  https://www.mql5.com/en/signals/2242498 Live Signal Set Prop Firm Set JOIN PUBLIC GROUP:   Click here Parameter overview Gold Trade Pro はゴールド取引 EA の仲間入りですが、大きな違いが 1 つあります。それは、これが本物の取引戦略であるということです。 「実際の取引戦略」とは何を意味しますか?   おそらくお気づきかと思いますが、市場に出回っているほぼすべてのゴールド EA は単純なグリッド/マー
GRain EA MT4
Roman Erokhin
4.63 (8)
Good afternoon. My name is Roman, I am the creator of Gold Rain EA. I have been preparing for its realization for a long time, went through a lot of tests and now I finished the product and went on sale with a live good signal. My motto is to use only live signals, I do not release products without history or lack of real accounts. Now you have the opportunity to try Gold Rain EA in your hands. I will help every client to customize and install EA, from beginner to pro. Tired of complicated EA mo
Quantum Emperor MT4
Bogdan Ion Puscasu
4.86 (133)
ご紹介     Quantum Empire EA は 、有名な GBPUSD ペアの取引方法を変革する画期的な MQL5 エキスパート アドバイザーです。 13年以上の取引経験を持つ経験豊富なトレーダーのチームによって開発されました。 IMPORTANT! After the purchase please send me a private message to receive the installation manual and the setup instructions. ***Quantum Emperor EAを購入すると、Quantum StarMan、Quantum Queen、Quantum Gold Emperorを無料で入手できます!*** 詳細についてはプライベートでお問い合わせください 新しい Live Signal V4:   ここをクリックしてください MT5バージョン:   ここをクリック 量子EAチャネル:       ここをクリック * サマーセール : $999。 10回購入するごとに価格が100ドルずつ上がります。最終
ローンチプロモーション 現在の価格で購入するために残っている販売は3つだけです。 次回価格: $1233 無料でUS30スキャルパーEAとQuantum Algo EAを入手 -> 購入後にご連絡ください Live signal:  https://www.mql5.com/en/signals/2220190?source=Site+Profile+Seller Prop Signal:  https://www.mql5.com/en/signals/2223219?source=Site+Signals+Profile+From+Author MT5:  https://www.mql5.com/en/market/product/116010?source=Site+Market+Product+Page Prop Challenge取引履歴: https://www.mql5.com/en/blogs/post/757093 よくある質問: https://www.mql5.com/en/blogs/post/757094 Diamond Titan FXのさらなる分析:
Z4scalp
Cence Jk Oizeijoozzisa
5 (2)
この名前を二度と忘れないようにしてください ****** Z4 ******* ご不明な点がございましたら、ご購入前にお問い合わせください。ご案内いたします 5部のみ - 完成後は価格が2600ドルに上昇します 20 年間のレビューと分析を経て、スクリプトが完成しました。 現在までのところ、どこにも販売されていません。 そして、市場の過去を活用していません。 欺瞞はありません。さらに詳しく知りたい場合は、私に連絡してください。 私たちはあなたのために100万ドルのチャートを用意したわけではありません。 ------------------------------------------------ -- ----- -------------------------------------- ---- 過去数年間にわたる個人的な戦略によって強化されました。損失限界が非常に低く、高周波は使用しません。 過去数年間にわたる個人的な戦略によって強化されました。損失制限は 3 ピップスと非常に低いです。高周波は使用しておりません。 すべ
FXMachine
Alexander Kozachuk
4.67 (15)
2020 年以降の実際のアカウントの統計 過去 13 年間のバックテスト 低ドローダウン戦略 複数通貨アルゴリズム あらゆるブローカーと互換性があります 実証済みのドローダウン制御システム 2020 年以降 のリアル口座での取引: ここをクリック USDCAD、EURGBP、GBPUSD、EURUSD での取引: ここをクリック EURGBP での取引: ここをクリック GBPUSD での取引: ここをクリック FXMachine EA の完全なバックテストはここからダウンロードできます: ここをクリック 当社について: FXMachine およびその他のロボットの開発とサポートは、 外国為替 分野で 14 年以上の経験を持つ専門チームによって行われています。 この 14 年間 の間、私たちは開発を改善し、取引に対するより優れた効果的なアプローチを見つけてきました。 もし私たちに 私たちが与えることができる最高のアドバイスは何ですかと尋ねられたら どの EA が優れているか、どの EA がそうでないかを判断するには、次のような答えが得られます。 最も
Live signal :   TrendMaster FX The MT5 version : TrendMaster FX MT5 618セール、期間限定で300ドル割引 現在、EAの試用キャンペーンを実施中です。購入後にご連絡いただければ、「Gold Garden」または「AI TradingVision GPX」をご利用いただけます。詳細はお問い合わせください。 おすすめの通貨ペア: 英ポンド/米ドル(GBPUSD) 米ドル/カナダドル(USDCAD) ユーロ/米ドル(EURUSD) リスク設定: 積極的なトレーダーのための最大リスク設定は0.15です。 より保守的なトレーダーや、特に資本の大きい人は、0.05以下に設定することをおすすめします。 購入後: ユーザーマニュアルと注意事項を入手するために、私たちに連絡してください。すでに購入された方は、おすすめの ユーザーマニュアル を参照してください。 購入後はFAQをお読みください。「 ここをクリックして表示 」 安全で安定したEA: 当社のEAは、グリッドまたはマーチンゲール戦略を使用していません。各注文にはストップロスが
The Expert Advisor works on the basis of wave-like changes in price movements. The dynamic regression channel allows you to accurately predict the price movement in the short term. The Expert Advisor uses the indicator in its trading: https://www.mql5.com/en/market/product/64252 Trading instruments (TF 5m): GBPUSD, EURUSD, USDJPY. The Expert Advisor has been successfully tested with 99% quality quotes, floating spread and random ping since 2003. Optimization of the advisor is not requir
Big Forex Players MT4
Marzena Maria Szmit
4.71 (28)
We proudly present our cutting-edge robot, the  Big Forex Players EA  designed to maximize your trading potential, minimize emotional trading, and make smarter decisions powered by cutting-edge technology. The whole system in this EA took us many months to build, and then we spent a lot of time testing it. This unique EA includes three distinct strategies that can be used independently or in together. The robot receives the positions of the   biggest Banks   (p ositions are sent from our databa
CyBRG RX Mt4
Arseny Potyekhin
5 (1)
CyBRG RXのご紹介:次世代のトレーディングアシスタント 最先端のトレーディングパートナーであるCyBRG RXとともに、トレーディングの未来に足を踏み入れましょう。 高度なニューラルネットワークの力を活用して、CyBRG RXは変化し続ける市場状況をかつてない精度で分析し、適応します。 信号:   ライブ信号 1 ライブ信号 2 この戦略は非常にユニークなので、ライセンスの数を制限して販売したいと考えています。そのため、販売を制限するために価格は着実に上昇します。 次の価格は 790米ドル です。 残り 3部のみ 。 ブローカー 任意のブローカー、 ECN / ZERO スプレッドを推奨 レバレッジ 1:20 から 入金 最低 50 ドル      シンボル USDJPY タイムフレーム H1 なぜCyBRG RXを選ぶのか? 最先端のニューラルネットワーク :CyBRG RXは学習し進化する高度なAIアルゴリズムを駆使し、洞察に富んだ市場分析を提供します。 適応戦略 :金融市場の動的な特性に合わせて、CyBRG RXは戦略を継続的に調整し、常に一歩先を
FT Gold Robot MT4
Marzena Maria Szmit
4.53 (36)
Introducing the FT Gold Robot MT4, your ultimate companion in navigating the intricate world of XAUUSD trading. Developed with precision and powered by cutting-edge algorithms, FT Gold is a forex robot meticulously crafted to optimize your trading performance with   XAUUSD pairs . With its advanced analytical capabilities,   FT Gold Robot   constantly monitors the gold market, identifying key trends, patterns, and price movements with lightning speed. The FT Gold Robot opens 5 positions every da
Magnat
Alexander Buseinus
A professional Expert Advisor designed for trading any instrument of the Metatrader 4 platform. Work Features: A large number of input parameters, with a wide range of settings, allow you to work on all instruments with any broker trading conditions. Depending on trading conditions, it can work with direct market positions or dynamic pending orders. When switching the corresponding input parameter, the Expert Advisor always opens only one trading position at a time, or it can open many posit
親愛なるトレーダーの皆様、 最新のプロジェクトをご紹介できることを非常に嬉しく思います。 EA BitBull 。リアルな暗号通貨取引が現実のものとなりました! 信号: ライブ信号 1 ライブ信号 2 この戦略は非常にユニークなので、ライセンスの数を制限して販売したいと考えています。そのため、販売を制限するために価格は着実に上昇します。 次の価格は 690米ドル です。 世界中の尊敬すべきパートナーの助けを借りて、革新的な暗号戦略を開発することに成功しました。 この戦略は、トレンドフォローと平均回帰戦略の原則をシームレスに組み合わせています。 RNN(リカレントニューラルネットワーク)やLSTM(長短期記憶ネットワーク)などの高度なニューラルネットワークを使用しています。 BTC BitBull EAの成功裏の完了に続いて、現在、ETH/BTCおよびETH/USDの取引ペアに焦点を当てています。 特に注目すべきは、この技術の恩恵を受けるために事前の取引経験が不要であることです! 最適な結果を得るために、次の設定とセットアップを遵守および採用する必要があります:
ライブシグナル-1: ここをクリック MT5バージョン: ここをクリック Quantum Algo EAを無料で取得(2つの取引口座用)-> 購入後にご連絡ください Nasdaq Algo Tradingへようこそ このEA(エキスパートアドバイザー)は、13年以上のプログラミングと取引の経験を持つチームによって作成・設計されています。 このEAは、長期的で安定した利益を提供できるシステムの開発に焦点を当てています。リスクのない戦略を採用しており、マーチンゲール、グリッド、ヘッジングの方法や、事実上ストップロスなしと同じような非常に長いストップロスを使用する戦略を避けています。 このEAは、取引ボットに対するあなたの考え方を変えるでしょう。 詳細な機能 - Dravasブレイクアウトマインドセットに基づいてエントリーポイントを見つけるために、価格アクション戦略を使用しています。 - プロップファームに適した機能を含んでいます:ドローダウンの管理、ニュースの管理、取引時間の管理など。 - 選択できる3つの戦略モードを提供します。 - マーチンゲール、グリッド、ヘ
# Neon Trade MT4 私たちの Telegram コミュニティ あなたの注意を紹介するNeon Trade - これは通貨市場でのアルゴリズム取引の分野で独自の革新で、高度な機械学習の方法を使用します。 私たちのアドバイザーは完全に自動化されており、任意のグラフと時間枠に設定した後ですぐに働く準備ができています。原則に従って動作します - グラフに掲げて忘れます。唯一必要なことは、端末の設定で私のAPI " https://xmpp.madsysadm.ru "へのアクセスを許可し、 DYNAMIC モードをオンにすることです。それ以外のことは、アドバイザーが自分で行います。 貿易監視 !!! MetaTrader 5 用バージョン !!! MetaTrader 4 用の無料(ライト)バージョン   設置と操作のマニュアル なぜこのアドバイザーを購入する必要があるのか、 特に触れたいと思います 。無料版がオリジナルとほぼ同じものと思われがちですが、そうではありません。無料版では、デモ機能のみが組み込まれており、すべての設定は自分で選び出す必要があります。それは私が時折公開
Candle EA MT4
Mansour Babasafary
4.43 (49)
This expert is based on patterns The main patterns of this specialist are candlestick patterns Detects trends with candlestick patterns It has a profit limit and a loss limit, so it has a low risk The best time frame to use this expert is M30 time frame The best currency pairs to use with this expert is the EURUSD, GBPUSD, AUDUSD, USDCAD currency pairs Attributes: Can be used in the EURUSD, GBPUSD, AUDUSD, USDCAD  currency pairs Can be used in M30, H1, H4 time frames Has profit limit an
この価格では残り2台のコピー機のみです。次の価格は$1533です ライブ結果を確認するにはこちら: $50K パーソナルシグナル:   [こちらをクリック] Prop会社のライブシグナル:   [こちらをクリック] MT5バージョンはこちら:   [こちらをクリック] Quantum Algo Trading MT4 EA   へようこそ。 このEAは単なる機械的なシステム以上のものであり、一生涯にわたるトレードの旅の仲間となるよう設計されています。 このEAは、トレードとプログラミングに13年以上の経験を持つ人物によって最適化されたブレイクアウトシステムを使用しています。 市場に出回っている他のEAとは異なり、過去のバックテスト結果のみに頼ることはなく、多くが意図的に過去に合わせて結果を操作しているのに対し、Quantum Algo Tradingは結果を過去に合わせることなく完全に自然なバックテストを行っています。また、実際の結果とバックテスト結果を比較したフォワードテストの段階も経ています。 このEAは、バックテスト結果と99.9%一致する現実の結果を提供し
ローンチプロモーション: 現在の価格で入手可能な限定数のコピー 最終価格: 990$ NEW: 無料で EA を 1 つゲット!   (2取引口座の場合) Ultimate Combo Deal   ->   click here LIVE RESULTS:   https://www.mql5.com/en/signals/1949810 JOIN PUBLIC GROUP:   Click here Set Files DayTrade Pro アルゴリズムへようこそ!   何年にもわたって市場を研究し、さまざまな戦略をプログラミングしてきた結果、優れた取引システムに必要なすべてを備えたアルゴリズムを見つけました。 ブローカーに依存しない スプレッド インディペンデント MT4、MT5、TDS2、および複数のブローカーで、実際の変数スプレッドテストを使用して非常に安定したバックテストを簡単に示します 何百もの異なる設定はすべて、テストで有益な結果をもたらします (もちろん、私は最高のものを選択しました!) 非常に堅牢なシステム -> 設定は交換可能であるため、USDJPY
Dark Algo
Marco Solito
4.79 (62)
Last copy at 399$ -> next price 499$ Dark Algo  is a fully automatic Expert Advisor for Scalping Trading on Eurusd . This Expert Advisor is based on the latest generation of algorithm and is highly customizable to suit your trading needs.  If you   Buy this Expert   Advisor you can   write a feedback   at market and   get   a second EA for   Free , for More info contact me The basic strategy of this EA is built on a sophisticated algorithm  that allows it to identify and follow market trends .
Ai Hybrid Robot MT4
Mansour Babasafary
5 (3)
Several experts in one expert With this expert, you can use several up-to-date strategies Enhanced with artificial intelligence Can be used in several popular forex currencies Can be used in the most popular forex time frames Without using high-risk strategies Attributes : Can be used in the EURUSD , GBPUSD , USDCHF , AUDUSD , USDCAD , NZDUSD  currency pairs Can be used in M30 , H1 , H4 , D1 time frames Has profit limit and loss limit Without using risky strategies like martingale or hedg
Harmony Driveは、USDJPY、AUDCAD、CHFJPY、AUDUSD、USDCHF、NZDUSDの以下のシンボルの慎重に選択されたバスケットで動作する高度なシステムです。これらのペアは、その多様な特性と市場行動のために戦略的に選ばれました: USDJPYやUSDCHFのような主要なペアは、高い流動性と狭いスプレッドを提供し、頻繁な取引に最適です AUDUSDやNZDUSDのようなコモディティリンクのペアは、資源豊かな経済に対するエクスポージャーを提供し、ユニークな取引機会を提供します AUDCADやCHFJPYのようなクロスペアは、興味深い相関関係を示し、しばしば良好なトレンドを形成し、主要なペアを補完します この組み合わせは、さまざまな市場条件で良好なパフォーマンスを発揮できるバランスの取れたポートフォリオを確保します 選択されたペアは、異なる地理的地域と経済要因を代表し、分散を強化し、全体的なリスクを低減します 独自のマルチシンボル戦略を採用することで、Harmony Driveはさまざまな市場条件に適応し、Ichimoku Cloud、移動平均線、RSI、Bol
Hercules AI MT4
Aleksandr Chebotaev
3.5 (2)
Hello, my name is Alexander. I would like to introduce you to my new development, the Hercules AI advisor. The advisor is synthesis of Price Action Method and Artificial Intelligence technologies.  It doesn't use  any indicators. The EA works well on Gold  pair. The advisor has shown stable performance for more than 10 years. It does not use dangerous trading methods such as martingale, etc. All transactions are protected by take profit and stop loss. I tried to make the advisor as easy to insta
Ai Multi Trend MT4
Mansour Babasafary
5 (5)
21% discount, until 2024.08.08  (Original price: $1000) Get a 50% bonus by buying (or even renting) any of our products. After buying (or renting), send a message for more information. Expert trend hunter Combined with artificial intelligence Control the AI with a variety of simple settings Without using dangerous strategies (all trades have a profit limit and a loss limit) Can be used in 6 main market currency pairs and 4 important time frames An expert who has been trained by artifi
The Sequoia Expert Advisor is a professional market analyst working using a specialized algorithm. Based on the analysis of prices over a specific time interval, it reveals the strength and amplitude of prices using a unique indication system based on real data. When the strength of the trend and its direction changes, the expert closes the current position and opens a new one. The bot's algorithms include signals about overbought and oversold markets. A purchase occurs if the signal falls belo
ご紹介     Quantum Gold Empire EA は 、有名な XAUUSD (GOLD) ペアの取引方法を変革する画期的な MQL5 エキスパート アドバイザーです。 13年以上の取引経験を持つ経験豊富なトレーダーのチームによって開発されました。 重要!購入後、インストールマニュアルとセットアップ手順を受け取るためにプライベートメッセージを送ってください。 ***Quantum Gold Empire EA を購入すると、Quantum Trade EA を無料で入手できます!*** 詳細については個別にお問い合わせください。 ライブ信号:   ここをクリックしてください MT5バージョン:   ここをクリック 量子EAチャネル:       ここをクリック 高度なアルゴリズムを活用したエキスパートアドバイザーは、あらゆる一瞬の機会を活用し、最適なエントリーとエグジットを保証します。 リアルタイムの適応性:     金市場はダイナミックな性質を持っているため、迅速な調整が必要です。当社のアドバイザーは、変化する市場状況にシームレスに
作者のその他のプロダクト
This is a very nice EA which is running on Trend basis on EMA settings, very good returns, with SL and TP, if trade goes in loss the next trade according to loss can adjust this EA, I am uploading the back test of that EA as well, you can see that as well. You will never find that trending base EA in that price from anywhere, I am using this EA since almost 01 year and on my profiles you can see some live accounts as well.
The Moving Average Convergence Divergence (MACD) is a popular technical analysis tool used by traders and analysts to identify trends and potential buy or sell signals in a financial instrument, such as a stock, currency pair, or commodity. It's essentially a combination of two moving averages, often referred to as the "fast" and "slow" moving averages. Here's how the MACD is calculated: Fast Moving Average (12-period EMA): This is a 12-period Exponential Moving Average (EMA) of the asset's pric
This EA Scalping is a trading strategy where traders aim to make small profits from frequent, short-term price fluctuations in the market. It involves opening and closing positions within a very short time frame, sometimes even within seconds or minutes. Traders who employ scalping strategies often make numerous trades throughout a trading session, aiming to capture small price movements. Expert Advisors (EAs) are automated trading systems that can execute trades on behalf of traders based on pr
The EA Ichimoku Cloud consists of several components: Tenkan-sen (Conversion Line) : This is a short-term moving average that indicates the market's short-term trend. Kijun-sen (Base Line) : This is a longer-term moving average that gives insight into the market's medium-term trend. Senkou Span A (Leading Span A) : This forms one edge of the Ichimoku cloud and is calculated by averaging the Tenkan-sen and Kijun-sen. It helps identify potential support and resistance levels. Senkou Span B (Leadin
An EA Engulfing Candle is a significant pattern in technical analysis often used in financial markets, especially in trading stocks, forex, and other assets. It occurs on candlestick charts and is a reliable indicator of potential trend reversals or continuation. An Engulfing Candle consists of two consecutive candlesticks, usually representing two trading periods (e.g., two days for daily charts). The second candlestick "engulfs" the first one, meaning its body completely covers the body of the
EA Envelopes
Zafar Iqbal Sheraslam
The "EA Envelopes" indicator, often referred to as "Moving Average Envelopes," is a technical analysis tool used in financial markets to identify potential trends and trading opportunities. It consists of two lines plotted above and below a moving average of a security's price. Here's how the Envelopes indicator works: Calculation of Moving Average : A simple moving average (SMA) is calculated for the price of a financial instrument over a specified time period. This moving average represents th
The EA Candle Body SizeX2 strategy is a trading approach that focuses on the size of candle bodies in a price chart. Candlestick charts are a popular tool in technical analysis, used by traders to make decisions about buying or selling assets like stocks, forex, or cryptocurrencies. In the context of the "Candle Body SizeX2" strategy, here's how it generally works: Candlestick Analysis : Candlestick charts represent price movements over a specified period, typically showing open, close, high, an
This "EA EMA High & Low Price" refers to the concept of using Exponential Moving Averages (EMA) in the context of tracking the highest (high) and lowest (low) prices of a financial instrument, such as a stock, currency pair, or commodity. The Exponential Moving Average is a widely used technical analysis tool that helps traders and analysts identify trends and potential reversals in price movements. In this context, the "EMA High & Low Price" approach involves calculating the Exponential Moving
Certainly! An EA (Expert Advisor) EMA (Exponential Moving Average) Trend Following Crossover strategy is a popular algorithm used in trading to identify trends in financial markets, such as stocks, forex, or cryptocurrencies. This strategy uses two Exponential Moving Averages with different periods to generate buy and sell signals based on their crossovers. Here's how it works: Exponential Moving Averages (EMAs): An Exponential Moving Average gives more weight to recent price data, making it mor
Certainly, I can explain a trading strategy using the EA of Commodity Channel Index (CCI) indicator. The CCI is a popular technical analysis tool used by traders to identify potential trend reversals, overbought, or oversold conditions in a market. Here's a basic CCI indicator strategy: Strategy Overview: The CCI indicator oscillates around a zero line, providing signals based on its position relative to this line. This strategy involves using CCI to identify potential trend reversals and overbo
The EA Fractals Alligator strategy is a trading strategy popularized by Bill Williams, a famous trader and author of the book "Trading Chaos." It is a part of his broader trading system called the "Chaos Theory" and is based on the use of three moving averages, which he refers to as the "Alligator." The Alligator consists of the following three moving averages: Alligator's Jaw (Blue Line): This is a 13-period Smoothed Moving Average (SMA) moved 8 bars into the future. Alligator's Teeth (Red Line
An EA (Expert Advisor) scalping strategy is a trading approach in the foreign exchange (Forex) or other financial markets that utilizes automated trading software to make a large number of small, quick trades to profit from short-term price movements. Scalping is a high-frequency trading strategy where traders aim to capture small price fluctuations within a very short time frame, often seconds or minutes. Here are some key elements to consider when developing or using an EA scalping strategy: T
EA Martingale is a popular betting strategy that has been applied to various forms of gambling, including trading and investing. However, it's important to note that Martingale strategies can be extremely risky and are not recommended for serious financial endeavors, as they can lead to substantial losses. This strategy relies on the idea of doubling your bet after each losing trade in the hope of eventually making a profit. Here's how you might apply a Martingale strategy in the context of Elec
Certainly! An EA (Expert Advisor) Heiken Ashi strategy is a trading algorithm designed to automate trading decisions based on Heiken Ashi candlestick patterns. Heiken Ashi is a type of candlestick charting technique that aims to filter out noise and provide a smoother representation of price trends. It does this by averaging price data over a specified period. Here's a simple outline of how you can create an EA Heiken Ashi strategy: Heiken Ashi Calculation : You need to implement the Heiken Ashi
The term "EA Slope of Moving Average" likely refers to a concept related to trading and technical analysis, particularly in the context of using Expert Advisors (EAs) in trading platforms like MetaTrader. Here's an explanation of each part of the term: EA (Expert Advisor) : An EA is a software program used in MetaTrader and other trading platforms to automate trading strategies. Traders can create or purchase EAs to execute trades based on predefined rules, algorithms, or indicators. Slope : In
The EA (Expert Advisor) Distance of Bollinger Bands is a trading strategy or algorithm used in financial markets, particularly in Forex trading. Bollinger Bands are a technical analysis tool that consists of a middle band (usually a simple moving average) and two outer bands (standard deviations of the middle band). The EA Distance of Bollinger Bands strategy focuses on measuring the distance between the price and the Bollinger Bands to make trading decisions. Here's how the EA Distance of Bolli
Creating a trading strategy using the Moving Average Convergence Divergence (MACD) indicator can be a powerful tool for traders looking to identify trends and potential entry/exit points in the financial markets. Here's a simple MACD-based trading strategy: Strategy Name: MACD Trend-Following Strategy Timeframe: This strategy can be applied to various timeframes, but it's commonly used on daily or 4-hour charts. Indicators: MACD (Moving Average Convergence Divergence): This consists of three com
"EA RSI Martingale" likely refers to a trading strategy or Expert Advisor (EA) used in the foreign exchange (Forex) or financial markets. Let's break down what each of these terms means: EA (Expert Advisor): An EA is an automated trading system or software program that can be used on trading platforms like MetaTrader. It is designed to execute trading strategies based on predefined rules without the need for human intervention. RSI (Relative Strength Index): RSI is a popular technical indicator
Certainly! An EA Exponential Moving Average (EMA) strategy is a trading or investment approach used in financial markets, particularly in the context of stocks, cryptocurrencies, and other assets. Here's an explanation in English: An Exponential Moving Average (EMA) strategy is a popular method employed by traders and investors to analyze price trends in financial markets. It's a technical analysis tool that helps identify potential buying or selling opportunities based on historical price data.
Creating a Forex trading strategy based on random patterns is generally not a recommended approach for successful trading. Forex trading is a complex financial market where traders use various strategies, technical and fundamental analysis, risk management, and market knowledge to make informed decisions. Relying on random patterns is more akin to gambling and is unlikely to yield consistent profits in the long term. Successful Forex trading strategies typically involve careful analysis and plan
The EA Three Hammer Candlesticks Strategy is a candlestick pattern-based trading strategy used in technical analysis to identify potential trend reversals in financial markets, particularly in stocks, forex, and commodities. The strategy focuses on three specific candlestick patterns: the Hammer, the Inverted Hammer, and the Shooting Star. These patterns can provide valuable information about market sentiment and potential price reversals. Here's how the strategy works: The Hammer: The Hammer is
For Live Results with the same EA Powerful Candle click the link below for signal copying and see the live trades as well. https://www.mql5.com/en/signals/2073310 The "Powerful Candle Strategy" is a trading strategy commonly used in financial markets, especially in the realm of technical analysis. This strategy relies on identifying specific candlestick patterns to make trading decisions. Candlestick patterns are graphical representations of price movements in a given time frame, typically on
The EA of Bollinger Bands are a popular technical analysis tool used by traders and investors to analyze price volatility and potential price reversal points in financial markets, such as stocks, forex, or cryptocurrencies. They consist of three lines: The middle band: This is typically a simple moving average (SMA) of the price over a specific period. The most common period used is 20. The upper band: This is the sum of the middle band and twice the standard deviation of the price over the same
"RSI" usually refers to the Relative Strength Index, a technical indicator used in financial markets to analyze the strength or weakness of an asset's price. "Pending Grid" may suggest a specific trading strategy that combines pending orders with grid trading techniques. RSI EA : RSI (Relative Strength Index) is a technical indicator used in trading to assess whether an asset is overbought or oversold. It measures the speed and change of price movements. RSI values range from 0 to 100. Typically
Achieving a high win rate in various activities, such as gaming, investing, or sports, often requires a combination of skill, strategy, and discipline. Here are some general principles that can help you develop a high win rate strategy: Skill Development: Mastery of the fundamentals is crucial. Whether it's a game, a financial market, or a sport, invest time in learning the basics and continually improving your skills. This might involve studying strategies, practicing regularly, or seeking out
Reverse Martingale, also known as the "Paroli" betting system, is a gambling strategy used primarily in games of chance such as roulette, blackjack, or even sports betting. Unlike the traditional Martingale system, where a player doubles their bet after a loss, the Reverse Martingale involves increasing the bet after a win and reducing it after a loss. This strategy is often employed by individuals hoping to take advantage of winning streaks and capitalize on short-term gains. Here's how the Rev
A Bollinger Bands hedge strategy is a trading strategy that utilizes Bollinger Bands to make trading decisions and manage risk. Bollinger Bands are a technical analysis tool that consists of a middle band (usually a simple moving average) and two outer bands that are typically set at a certain number of standard deviations away from the middle band. These bands expand and contract based on market volatility. Here's a basic outline of a Bollinger Bands hedge strategy: Objective : The primary goal
The Gold Killer support and resistance strategy with Trilling Stop loss is a trading method that focuses on identifying key levels where the price of gold tends to find support (stop falling) and resistance (stop rising). Here's a breakdown of how to apply this strategy effectively: Best Time Frame: 01 Hour Works only on Gold: Minimum Deposit 10K If someone wants for Currencies DM Me. 1. Understanding Support and Resistance Support Level: A price level where a downtrend can be expected to pause
フィルタ:
レビューなし
レビューに返信