• 概要
  • レビュー (2)
  • コメント (6)
  • 最新情報

ON Trade Waves Patterns Harmonic Elliot Wolfe

5

ON Trade Waves Patterns Harmonic Elliot Wolfeをご紹介します。これは手動および自動の方法を使用して市場のさまざまなパターンを検出するために設計された高度なインジケーターです。以下はその動作方法です:

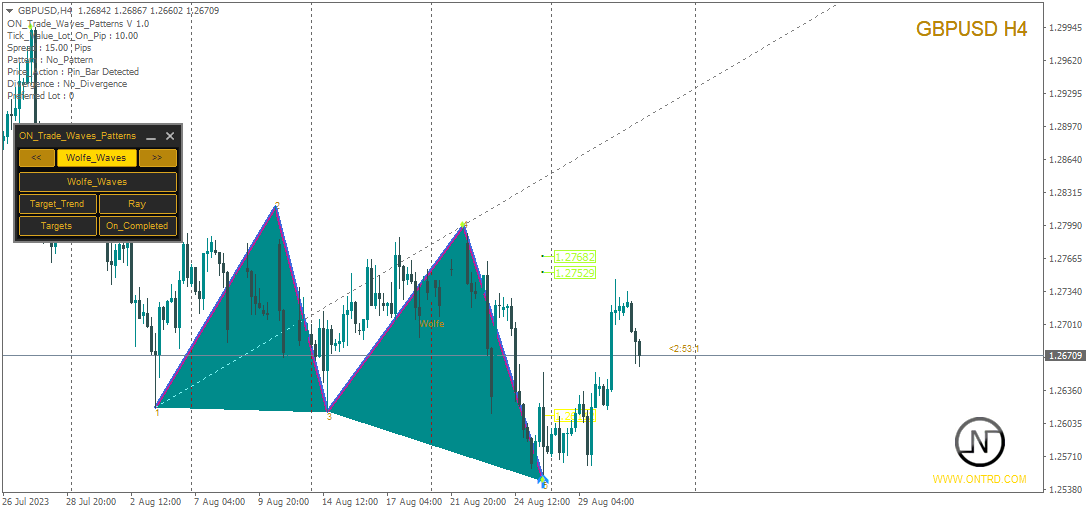
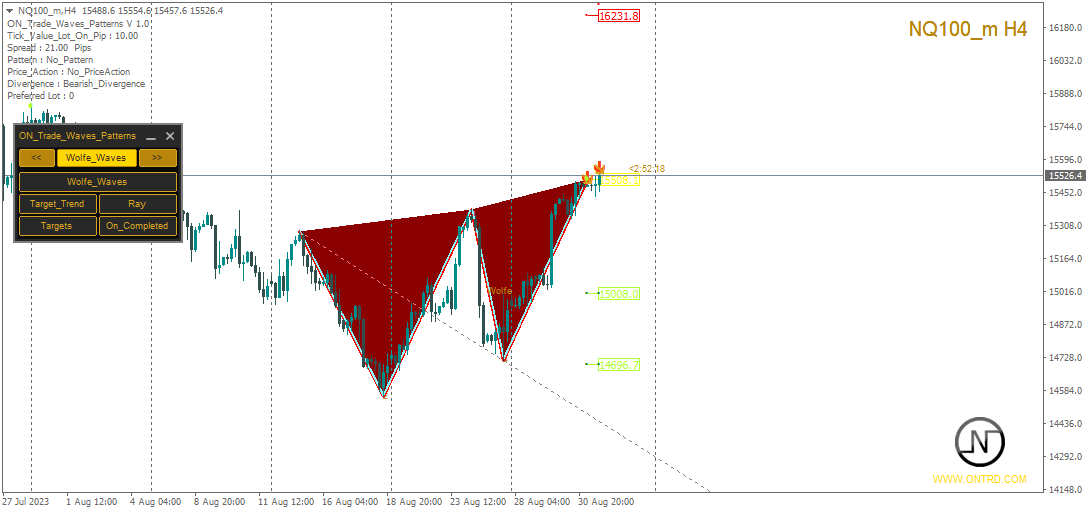
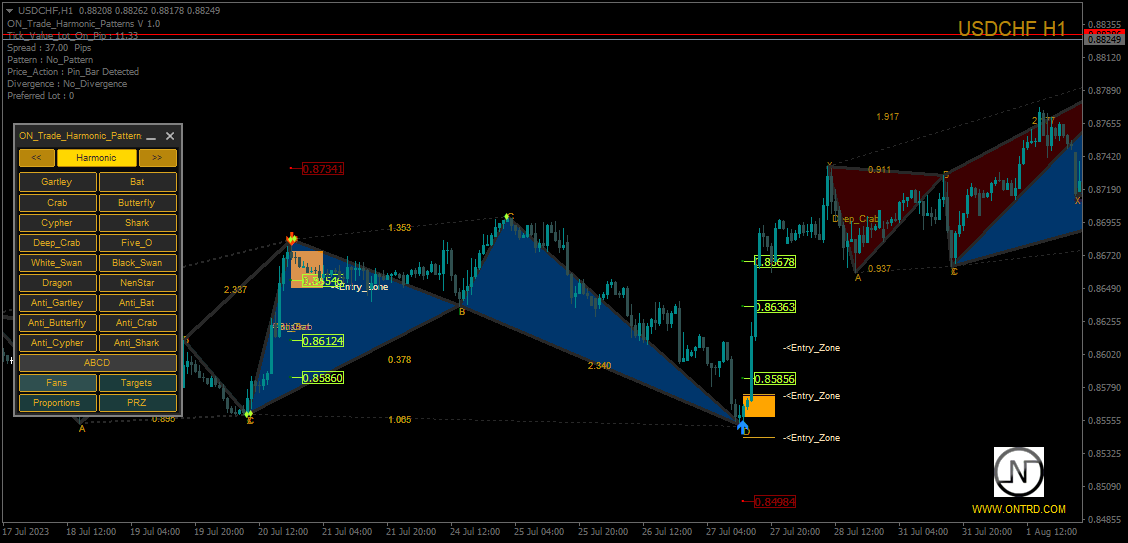
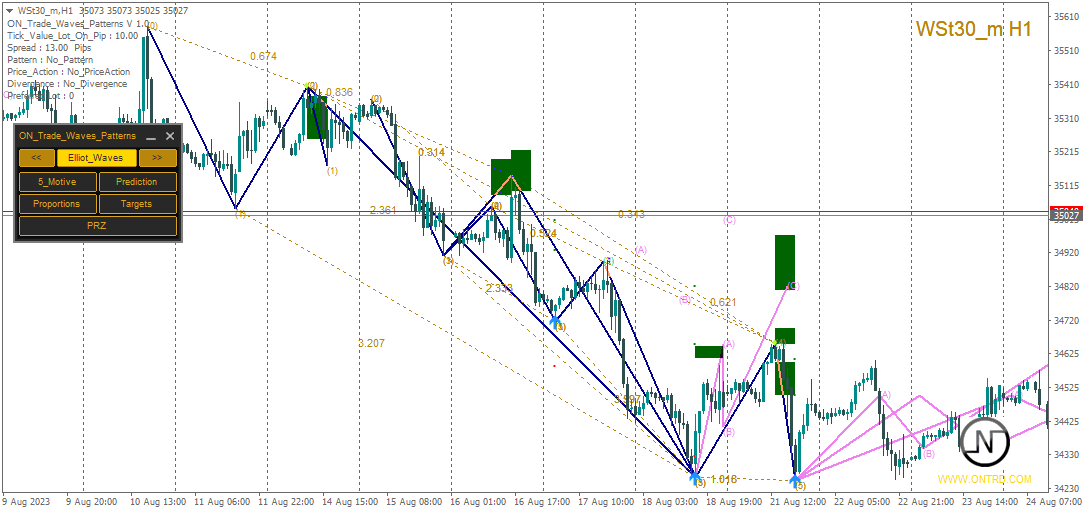
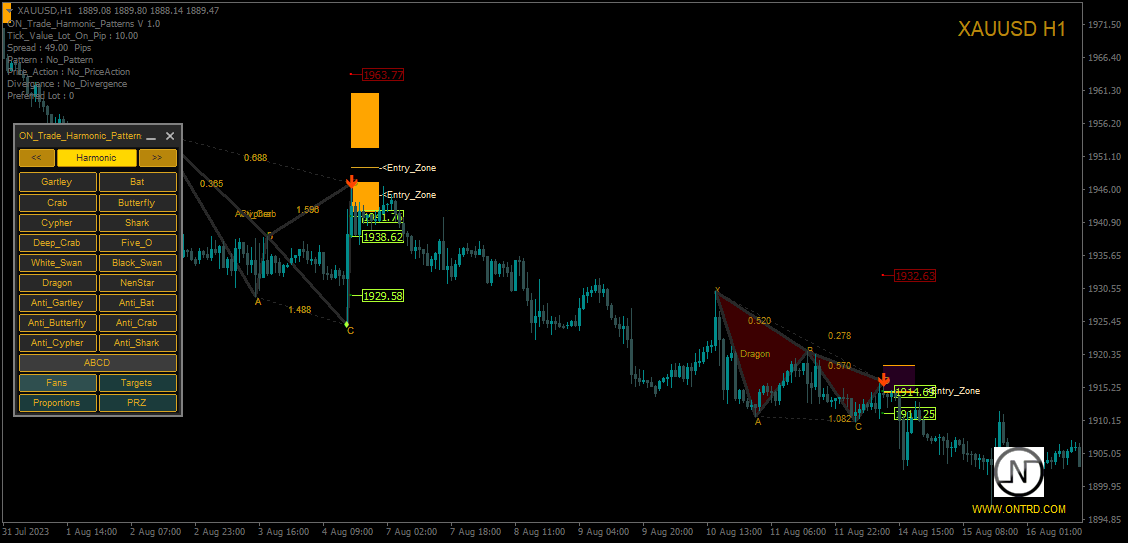
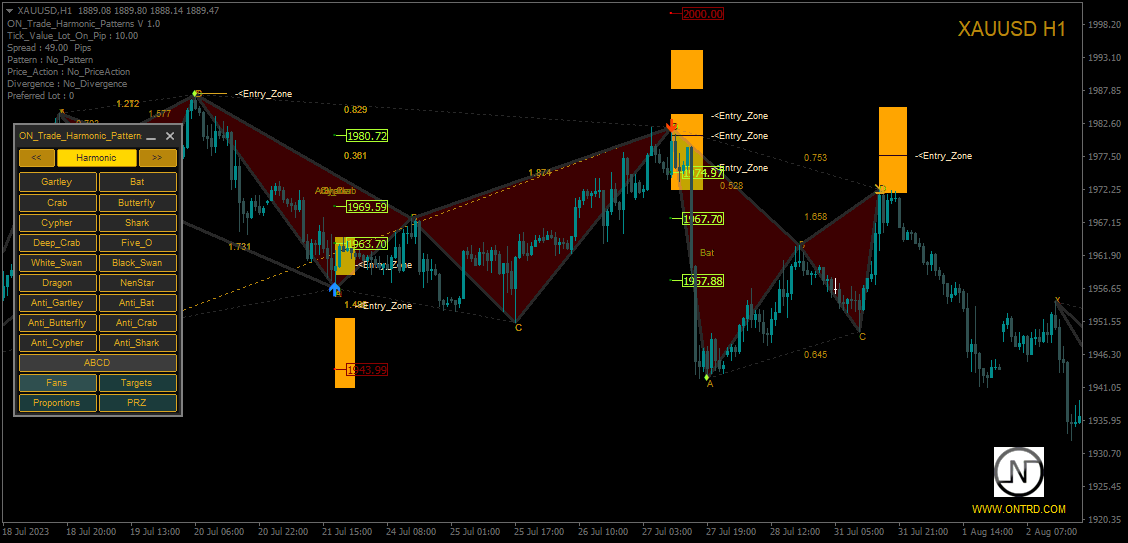
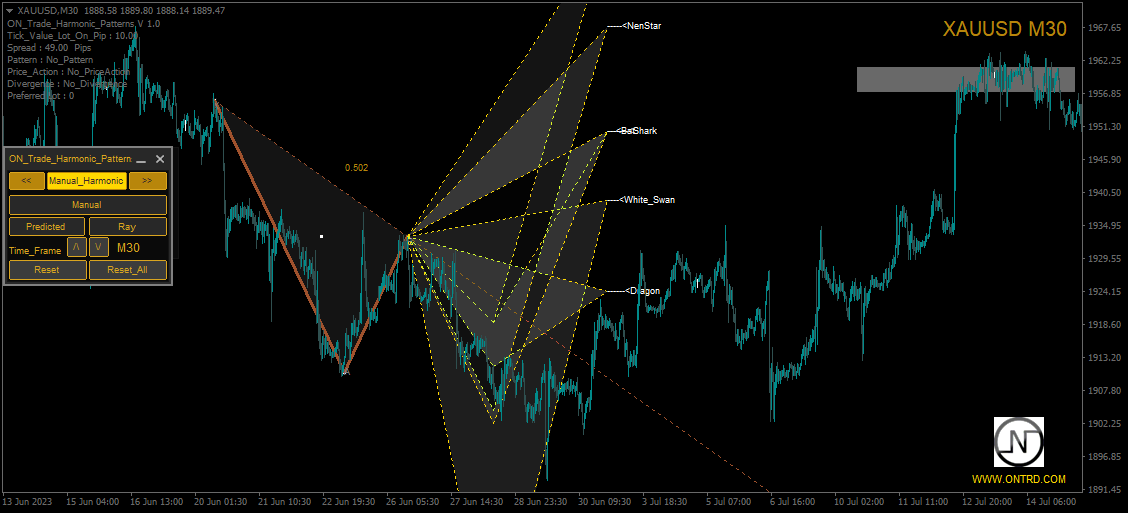
ハーモニックパターン: このインジケーターは、チャートに表示されるハーモニックパターンを識別できます。これらのパターンは、Scott Carneyの「Harmonic Trading vol 1および2」で説明されているように、ハーモニックトレーディング理論を実践するトレーダーにとって重要です。手動で描画するか、自動検出に頼るかにかかわらず、ON Trade Waves Patternsがお手伝いします。

コントロールパネル: このインジケーターはユーザーフレンドリーなコントロールパネルを備えています。チャートと時間枠の設定を保存し、異なる構成間をスムーズに切り替えることができます。チャートスペースを最大限に活用するために最小化することもできます。他の分析ツールで作業することを好む場合、閉じるボタンをクリックするだけで、すべてのインジケーターデータを非表示にできます。

テンプレートの保存: 設定をカスタマイズしたり、移動平均線やボリンジャーバンドなどの他のインジケーターを追加したりする際、このインジケーターは自動的にテンプレートを保存します。これにより、必要なときに好みの設定を簡単に読み込むことができます。

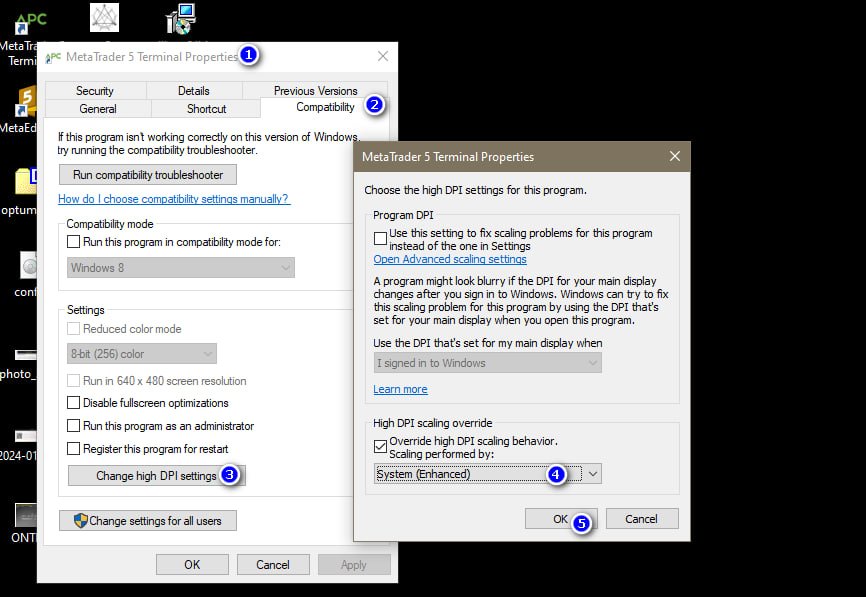
最適な表示: Windows 10ユーザー向けに、HDデバイスで最適な画面体験を得るためにDPI設定を調整することをお勧めします。MetaTraderアイコンを右クリックし、「互換性」を選択し、「高DPI設定の変更」を選択し、「システム(強化)」に設定してください。

追加の機能: ON Trade Waves Patterns Harmonic Elliot Wolfeはハーモニックパターンに限らず、さまざまな価値ある機能も提供します。

  • 価格と時間のアラートラインで常に情報を提供します。
  • 検出したパターンを補完するためのフィボナッチファンを描画します。
  • 高度な分析のためのピボット、カマレラ、パターンレイを提供します。
  • 高い時間枠から低い時間枠に手動で描画されたオブジェクトを読み込む機能を備えています。
  • シグナルとしてターゲット、ストップレベル、エントリーポイントを提供するアラートおよび通知システムを備えています。
  • 追加の確認として黄色とオレンジの矢印でダイバージェンスを検出します。
  • 各パターンに対する最適なロットサイズを自動計算し、リスクを効果的に管理します。
  • ピンバー、インサイドバー、アウトサイドバーなどの価格アクションパターンも認識します。

Expert Advisors(EA)との統合: アルゴリズムトレーディングに興味がある場合、このインジケーターのバッファーを提供されたコードを使用してEAに統合できます。

ON Trade Waves Patterns Harmonic Elliot Wolfeはパターン認識と分析のための包括的なツールで、トレーディング戦略を向上させるための多くの機能を提供しています。

この強力なインジケーターについて詳しくは、ユーザーマニュアルをご覧いただくか、[リンクを挿入]でご確認ください。今日からトレーディングポテンシャルを最大限に活用しましょう!


レビュー 2
Sameer Haque
528
Sameer Haque 2023.09.10 16:06 
 

Highly accurate and very versatile. A great addition to my toolkit.

おすすめのプロダクト
Introduction to X3 Chart Pattern Scanner X3 Cherart Pattern Scanner is the non-repainting and non-lagging indicator detecting X3 chart patterns including Harmonic pattern, Elliott Wave pattern, X3 patterns, and Japanese Candlestick patterns. Historical patterns match with signal patterns. Hence, you can readily develop the solid trading strategy in your chart. More importantly, this superb pattern scanner can detect the optimal pattern of its kind. In addition, you can switch on and off individu
Elliott Wave Trend was designed for the scientific wave counting. This tool focuses to get rid of the vagueness of the classic Elliott Wave Counting using the guideline from the template and pattern approach. In doing so, firstly Elliott Wave Trend offers the template for your wave counting. Secondly, it offers Wave Structural Score to assist to identify accurate wave formation. It offers both impulse wave Structural Score and corrective wave Structure Score. Structural Score is the rating to sh
Introduction to Harmonic Volatility Indicator Harmonic Volatility Indicator is the first technical analysis applying the Fibonacci analysis to the financial volatility. Harmonic volatility indicator is another level of price action trading tool, which combines robust Fibonacci ratios (0.618, 0.382, etc.) with volatility. Originally, Harmonic Volatility Indicator was developed to overcome the limitation and the weakness of Gann’s Angle, also known as Gann’s Fan. We have demonstrated that Harmonic
Gartley Projection D
Oleksandr Medviediev
3.71 (7)
このインジケーターは、H.M.Gartley (「株式市場の利益」、1935 年) の開発に従って調和パターン (XABCD) を識別します。 D 点を透視投影の点として投影します (設定で ProjectionD_Mode = true を指定します)。 再描画はしません。 作業時間枠のバーが閉じるとき、特定されたパターン ポイントが Patterns_Fractal_Bars バーの間に移動していない場合、チャート上に (予想される価格変動の方向に) 矢印が表示されます。 この瞬間から、矢印はチャート上に永久に残ります。 連続した 2 ~ 3 つ以上の矢印 - これは市場状況の変化であり、再描画/再描画ではありません (時間枠を前後に切り替えてはなりません)。 注: 2 ~ 3 つ以上の矢印が連続している場合 - これは市況の変化であり、再描画ではありません。 パターンの総数は 85 です (Gartley-222 と Gartley-222WS を含む。完全なリストはコメント セクションにあります)。 識別されたすべてのパターンのうち、最後に識別されたパター
Introduction Harmonic Patterns are best used to predict potential turning point. Traditionally, Harmonic Pattern was identified manually connecting peaks and troughs points in the chart. Manual harmonic pattern detection is painfully tedious and not suitable for everyone. You are often exposed under subjective pattern identification with manual pattern detection. To avoid these limitations, Harmonic Pattern Plus was designed to automate your harmonic pattern detection process. The functionality
BeST_Gann Swing Oscillator is an MT4 indicator that is based on the corresponding work of Robert Krausz who introduced it in the book “ A.W.D Gann Treasure Discovered ” . The Gann Swing Oscillator is a range-bounding technical indicator that oscillates between +1 and -1 and thus it describes the market swings. Generally when the market is in an upswing, the Gann Swing Oscillator describes it as 2 higher highs with the value of +1 while after an upswing, the downswing is expected. Also the do
ABCDEインジケーター このインジケーターは、価格アクションの主要なabcパターン(つまり、ブレイク、プルバック、ムーブメント)に基づいています。これらのパターンはラリーベースラリーパターンに似ており、トレンド分析やダイバージェンス分析などの一連の分析がチェックされ、正確なシグナルを発行します。それはかなり正確な取引シグナルを提供し、トレードを開始し、終了するのが最適なタイミングを伝えます。これは、外国為替、暗号通貨、金属、株式、指数など、どんな金融資産にも適用できます。 主な特徴: •    非常に使いやすい •    マルチタイムフレームアラート •    固定価格でストップロスとテイクプロフィットのオーダーが可能。 •    どんな取引インストゥルメントとも連携可能(Forex、CFD、Futures その他) •    メール通知 •    電話通知 •    かなり正確なトレードシグナルを提供し、いつトレードを開始・終了するのが最適かを教えてくれます。 •    オープニングライン、ストップロス、テイクプロフィットをグラフ上に表示します。
Reversal Pattern Pro
Boonyapagorn Rodvattanajinda
Reversal Patterns Pro Reversal Patterns Pro is a Price Action (PA) analytical tool that scans the reversal patterns.  - Finds and marks the most dependable Japanese candlestick patterns in real-time. - Supports all time frames (Best for Scalping) - Doesn't repaint making it an exceptional indicator for Expert Advisors. Input parameters : - Support & Resistance Mode ( true or false ) for enabling advanced filtering - Donchian Period - RSI Period - RSI Oversold Level - RSI Overbought Level - 
Thanks to this indicator, you can easily see the new ABCD harmonic patterns in the chart. If the two price action lengths are equal, the system will give you a signal when it reaches the specified level. You can set the limits as you wish. For example, You can get the signal of the price, which occurs in the Fibonaci 38.2 and 88.6 retracements, and then moves for the same length, at the level you specify. For example, it will alarm you when the price reaches 80% as a percentage. In vertic
El indicador "MR BEAST ALERTAS DE LIQUIDEZ" es una herramienta avanzada diseñada para proporcionar señales y alertas sobre la liquidez del mercado basándose en una serie de indicadores técnicos y análisis de tendencias. Ideal para traders que buscan oportunidades de trading en función de la dinámica de precios y los niveles de volatilidad, este indicador ofrece una visualización clara y detallada en la ventana del gráfico de MetaTrader. Características Principales: Canal ATR Adaptativo: Calcula
Introduction to Smart Renko The main characteristics of Renko Charting concern price movement. To give you some idea on its working principle, Renko chart is constructed by placing a brick over or below when the price make the movement beyond a predefined range, called brick height. Therefore, naturally one can see clear price movement with less noise than other charting type. Renko charting can provide much clearer trend direction and it helps to identify important support and resistance level
The indicator is designed to work on any trading platform. The program is based on proprietary algorithms and W.D.Ganna's mathematics, allowing you to calculate target levels of price movement based on three points with the highest degree of certainty. It is a great tool for stock trading. The indicator has three buttons: NEW - call up a triangle for calculation. DEL - delete the selected triangle. DELS - completely remove all constructions. The probability of achieving the goals is more than 80
This inside bar indicator MT4  is suitable if you are doing inside bar trading. So what this MT4 inside bar indicator does is identifies inside bars for you as they form on your charts. Inside bar is a famous trading pattern in which the bar carry higher low and lower high compared with the previous bar, also known as mother bar. With, a lesser time frame like the 1 hour chart, daily inside bar chart will sometimes appears to be similar to a triangle pattern. Inputs AlertOn - enable alerts Ema
FREE
AndInvest Impulse
Bruno Ravardiere De Oliveira Goncalves
Em uma negociação no Mercado Financeiro nada é mais importante que saber o momento certo de entrar em uma negociação. O AndInvest Impulse auxilia traders a capturar o momento exato de abrir uma negociação, para isto ele desenha topos e fundos facilitando a leitura do Price Action e após um breve momento de realização do mercado ele identifica o retorno da ponta compradora ou vendedora de força antecipada e sem repintura. Comprovação de Resultados: https://youtu.be/CA1_ZtZY0vk Funciona em qualque
The reason why many traders new to using the Fibonacci retracement tool find it hard to effectively use it is because they are having trouble identifying swing points that are significant enough to be considered. Main Features Show Fibonacci number with LL to HH in multitimeframe Show 23.6,38.2,50,61.8,78.6,88.6,100,112.8,127.2,141.4,161.8,200,224,261.8,314,361.8 and 423 of Fibonacci number Easy to use with simple interface. Real time information for the Fibonacci number . Settings Global
Introduction to Chart Pattern MT Chart Pattern MT is a chart pattern scanner to detect the triangle pattern, falling wedge pattern, rising wedge pattern, channel pattern and so on. Chart Pattern MT uses highly sophisticated chart pattern detection algorithm. However, we have designed it in the easy to use with intuitive user interface. Chart Pattern MT will show all the patterns in your chart in the most efficient format for your trading. You do not have to do tedious manual pattern detection an
Monster Harmonics Indicator is a harmonic pattern indicator. It recognizes Gartley, Bat, Crab, Butterfly, Cypher, White Swan, Black Swan, Shark and several other patterns. Projected patterns that are not yet completed are recognized, too. Monster even shows the PRZ (Potential Reversal Zone). Users can add their own user defined patterns to Monster. Besides the current pattern, Monster also shows all patterns in the symbols history. Monster will provide alerts for developing patterns. Introduced
Black series MT4 - The indicator is designed for trading on binary options with Timeframe M1-M5-M15 Multicurrency (Works on cryptocurrency and currency pairs) The signal appears when the candle opens Up to 90% correct signals There is no signal redrawing at all Can be used with other indicators. Good for scalping! In Settings there is: -Indicator working methods -I Allert Arrow color Red signal down Blue signal up Also watch the video how the indicator works and signals
Introduction to Fractal Pattern Scanner Fractal Indicator refers to the technical indicator that makes use of the fractal geometry found in the financial market. Fractal Pattern Scanner is the advanced Fractal Indicator that brings the latest trading technology after the extensive research and development work in the fractal geometry in the financial market. The most important feature in Fractal Pattern Scanner is the ability to measure the turning point probability as well as the trend probabi
Trend lines master
The Trading Team Ltd
5 (1)
Launch promotion For a limited time only:  30$ instead of 157$ Summary Create precise trend lines in a second Description This indicator will draw your trend lines automatically with great precision, saving you some precious time. It uses Bill Williams Fractals to identify the key points and draws both inner and outer trend lines. Features Automatically draws precise trend lines
Gioteen Volatility Index (GVI)   - your ultimate solution to overcoming market unpredictability and maximizing trading opportunities. This revolutionary indicator helps you in lowering your losing trades due to choppy market movements. The GVI is designed to measure market volatility, providing you with valuable insights to identify the most favorable trading prospects. Its intuitive interface consists of a dynamic red line representing the volatility index, accompanied by blue line that indicat
This indicator detects Inside Bar Narrow Range 4 and Inside Bar Narrow Range 7 two powerful patterns on 28 pairs on all timeframes.  "Inside Bar Narrow Range 4"  is an inside bar with the narrowest range out of the last 4 bars so "Inside Bar Narrow Range 7" an inside bar with the narrowest range  out of the last 7 bars. Hence, IBNR4 and better IBNR7 are an objective criterion for identifying  decreased range and volatility. Once we find an IBNR4 or an IBNR7 pattern, we aim to trade the breakou
UPDATE: Works EXTREMELY well for EURJPY! --> more than 66% win rate monthly Guarantee! I want to introduce you the next-gen unique adaptive Binary options Indicator. This will destroy EURUSD & EURJPY The Raven is so sharp and efficient that it will pick the tops and bottoms of ANY type of market. Can also be used as a Forex Scalper. The Raven signal is based on multiple confirmation analysis. Gets confirmation from the most consistent signals known to man; Ichimoku, SMA, Bollinger Bands; and als
このインジケーターは、実際の取引に最適なウェーブ自動分析インジケーターです。 バンドの標準化された定義は、もはや異なる人々の波ではなく、人為的な干渉の描画が排除されます。これは、アプローチの厳密な分析において重要な役割を果たします。           現在購入割引!   =》 Increase the choice of international style mode, (red fall green rise style) インデックスの内容: 1.1。       基本波: まず、価格変動過程で基本変動の変曲点を見つけましたが、もちろん、彼の注文はそれほど強くないので、次の計算の基礎になります。 2.2。       二次帯域 :基本波に基づいて、アルゴリズム分析を通じてより明白な二次帯域が得られ、二次帯域は波解析の基礎を提供します 3.3。       波: より明確な傾向とより明確で直感的な方向性があります。波が続くかどうかを分析するには、二次波帯の形状を調べ、二次波の組成を分析して、その後の予測を取得する必要があります。波。 4.4。       チャネ
This is an arrow indicator without a future function,developed based on the most advanced profit trading algorithms.It has the most innovative and advanced dual trend analysis module, as well as the latest and highly effective market trend prediction algorithm.Trends are your friends, and following larger trends can earn the maximum profit in foreign exchange. This indicator helps traders identify current trends and track them. Someone once made a profit of 10 times in a week by relying on it.No
This indicator identifies the major and minor swing high and low points on a chart. It then takes the most recent swing and draws a fibonacci pattern of retracement and extension levels to give you an idea of where price may move next. It allow allows you to set a pair of moving averages to help identify the direction of the overall trend. There are configuration parameters for the major and minor swing and the moving averages.
Auto Level this tool is able to determine the levels of support and resistance. search and display when the price has broken through the level and when it pushed off from it. the indicator can be useful if you use resistance support levels in your trading. or the highs and lows of the price, then it will greatly simplify your work and help you more quickly and more accurately determine the rebound or breakdown of the current trend or tendencies level. blue line bottom uptrend red line on top dow
MIDAS Trading Tools
Carl Gustav Johan Ekstrom
4.67 (15)
The introduction of the MIDAS Trading Tools indicator represents the culmination of my trading expertise and innovative application. By incorporating new concepts and collaborating with fellow traders like Robert Young (US), we have enriched and enhanced this indicator. In the sections below, you'll find detailed descriptions of the variables comprising this indicator. MIDAS which is an acronym for Market Interpretation/Data Analysis System is the innovative work of the late technical analyst P
The Penta-O is a 6-point retracement harmonacci pattern which usually precedes big market movements. Penta-O patterns can expand and repaint quite a bit. To make things easier this indicator implements a twist: it waits for a donchian breakout in the right direction before signaling the trade. The end result is an otherwise repainting indicator with a very reliable trading signal. The donchian breakout period is entered as an input. [ Installation Guide | Update Guide | Troubleshooting | FAQ | A
トレンドトレーディング は、タイミングのプルバックとブレイクアウトにより、市場で起こっているトレンドから可能な限り利益を得るように設計された指標です。確立されたトレンドの中で価格が何をしているかを分析することにより、取引の機会を見つけます。 [ インストールガイド | 更新ガイド | トラブルシューティング | よくある質問 | すべての製品 ] 自信を持って効率的に金融市場を取引する むち打ちにならずに確立されたトレンドから利益を得る 収益性の高いプルバック、ブレイクアウト、早期の逆転を認識する この指標は、独自の品質とパフォーマンスを分析します 複数時間枠のダッシュボードを実装します インジケーターは再描画されていません 電子メール/音声/視覚アラートを実装します 確立されたトレンドは多くの取引機会を提供しますが、ほとんどのトレンド指標はそれらを完全に無視しています。インジケーターの解釈はかなり簡単です: (1) トレンドの変化 (2) トレンドの方向への後退 (3) トレンドの方向へのブレイクアウト 赤いダッシュ は下降トレンド中の修正です 青いダッシュ は上昇ト
このプロダクトを購入した人は以下も購入しています
製品を購入する前に、以下の情報をお読みください。 Apollo Pips PLUS SP はユニークな製品です。これは、私の新しい「アポロ ピップス」インジケーターと、私のすべての取引インジケーターにアクセスできる「スーパー パック」ボーナスを手に入れたい人のためのものです。 Apollo Pips PLUS SP 製品を購入すると、実際には私の Apollo Pips インジケーターのまったく新しいバージョンを購入することになります。このバージョンのインジケーターには改良されたアルゴリズムと使いやすいパラメーターがあり、あらゆる市場およびあらゆる取引スタイルでインジケーターを使用する機会が得られます。 この製品の購入者は、私のスーパーボーナスとして、他のすべてのインジケーターにも無料でアクセスできます!私のすべての取引ツールにアクセスしたい場合は、この製品が最適です!:) しかし、これがすべてではありません!:) この製品のすべての購入者は、私の新しいインジケーターを無料で入手する資格もあります!:)新しい取引インジケーターを利用できるようになりました。私の特権のある「スーパー パッ
Gold Channel is a volatility-based indicator, developed with a specific timing algorithm for the XAUUSD pair, which consists of finding possible corrections in the market. This indicator shows two outer lines, an inner line (retracement line) and an arrow sign, where the theory of the channel is to help identify overbought and oversold conditions in the market. The market price will generally fall between the boundaries of the channel. If prices touch or move outside the channel it is a tra
PZ Day Trading
PZ TRADING SLU
3.67 (3)
このインディケータは、価格アクション分析とドンチャンチャネルのみを使用して、ジグザグ方式で価格の反転を検出します。再描画やバックペインティングを一切行わずに、短期取引向けに特別に設計されています。それは彼らの操作のタイミングを増やすことを目指している賢明なトレーダーにとって素晴らしいツールです。 [ インストールガイド | 更新ガイド | トラブルシューティング | よくある質問 | すべての製品 ] 驚くほど簡単に取引できます すべての時間枠で価値を提供します 自己分析統計を実装します 電子メール/音声/視覚アラートを実装します 可変長のブレイクアウトと混雑ゾーンに基づいて、インディケータは価格アクションのみを使用して取引を選択し、市場が非常に高速に行っていることに反応します。 過去のシグナルの潜在的な利益が表示されます この指標は、独自の品質とパフォーマンスを分析します 負けブレイクアウトは強調表示され、説明されます インジケータは、非バックペインティングおよび非再ペイントです この指標は、日中のトレーダーが単一の価格反転を見逃さないようにするのに役立ちます。ただし、す
Enigmera
Ivan Stefanov
5 (4)
エニグメラ:市場の中核 https://www.enigmera.com はじめに このインディケータと取引システムは、金融市場に対する驚くべきアプローチです。ENIGMERAは、フラクタルサイクルを使用して、サポートとレジスタンスレベルを正確に計算します。本格的な蓄積局面を示し、方向性と目標を示します。 トレンド中でも調整中でも機能するシステムです。 どのように作動するのか? ENIGMERAは、支持線・抵抗線、目標線、乖離線の3つのラインで構成されています。このシステムは、過去のデータを現在と未来に外挿する典型的な市場指標とは異なり、現在の完全な画像を提供します。支持線上にある場合、それは本当の支持を意味し、抵抗線上にある場合、それは本当の抵抗を意味する。ある水準が破られた場合、それはトレンドの変化を意味する。再描画はしない。 市場は常に進化しているため、ENIGMERAはその評価ツールを適応させ、定期的に戦略を修正しています。  これにより、すべてのシナリオが徹底的に評価されることが保証されます。この市場指標の独自性は、その能力を見れば明らかです。  ENIGM
最初のパルスレベルを反転 (RFI)     指示する     ロシア     -        utilizar con   el indicador の ESP 推奨事項 -   TPSpro トレンド プロフェッショナル版 -   MT5のバージョン 最も重要なことは、将来においても最も重要なことです。 機能のプリンシパル: ゾーンのほとんどは、ベンダーとコンプラドールによってアクティブ化されます。 状況を直感的に把握できるよう、初期の衝動を修正します。 LOGIC AI: MUESTRA zonas (círculos) parabuscar puntos de entrada cuando se activa una plantilla 視覚的に優れた視覚効果があり、最も重要な機能がすべて揃っていることに注意してください。 優れたニベレス/ゾーンの視覚化 (modo MTF) 世界で最も人気のある場所/ゾーンです。これを使用するのに最適な方法です (   TPSproTREND PRO   )。 アルゴリズム プロフェッショナル セパラド パソ ア パソ パラ オペラ それは
Connect Indicator is a tool used for connecting indicators between the MQL market and MT4. The connected indicators are made by our group and can be used for other applications, such as sending messages to the Line application or Telegram application. If you have any questions, please don't hesitate to ask us to receive support. Function and indicator buffer Buffer one is the high price of the previous candle. Buffer two is the high price of the previous candle. Usage To connect indicators to fu
Indicator : RealValueIndicator Description : RealValueIndicator is a powerful tool designed specifically for trading on the EURUSD pair. This indicator analyzes all EUR and USD pairs, calculates their real currency strength values, and displays them as a single realistic value to give you a head start on price. This indicator will tell you moves before they happen if you use it right. RealValueIndicator allows you to get a quick and accurate overview of the EURUSD currency pair tops and bottoms,
How to use Pair Trading Station Pair Trading Station is recommended for H1 time frame and you can use it for any currency pairs. To generate buy and sell signal, follow few steps below to apply Pair Trading Station to your MetaTrader terminal. When you load Pair Trading Station on your chart, Pair Trading station will assess available historical data in your MetaTrader platforms for each currency pair. On your chart, the amount of historical data available will be displayed for each currency pai
回帰取引を意味する専門的かつ定量的なアプローチを実装する独自の指標。これは、価格が予測可能かつ測定可能な方法で迂回して平均に戻るという事実を利用しており、非定量的な取引戦略を大幅に上回る明確な出入りルールを可能にします。 [ Installation Guide | Update Guide | Troubleshooting | FAQ | All Products ] 明確な取引シグナル 驚くほど簡単に取引できます カスタマイズ可能な色とサイズ パフォーマンス統計を実装します ほとんどの取引戦略を上回ります 適切なSLおよびTPレベルを表示します 電子メール/音声/視覚アラートを実装します 使い方 インディケータは、より高い時間枠からの完全にカスタマイズ可能な移動平均の周りの標準偏差を測定し、トレンドフォローアプローチを使用して正確に取引を見つけます。取引は、現在のチャートの価格アクションに飛び込むことによって見つけられ、価格が選択したより高い時間枠から計算された平均価格帯に戻ったときに閉じられます。それがコード化される方法のために、指標は高ボラティリティと強いトレンドの
ECM Elite Channel is a volatility-based indicator, developed with a specific time algorithm, which consists of finding possible corrections in the market. This indicator shows two outer lines, an inner line (retracement line) and an arrow sign, where the channel theory is to help identify overbought and oversold conditions in the market. The market price will generally fall between the boundaries of the channel. If prices touch or move outside the channel, it's a trading opportunity. The
TrendMaestro
Stefano Frisetti
5 (3)
note: this indicator is for METATRADER4, if you want the version for METATRADER5 this is the link:  https://www.mql5.com/it/market/product/108106 TRENDMAESTRO ver 2.4 TRENDMAESTRO recognizes a new TREND in the bud, he never makes mistakes. The certainty of identifying a new TREND is priceless. DESCRIPTION TRENDMAESTRO identifies a new TREND in the bud, this indicator examines the volatility, volumes and momentum to identify the moment in which there is an explosion of one or more of these data a
This product is based on the methodologies of Gann, his follower Don E. Hall. The Indicator builds a working view grid, which is used to analyze graphics. The Pyrapoint tool, developed by Don Hall, is a grid based on the Pythagorean cube. In his calculations he uses the Gann Square 9 methodology and the relationship between Price and Time. This tool is used to predict changes in trend and overall market actions. More information about the method   HERE
3 Indicators in 1 indicator Strategy based on price action Made specifically for the best forex currency pairs Can be used in the best time frame of the market at a very reasonable price This indicator is basically 3 different indicatos . But we have combined these 3 indicators in 1 indicator so that you can use 3 indicators at the lowest price. All three strategies are based on price action. But based on different trends. Long term, medium term and short term Attributes : No repaintin
Max Payneは、矢印の形でシグナルを与える反転/トレンドシグナルインジケーターです。このインジケーターは、同じバーの終値でシグナルを出します。このインジケーターは、異なる期間でチャート上に複数回ドロップして、シグナルの2倍/3倍の確認を取得できます。 このインジケーターは、あらゆる取引スタイルに合わせて高度に調整できますが、再描画やバックペイントは一切行われません。購入後には、使用したテンプレートとともにスクリーンショットに表示される完全なシステムが表示されます。 ----------------- 取引方法: トレンドフィルター(購入後に得られるペイントレンド)が方向に一致している間、同じバーでトリプル確認が得られるまで待ちます 取引を開始し、買い取引の場合は金色の矢印 (テンプレート) より下、売り取引の場合は金色の矢印 (テンプレート) より上にストップロスを設定します。終了シグナルは最初の反対側の白い点のシグナル (テンプレート) です。 ----------------- パラメーター : 信号周期:矢印周期 フィルター: 信号フィルター 距離 : ローソクからの矢印
JULY OFFER 80% OFF next price for unlimited version will be 17000$. This is the only time you can get this institutional and professional indicator at this price for unlimited version. Don't dare to miss this. The tool I am about to introduce to you you can't compare it with other tools due to its strategy and accuracy level in predicting the next price directional movement . This tool is designed for serious traders who have decided to make a difference through trading. Be the next person to wi
Dear Traders this is my another tool called " Swing Master Indicator ". As the name above the indicator is designed to help you in swing trading by capturing the low and highs of the price. You may us this tool with any trading strategy and style from scalping to position trading. It is made for level of traders including newbies and advanced traders even prop-firms, hedge funds and banks to help them make sold market analysis. I create tools for serious traders who want to make a difference in
The indicator " ZigZag on Trend " is an assistant in determining the direction of price movement, as well as a calculator of bars and points. It consists of a trend indicator, which follows the price direction by the trend line presented in the form of a zigzag and a counter calculating the number of bars traversed in the direction of the trend and the number of points on the vertical scale. (calculations are carried out by the opening of the bar) The indicator does not redraw. For convenience,
もちろんです。以下は、提供いただいたテキストの日本語への翻訳です: MT4用の天文学指標をご紹介します:究極の天体トレーディングコンパニオン トレーディング体験を天空の高みに高める準備はできていますか?私たちの革命的なMT4用の天文学指標をご紹介します。この革新的なツールは、複雑なアルゴリズムの力を借りて、類まれなる天文学的洞察と精密な計算を提供します。 あなたの指先で宇宙の情報を: 宝のような天文学的データが明らかになる包括的なパネルをご覧ください。惑星の地理的/太陽中心座標、太陽と地球の距離、星の大きさ、伸び、星座、黄道座標および赤道座標、さらには水平座標まで、それぞれが綿密に計算され美しく表示されています。指標によって生成される垂直線は時間値に対応し、トレーディングの旅に宇宙の視点を提供します。 惑星のラインと関係: グラフを飾る惑星のラインの魔法を体験し、スケールと角度をカスタマイズできます。直感的なコントロールパネルを介して各惑星のラインの表示を簡単に切り替えることができます。指定された時刻範囲内での合会、六分会、四分会、三分会、対会、逆行の指標で天体の関係の芸術を発見してく
MT5 Version SMT Divergences MT4 SMT Divergences is one of the most innovative indicators in the market. It offers the possibility of analyzing price divergences between 2 pairs. These divergences highlight and help to foresee what banks and institutions are planning to do. SMT divergences also provides you with a kill zones indicator and the possibility of filtering divergences occurring during these kill zones.  The strategy tester is limited in MT4. Contact the author to get your Demo Version
Bomb Bank シグナル: MetaTrader 4 の信頼度インジケーター Bomb Bank Signal は、金融市場で最も関連性の高いトレンドを特定するように設計された MetaTrader 4 の強力なインジケーターです。動きを正確に予測するツールをお探しなら、Bomb Bank が最適です。 仕組み: このインジケーターは、出来高分析、ローソク足終値、対称トレンドという 3 つの異なる方法を組み合わせて、売買の機会を検出してシグナルを送ります。 Bomb Bank は、買いの機会を特定するときは「爆弾」のようなものであり、売りシグナルを検出するときは「ドクロ」のようなものです。 ボムバンクはなぜ違うのですか? 完全な信頼性: Bomb Bank Signal は信号を削除しません。一度シグナルが発せられると、シグナルは残り続けるので、チャンスを逃すことはありません。 極めて高い精度: Bomb Bank は誤った信号を送信しません。リアルタイムで最新情報を更新し、市場の進化に合わせて調整しながら、以前のシグナルの透明性を維持します。 ライブアップデ
Contact us to receive a comprehensive user guide after purchasing. William Delbert Gann, commonly known as W.D. Gann, was an exceptional market analyst renowned for his unique trading style in the early 20th century.  His trading techniques were based on a blend of mathematics, geometry, astrology, and ancient mathematics. Gann believed that stock market movements followed specific patterns and cycles, rather than being random. His methodologies, celebrated for their accuracy and relevance, con
NOTE: PRICE WILL RISE VERY SOON. DON'T SKIP THIS OFFER! Dear traders I am glad to introduce the " Market Swing Scanner Board" indicator to you. This indicator was made mainly to be used in combination with the Market Swing Index Indicator. You use the  "Market Swing Scanner Board"  indicator to scan for trading opportunities on the  Market Swing Index Indicator . This tool is designed for serious traders who have decided to make a difference through trading. Be the next person to witness this st
This indicator is based on the mathematics of the great trader W.D. Ganna. With its help, you can easily find strong levels by analyzing swings to find the optimal entry point. The indicator works on all instruments and all timeframes. The indicator is fully manual and has control buttons. All you need to do is press the NEW button, a segment will appear, which you can place on any movement, swing or even 1 candle that you want to analyze. By placing the segment, press the OK button. A grid (th
The indicator of a Professional Trader is an arrow indicator for predicting the direction of price movement. I have been working on this indicator since 2014. You can use this indicator as your main indicator, use its entry signals, and use it as your only indicator to find entry points. About the product: Recommended TF [H4-D1-W1]   . The indicator predicts the direction of the next candle. Fits a variety of tools; Flexibility in settings for different instruments and intervals through the
TRANSACTION SPEEDは、大口注文がいつどこで市場に集積され、その恩恵を受けているかを示す最高品質の指標です。トレンドの変化を非常に早い段階で検知します。インジケーターであると同時にトレーディングシステムでもあります。そのコンセプトはユニークで、驚くほど収益性が高い。 FXでは、ティックボリュームはボリュームと呼ばれ、誤解を招きやすい。実際は、単位時間当たりの価格変動であり、事実上、取引速度(TRANSACTION SPEED)です。 このインジケーターは、FXにおける出来高の概念を完全に見直し、正しい方法で論理的に定義し、このロジックを適用することで、ユニークで正確なトップレベルの収益ツールになります。 スピードが上がれば、それはより大きな関心とそれに対応するエントリーとエグジットのサインです。 使い方は? このインジケーターは、市場の取引スピードを測定・比較するため、まず最初に行うべきことは以下の通りです。 比較を行う期間を選択することです。 通常、15日前が比較の出発点となります。 インジケータに日付を入力して実行する。 30分または1時間のタイムフレー
The Th3Eng Ninja indicator is based on an analysis of the right trend direction with perfect custom algorithms. It show the true direction and the best point of the trend. With Stop Loss point and Three Take Profit points. Also it provides a secondary entry points in dots arrows style. And Finally it draws a very helpful lines from entry level to TP1, TP2, TP3, SL levels or the reverse signal, and all current/old signals status. How to use the indicator No complicated steps ,   Just follow 2
Please send me Direct message on MQL5 CHAT after purchasing the Indicator for Training and Installation Support There are some additional files that is important to use with the Indicator . So be sure to contact me after purchasing the Indicator So that I can add you for training and support . If you find any difficulty with installation then send me Direct message here So that I can connect with you via Anydesk or Teamview for the product installation. " Smart Order Block Indicator " to find
Cyclical indicator for trading and predicting the direction of the market. Shows the cyclical behavior of the price in the form of an oscillator. Gives signals for opening deals when rebounding from the upper and lower boundaries of the oscillator. In the form of a histogram, it shows the smoothed strength of the trend. Will complement any trading strategy, from scalping to intraday. The indicator does not redraw. Suitable for use on all symbols/instruments. Suitable time frames for short-term
Full Forex Market View Dashboard
Opengates Success International
5 (2)
FULL FOREX MARKET VIEWダッシュボードインジケーター これは、トレーダーが市場で何が起こっているかを完全に把握できるようにするために作成されたカスタム指標です。 リアルタイム データを使用して市場にアクセスし、取引を成功させるために必要なあらゆる情報を表示します。 インストール: このインジケーターをウィンドウ チャートに添付する前に、MT4 のマーケット ウォッチ パネルに移動し、不要な通貨ペアまたは取引しないすべての通貨ペアを非表示にして、残りをそこに残します。 その理由は、FFMV ダッシュボードが MT4 の気配値表示に表示されるすべての通貨ペアを表示するためです。 最大 30 通貨ペア以下を表示できます。 MT4 の気配値表示でそれ以上だと、FFMV ダッシュボードのフォントと画像がぼやけて変形します。 正しく表示されません。 使用法:      個人取引の場合      バスケット取引の場合 (方法についてはスクリーンショットを参照してください)      複数注文取引にも使用可能      独自の取引システムなどから
Gann Signal is a very simple indicator at first glance, but hidden inside is many years of experience in studying W.D.Ganna methods. The indicator gives accurate BUY/SELL signals, without redrawing. The indicator is very easy to use. All you need to do is attach it to your chart and follow its recommendations. The indicator constantly analyzes the market for entry opportunities. When such an opportunity appears, the indicator gives a signal in the form of an arrow. I repeat, all signals are NOT
作者のその他のプロダクト
もちろんです。以下は、提供いただいたテキストの日本語への翻訳です: MT4用の天文学指標をご紹介します:究極の天体トレーディングコンパニオン トレーディング体験を天空の高みに高める準備はできていますか?私たちの革命的なMT4用の天文学指標をご紹介します。この革新的なツールは、複雑なアルゴリズムの力を借りて、類まれなる天文学的洞察と精密な計算を提供します。 あなたの指先で宇宙の情報を: 宝のような天文学的データが明らかになる包括的なパネルをご覧ください。惑星の地理的/太陽中心座標、太陽と地球の距離、星の大きさ、伸び、星座、黄道座標および赤道座標、さらには水平座標まで、それぞれが綿密に計算され美しく表示されています。指標によって生成される垂直線は時間値に対応し、トレーディングの旅に宇宙の視点を提供します。 惑星のラインと関係: グラフを飾る惑星のラインの魔法を体験し、スケールと角度をカスタマイズできます。直感的なコントロールパネルを介して各惑星のラインの表示を簡単に切り替えることができます。指定された時刻範囲内での合会、六分会、四分会、三分会、対会、逆行の指標で天体の関係の芸術を発見してく
Gannスクエアインジケーターは、W.D. Gannによって執筆された「市場予測のための数学的な式」の記事に基づく強力な市場分析ツールです。このツールは、解析に数学的な概念を応用し、Gann理論に基づいています。それは、144、90、52のスクエアや9のスクエアなど、Gannの関連テクニックの要素を取り入れています。さらに、の方法を組み込んでおり、9のスクエアとその関連性についてのチャネルやスターパターンに焦点を当てています。 ユーザーマニュアルと使用方法: このインジケーターを使用する前に、ユーザーマニュアルを読んで疑問点を解決するためにお問い合わせいただくことをお勧めします。ユーザーマニュアルの完全版は、当社のウェブサイトで入手できます。 MT5の完全版は購入できますし、MT4の無料版も試すことができます。両方のバージョンへのリンクを提供していますので、ご利用ください。 主な機能と機能: Gannスクエアインジケーターは、市場分析のための完全なツールセットを提供し、幾何学的な概念とGann理論に基づいて的確な判断を行う手助けをします。以下に主な機能を示します。 9のスクエアの分析:
このインジケータは、手動および自動的な方法でチャートに描かれたハーモニックパターンを検出します。ユーザーマニュアルは、このリンクから参照できます: あなたのレビューを追加し、入手するために私たちに連絡してください。 この製品をmt4で試すための無料版があります。 GartleyおよびNenstarパターンを検出するために使用できます。 https://www.mql5.com/en/market/product/30181 完全なMT4バージョンを購入するには、次の場所から購入できます。 https://www.mql5.com/en/market/product/15212 注 インジケータにはコントロールパネルがあり、すべての(チャート&時間枠)設定が保存されます。チャート上でスペースをより多く確保するために、最小化することができ、他の分析ツールで作業する場合は、すべてのインジケータデータを非表示にするために閉じるボタンを押すことができます。 このインジケータを使用して設定を変更し、移動平均やボリンジャーバンドなどのインジケータを追加すると、編集のテンプレートが自動的に保存され、必
このインジケーターは、エリオット波動理論と組み合わせて作動し、2つの方法で使用されます: 自動モード: このモードでは、インジケーターがチャート上の全ての5つのモーティブ波を自動的に検出し、予測とポテンシャルな逆転ゾーンを提供します。また、アラートやプッシュメッセージを生成する能力も備えています。この自動機能により、エリオット波動パターンの識別と分析のプロセスが効率化されます。 手動モード: このオプションは、エリオット波動理論を手動で扱いたいトレーダー向けです。9つの段階を使用して波を描画することができます。各段階は、表示された後に描画されたラインを調整して個別に定義できます。この機能により、手動で波を描画するプロセスがより効率的になります。重要な点として、すべての描画データが将来の参照のためにプラットフォームのデータフォルダに保存されることに注意してください。 パラメータ: Name: インジケーターの名前。 Use_System_Visuals: インジケーターのテーマを有効または無効にして、取引プラットフォーム全体の外観に合わせます。 Explain_Comment: 波の番号
This indicator has a lot of numerology analyzing methods that can support your analyzes or can work as custom strategy by it self ..we will start to explain them one by one :  this the trial version of this product to have this product here is the link : https://www.mql5.com/en/market/product/118782   1- Range channel that draws the limits of daily movements to detect places of buy and places of sell . 2- Angler will detect Dynamic numeral levels that result of time and price squaring with cus
FREE
この製品を使用すると、多くの機能を使用して注文とアカウントを管理できます 1- アカウント サイズ / SL サイズ / 1 ロット サイズのペア ポイント値に応じて、正しいロット サイズを計算します。 2- ラインの場所 (ターゲット SL TP) に応じて現在の注文状況を表示します。 3- ボタンを 1 回押すだけで、すべての注文をターゲット / SL に移動します。 4- アカウントに関する情報と、注文を開くために必要なマージンを表示します。 5- すべての注文 (シンボルまたはすべて) をクローズする機能があります。 6- 損益分岐点に達し、利益を保護する機能があります。 7- すべてのペアで簡単に使用できます。 レビューを追加することを忘れないでください
FREE
この指標は、W.D。Gannが書いた「市場予測の数式」​​の記事に基づく市場分析手法であり、9の2乗と144の2乗に依存しています。 ユーザーマニュアル: Add Your review And contact us to get it MT5のフルバージョンは次の場所から購入できます。 https://www.mql5.com/en/market/product/28669 あなたは無料でMT4でテストすることができます: https://www.mql5.com/en/market/product/15316 この製品は、レベル/スター/グリッド/ガンファン/として9の正方形を描くことができます。 ガンスクエアも描画します:52/90/144。 チャート上で直接移動可能なフリーガンスターを描画します。 また、ガンダイヤモンドを描画します。 それはあなたがあなたのエントリーのために最高のロットを計算することができるようにするロット計算機を持っています。 インジケーターにはパネルがあり、次のことができます。 144/90/5
FREE
This indicator will detect harmonic patterns that are drawn on the chart by manual and automatic methods. You can see user manual from this link: https://www.mql5.com/en/blogs/post/719257 There is a free version (it detect only Gartley and Nenstar Patterns) to try this product. You can buy the full MT4 version from: https://www.mql5.com/en/market/product/104689 Notes When you use this indicator and change the settings, add indicators like Moving Average or Bollinger Bands, this indicator will
FREE
ゴールドグラム価格計算ツールインジケーターのご紹介 地域通貨における金価格を常に把握したいですか?もっと探す必要はありません。ゴールドグラム価格計算ツールインジケーターは、お好きな地域通貨でグラム当たりの金価格をリアルタイムで計算できる画期的なツールを提供します。このインジケーターを使用することで、金融洞察力を活用して情報に基づいた意思決定ができます。 主な特徴: 地域化された金価格: ゴールドグラム価格計算ツールインジケーターは、特定の地域通貨での金属のグラム単位の価格、具体的には金のグラム単位の価格を提供します。これにより、身近な通貨で金の価値を便利に追跡できます。 ユーザーフレンドリーな設定: 当インジケーターは利便性を考慮して設計されています。インジケーターの設定から直接調整するか、メインチャート上で調整することができ、シームレスで個別の体験が可能です。 パラメータの説明: Use_System_Theme (システムテーマを使用): 好みのカラースキームを選択するオプションで、インジケーターの視覚的な外観を取引環境に簡単に統合できます。 Ounce_Value (オンス価値)
FREE
ON Trade Pivots is A technical indicator that Draws all Pivot levels depending on time frame that defined in settings. Notes It will be good tool for all traders who use pivot levels in their trades. Let me inform you that this indicator draw this level as buffers not as objects then you can connect it easily to EA. This indicator allow you to find pivots levels for any time frame not only daily you are free to choose time frame from settings. Parameters Use_System_Visuals - Enable /Disable
FREE
このインジケーターは、トレードチャート上でドンチャンチャネルを視覚的に表現するためのものです。ドンチャンチャネルは、特定の期間における最高値と最低値の間の範囲を描画するためのシンプルなテクニカルツールです。このインジケーターは、価格動向の視覚的な分析を向上させ、潜在的なブレイクアウトとトレンドの継続ポイントに関する洞察を提供します。ドンチャンチャネルは、現在の時間枠とより高い時間枠の両方に適用できるため、このオプションを有効にすることができます。 インジケーターの主な特徴: Use_System_Visuals: このパラメータを有効にすると、システムの視覚スタイルとインジケーターの外観を切り替えることができます。有効にすると、インジケーターの視覚的要素はトレードプラットフォーム全体のテーマに合わせられます。 Signal_from_HT_Timeframe: このオプションを有効にすると、より高い時間枠からのシグナルを受信できます。言い換えれば、現在の時間枠でのトレーディングの決定に影響を与えるために、より長い時間枠でのドンチャンチャネルの動作を考慮できます。 HT_Timefram
FREE
このインジケーターは、「回帰チャンネルツール」のコンセプトに基づいた堅牢な市場分析手法を提供します。このツールを活用することで、トレーダーはチャートの回帰チャンネルに対して優れたコントロールを行い、より情報を得てトレードの決定を行うことができます。 回帰チャンネルツールは、トレーダーのツールボックスにおける強力な道具です。価格トレンドや潜在的なサポートと抵抗レベルに対する貴重な洞察を提供することを目的としています。このツールは特にトレンド内の修正波動を視覚化するのに効果的であり、価格のダイナミクスの包括的なビューを提供します。 以下は、このインジケーターを使用する際の主な特徴と利点について詳しく説明します: チャンネルレベルとサポート/レジスタンス: このインジケーターの主な利点の一つは、動的なサポートとレジスタンスゾーンとして機能するチャンネルレベルを生成する能力です。これらのレベルは潜在的なエントリーポイントや出口ポイントを特定するのに重要であり、トレーディング戦略の精度を向上させます。 修正波動レベル: 修正波動レベルを有効にすることで、トレーダーは大きなトレンド内での潜在的な修
"私たちの強力な外国為替インジケーターをご紹介します。これは、トレード戦略を向上させ、市場のトレンドについて正確な洞察を提供するために設計されました。この先進のツールは、蝋燭の測定を詳細に分析し、最適な精度を得るために調整を行う複雑なカスタムアルゴリズムを使用しています。その結果、戦略的なエントリーポイントを示すチャート上に巧みにプロットされた矢印のセットが得られます。 このインジケーターの素晴らしさは、蝋燭のパターンの力を活用し、それらを慎重に調整された調整と組み合わせる能力にあります。これにより、市場の動きに対する独自の視点が提供され、トレードの意思決定に優位性が生まれます。 このインジケーターの際立った特徴の1つは、H1時間枠での優れたパフォーマンスです。この時間枠に特化したトレーダーは、正確なエントリーポイントの多くを提供することがわかるでしょう。ただし、私たちは相乗効果の力を信じています。このインジケーターは単独で強力なツールですが、より広範なトレード戦略に組み込まれると、そのパフォーマンスはさらに向上します。既存のアプローチと組み合わせることで、その真のポテンシャルが発揮さ
もちろん、こちらが日本語への翻訳です: "このインジケーターは、バイストラ・パターン理論に基づいてエントリーを検出し、エントリー値を提供し、ターゲットとストップのレベルでリミットオーダーを配置します。これにより、リスクの割合を計算できます。 注意事項: このインジケーターにはEAで使用できるバッファがあります。 この製品を使用する際には、良好なマネーマネジメントを実践することが重要です。 タイムフレームを変更すると、 インジケーターは前回のセッションで使用したテンプレートを保存します。 この方法を学ぶための書籍が必要な場合は、購入後にお知らせいただくか、ご購入後にご意見をお寄せください。 パラメーター: システムビジュアルを使用 - この製品の視覚的なテーマを有効/無効にします。 スピードに関連 - 最後の波の速い動きのみでパターンを検出するを有効/無効にします。 最後のキャンドルカウンターを表示 - キャンドルタイマーを有効/無効にします。 キャンドルカウンターの色 - キャンドルタイマーのテキストの色。 上昇パターンの色 - 上昇パターンの色。 下降パターンの色 - 下降パターンの
もちろん、こちらが「Fibo Star」という指標についての詳細な説明です。これはFibonacciファンを星の形でチャートに描画するためのもので、価格の動きに効果的であり、描画と設定を行う際の手間を減らすためのコントロールパネルもサポートされています。 使用方法: この指標は手動の使用になります。効果的に使用するためには、以下の手順に従ってください: チャート上でFibonacciファンを描画するための高値と安値のポイントを特定します。 これらの高値と安値に紫色のラインを置きます。 価格がこれらのラインに到達するのを待ち、それらがサポートと抵抗のラインとして機能するのを観察します。 パラメータ: Use_System_Theme: このパラメータを使用して、外観をトレーディングプラットフォーム全体のテーマに合わせるか、独自にカスタマイズするかを選択できます。 Levels_Color: Fibonacciファンのレベルに適用する色を選択します。 Levels_Style: Fibonacciファンのレベルのスタイルを定義し、外観を好みに調整します。 Levels_Width: チャー
「通貨強度インジケーター」は、外国為替市場での異なる通貨の相対的な強さに関する情報を提供するために開発された強力なツールです。各通貨の強さをそれぞれの対応する時間枠に基づいて計算し描画することで、この指標はトレーダーに、特に顕著なダイバージェンスやクロスが観察された場合に潜在的なトレード機会を特定する機会を提供します。 指標の主な特徴: 1. 通貨の強さの計算: この指標は、各通貨の強さを対応する時間枠に基づいて計算します。この計算は、指定された期間内に一つの通貨が他の通貨のバスケットに対するパフォーマンスを評価することを含みます。これにより、トレーダーは通貨の相対的な強さまたは弱さを理解することができます。 2. 収縮とダイバージェンス: 2つの通貨の強さの間に収縮またはダイバージェンスの動きがある場合、これは潜在的なトレード機会を示唆する可能性があります。例えば、ある通貨が著しく強くなる一方、別の通貨が弱くなる場合、可能なエントリーポイントを示す可能性があります。 3. ゼロレベルのクロス: この指標は、通貨の強さがゼロレベルをクロスする場合も識別します。ゼロを上回るクロスは強化傾
強力な価格アクションパターンを検出するためのテクニカルインジケーター:ピンバー、インサイドバー、アウトサイドバー はじめに: テクニカル分析の領域において、価格アクションパターンは市場の動向の可能性を示す重要な指標です。私たちは、チャート上での堅牢な価格アクションパターンの特定を効率化する高度なテクニカルインジケーターを開発しました。私たちのインジケーターは、ピンバー、インサイドバー、アウトサイドバーの3つの基本的なパターンを検出するのに特化しています。 主な検出パターン: ピンバー: ピンバーパターンは、市場トレンドのポテンシャルな反転を示す単一のローソク足の形成です。小さな実体と、実体の上または下に突き出る長いしっぽまたは「ヒゲ」が特徴です。バルシュピンバーは可能なバルシュ反転を示し、ベアリッシュピンバーはベアリッシュ反転を示唆します。 インサイドバー: インサイドバーパターンは、単一のローソク足の価格範囲が前のローソク足の価格範囲に含まれるときに発生します。このパターンは一時的な相場のコンソリデーションや未決定を示し、しばしばどちらかの方向にのみブレイクアウトする前に現れます。
MetaTrader用 数秘術ベースのサポートとレジスタンスインジケーター 紹介: MetaTrader用 数秘術ベースのサポートとレジスタンスインジケーターで、テクニカル分析の新たな側面を開拓しましょう。このユニークなツールは、数秘術の力を活用して、チャート上で重要なサポートとレジスタンスレベルを特定し、潜在的な価格変動に関する貴重な洞察を提供します。 主要なコンセプト: トレーディングの数秘術: 数秘術は数字とその私たちの生活における意味に関する神秘的な研究です。数秘術の原則をトレーディングに適用することは、象徴的な重要性を持つ特定の数字を特定し、それらを使用して購入または売却の活動を引き寄せる可能性のある価格レベルを予測することを含みます。 インジケーターの機能: 当社のインジケーターは、数秘術の隠れたパターンを利用して、チャート上にサポートとレジスタンスのレベルを描画します。これらのレベルは、金融市場で有意義な数秘術の重要な数字から派生しています。 学習のためのおすすめステップ: 数秘術の理解:インジケーターを使用する前に、数秘術の基本を理解するために時間をかけてください。重要
This indicator will give you entries as result of scalping strategy that will be applied on 14 symbols in same time and you are able to be notified with this entries  Note :   This indicator for scalping on 5 minutes timeframe only . How to use it : 1-Open chart and adjust settings (edit symbols names as your platform names , activate the alert system if you need it . 2-Wait for any signal you have it from this scanner you will have it as alert and as notification and you will see it on bo
This indicator gives you the signal of real cross on stochastic indicator. This indicator is easy to attach to an ea. This indicator will work best on All time frames. Arrow appears depending on many algorithms that study the cross parameters. Indicator properties Use_System_Visuals: enable/disable visual styles. Stochastic_K_Period. Stochastic_D_Period. Stochastic_Slowing. Use_Notifications: enable/disable Push Notifications. Use_Alert: enable/disable Alerts. Use_E_Mail: enable/disable Email
「ON Trade VSA」をご紹介します - ボリュームと分布の究極の分析ツール! 我々の先進的な指標「ON Trade VSA」を使って、ボリュームスプレッド分析(VSA)の力を解き放ちましょう。VSAは、市場の強さを評価し、トレンドを特定し、情報に基づいた判断を行うためのトレーダーによって使用される強力な手法です。以下に、「ON Trade VSA」を必携の取引ツールとするための主な特徴を探ってみましょう: マルチカラーのボリュームキャンドル :平均動きに基づいてボリュームキャンドルに異なる色を割り当てるユニークな機能を通じて、市場のダイナミクスについての洞察を得ることができます。この直感的な視覚化は、市場センチメントの変化を素早く把握するのに役立ちます。 強力なトレンドの検出 :私たちの指標は基本的な要素を超えます。グラフ上で最も強力なトレンドを正確に特定してプロットし、市場の主要な方向性を明確に示します。 ボリューム-レンジ乗数 :レンジにボリュームを乗じる機能を通じて、隠れたパターンを発見します。ボリュームと価格レンジの関係を分析することで、市場のボラティリティと潜在的なブ
This product is a part of  ON Trade Waves Patterns Harmonic Elliot Wolfe you can test free version on EURJPY from this link  Wolf Waves Indicator ウルフウェーブを発見しよう - あなたの究極の取引ツール! どんな時間軸でも簡単にウルフウェーブを見つけるための強力なツールを探していますか?もう探す必要はありません!私たちのウルフウェーブインジケーターは、その仕事を簡単にこなします。なぜこのインジケーターがあなたにぴったりか、以下でご紹介します。 主な特徴: 自動検出: ウルフウェーブインジケーターは、複雑なアルゴリズムを使用して、チャート上のキーポイントを自動的に見つけ、対応するラインを描画します。手動でパターンを探す手間が不要です。 使いやすさ: このインジケーターはシンプルなデザインで、経験豊富なトレーダーからウルフウェーブ初心者まで、誰でも簡単に利用できます。 高精度: 数多くのウルフウェーブインジケーターの中で、当社のものは完璧
This program serves as an effective tool for sending messages through a Telegram bot using the MetaTrader platform. It enables you to send your trading recommendations related to the orders you open on the trading platform directly to your Telegram channel or group. These messages may include details about open trades and can be accompanied by illustrative images of the orders. Alternatively, they can be configured to be without images based on your preferences. This means that if you are the ow
新しいインジケーターのご紹介:[ON Trade Breakout Zone] すべてのトレーダーに向けたシンプルでありながら強力な市場分析ツール! プロフェッショナルから初心者まで、どなたにも適しています トレーディング戦略を一層強力にしませんか?当社の最新のインジケーターは市場分析を簡素化し、あらゆるレベルのトレーダーに力を与えるよう設計されています。経験豊富なプロであろうと、たった今始めたばかりであろうと、[ON Trade Breakout Zone] は市場で潜在的な利益を引き出すための鍵です。 [ON Trade Breakout Zone] の使い方: この賢明なツールは、毎日、先進的なアルゴリズムを使用してチャート上にゾーンを描きます。最大限に活用する方法は以下の通りです: ゾーンの識別: [ON Trade Breakout Zone] は高い精度でチャート上の重要なゾーンを識別し、潜在的なトレードの機会を簡単に見つけるのに役立ちます。 トレードの実行: 描かれたゾーンのどちらかの側に価格が移動するのを待ちます。 価格が購入ラインを上回った場合
This indicator has a lot of numerology analyzing methods that can support your analyzes or can work as custom strategy by it self ..we will start to explain them one by one :   1- Range   channel that draws the limits of daily movements to detect places of buy and places of sell . 2-   Angler   will detect Dynamic numeral levels that result of time and price squaring with custom numeral method that works like support and resistant and will support your analyzes 3-   Shepherd Levels   it is l
トレンドトレーディングの力をマスター このインジケーターは、初心者、中級者、そしてプロのトレーダー向けに設計されています。どの通貨ペアでも、正確に実際のトレンドを特定することで、トレーディングプロセスを簡素化します。 なぜこのインジケーターを選ぶべきなのか? - 簡単なトレード: もはや複雑な分析は必要ありません。インジケーターをチャートにロードし、買いまたは売りのシグナルを待つだけで、1日中チャートに貼り付く必要がありません。 - 明確なエントリーシグナル: インジケーターは正確なエントリーポイントを提供し、買いシグナルには青い矢印、売りシグナルには赤オレンジの矢印が表示されます。さらに、トレンドラインは市場の現在のトレンドを確認するために色が変わります。 - 理想的なタイムフレーム: 最良の結果を得るには、5分足のタイムフレームを使用することをお勧めします。H1のタイムフレームで再度インジケーターを適用してシグナルを確認することで、より正確なデータを得ることができます。 - スキャナーと組み合わせるとさらに強力: 内蔵スキャナーを使用して、すべての通貨ペアのトレンドを
Gannスクエアインジケーターは、W.D. Gannによって執筆された「市場予測のための数学的な式」の記事に基づく強力な市場分析ツールです。このツールは、解析に数学的な概念を応用し、Gann理論に基づいています。それは、144、90、52のスクエアや9のスクエアなど、Gannの関連テクニックの要素を取り入れています。さらに、の方法を組み込んでおり、9のスクエアとその関連性についてのチャネルやスターパターンに焦点を当てています。 ユーザーマニュアルと使用方法: このインジケーターを使用する前に、ユーザーマニュアルを読んで疑問点を解決するためにお問い合わせいただくことをお勧めします。ユーザーマニュアルの完全版は、当社のウェブサイトで入手できます。 MT5の完全版は購入できますし、MT4の無料版も試すことができます。両方のバージョンへのリンクを提供していますので、ご利用ください。 主な機能と機能: Gannスクエアインジケーターは、市場分析のための完全なツールセットを提供し、幾何学的な概念とGann理論に基づいて的確な判断を行う手助けをします。以下に主な機能を示します。 9のスクエアの分析:
このインジケーターは、「回帰チャンネルツール」のコンセプトに基づいた堅牢な市場分析手法を提供します。このツールを活用することで、トレーダーはチャートの回帰チャンネルに対して優れたコントロールを行い、より情報を得てトレードの決定を行うことができます。 回帰チャンネルツールは、トレーダーのツールボックスにおける強力な道具です。価格トレンドや潜在的なサポートと抵抗レベルに対する貴重な洞察を提供することを目的としています。このツールは特にトレンド内の修正波動を視覚化するのに効果的であり、価格のダイナミクスの包括的なビューを提供します。 以下は、このインジケーターを使用する際の主な特徴と利点について詳しく説明します: チャンネルレベルとサポート/レジスタンス:   このインジケーターの主な利点の一つは、動的なサポートとレジスタンスゾーンとして機能するチャンネルレベルを生成する能力です。これらのレベルは潜在的なエントリーポイントや出口ポイントを特定するのに重要であり、トレーディング戦略の精度を向上させます。 修正波動レベル:   修正波動レベルを有効にすることで、トレーダーは大きなトレンド内での潜
もちろんです。以下は、提供いただいたテキストの日本語への翻訳です: MT4用の天文学指標をご紹介します:究極の天体トレーディングコンパニオン トレーディング体験を天空の高みに高める準備はできていますか?私たちの革命的なMT4用の天文学指標をご紹介します。この革新的なツールは、複雑なアルゴリズムの力を借りて、類まれなる天文学的洞察と精密な計算を提供します。 あなたの指先で宇宙の情報を:   宝のような天文学的データが明らかになる包括的なパネルをご覧ください。惑星の地理的/太陽中心座標、太陽と地球の距離、星の大きさ、伸び、星座、黄道座標および赤道座標、さらには水平座標まで、それぞれが綿密に計算され美しく表示されています。指標によって生成される垂直線は時間値に対応し、トレーディングの旅に宇宙の視点を提供します。 惑星のラインと関係:   グラフを飾る惑星のラインの魔法を体験し、スケールと角度をカスタマイズできます。直感的なコントロールパネルを介して各惑星のラインの表示を簡単に切り替えることができます。指定された時刻範囲内での合会、六分会、四分会、三分会、対会、逆行の指標で天体の関係の芸術を発
フィルタ:
a_sane3
532
a_sane3 2023.09.22 13:16 
 

ユーザーは評価に対して何もコメントを残しませんでした

Sameer Haque
528
Sameer Haque 2023.09.10 16:06 
 

Highly accurate and very versatile. A great addition to my toolkit.

レビューに返信
バージョン 1.1 2023.10.21
- improvements