• 概要
  • レビュー (1)
  • コメント (1)

ON Trade Joker Levels

MetaTrader用 数秘術ベースのサポートとレジスタンスインジケーター

紹介: MetaTrader用 数秘術ベースのサポートとレジスタンスインジケーターで、テクニカル分析の新たな側面を開拓しましょう。このユニークなツールは、数秘術の力を活用して、チャート上で重要なサポートとレジスタンスレベルを特定し、潜在的な価格変動に関する貴重な洞察を提供します。

主要なコンセプト:

トレーディングの数秘術: 数秘術は数字とその私たちの生活における意味に関する神秘的な研究です。数秘術の原則をトレーディングに適用することは、象徴的な重要性を持つ特定の数字を特定し、それらを使用して購入または売却の活動を引き寄せる可能性のある価格レベルを予測することを含みます。

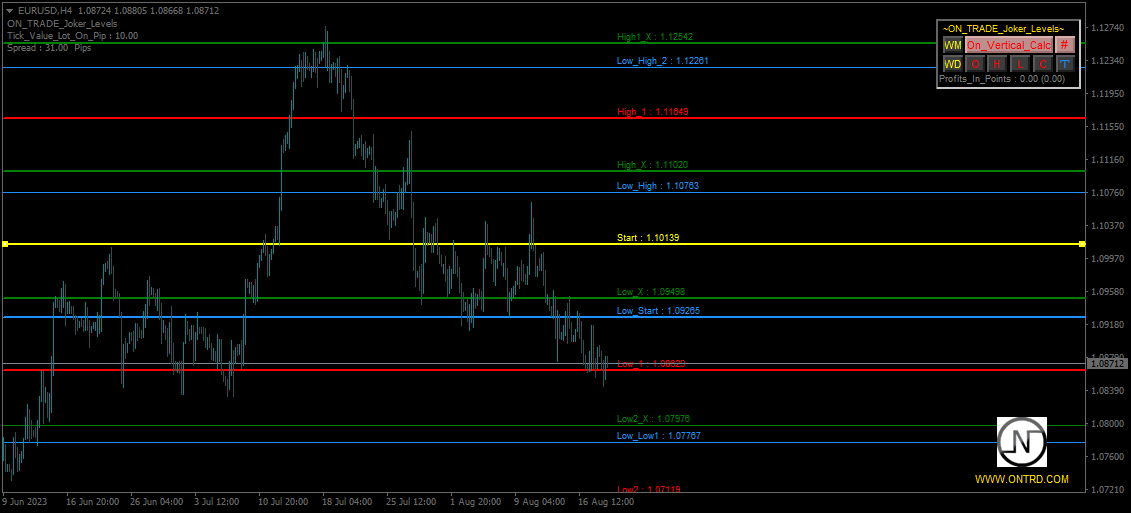
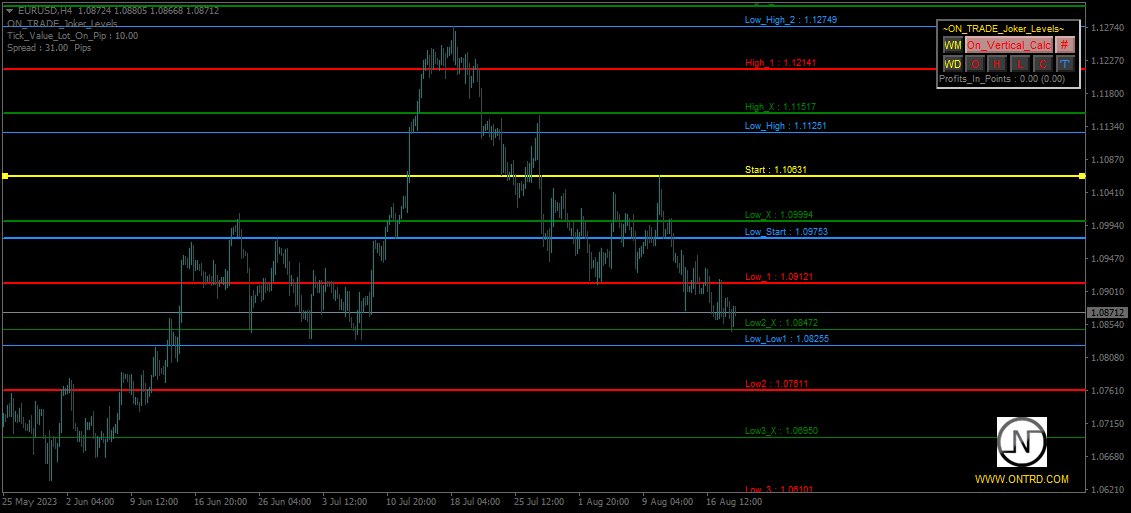
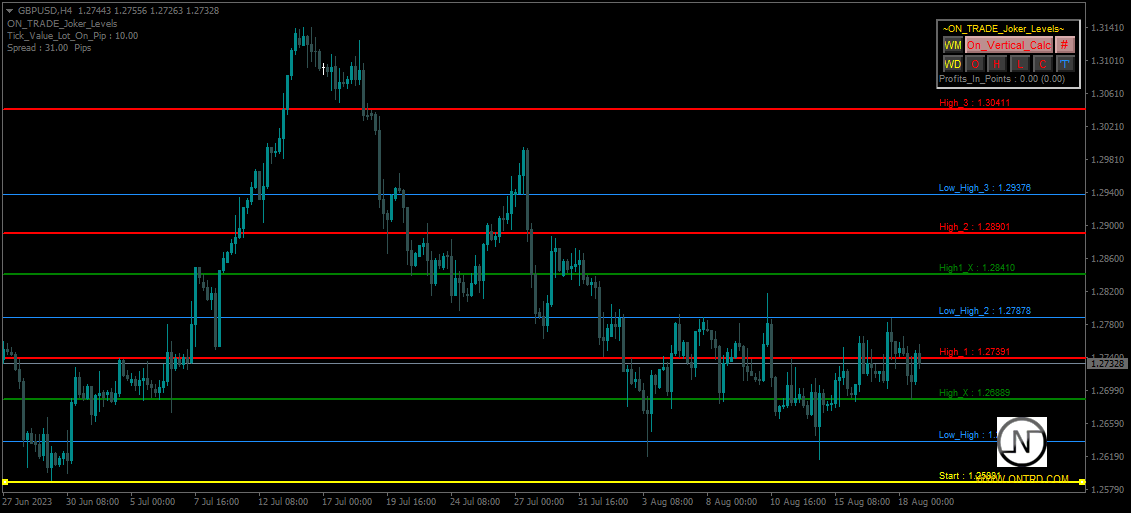
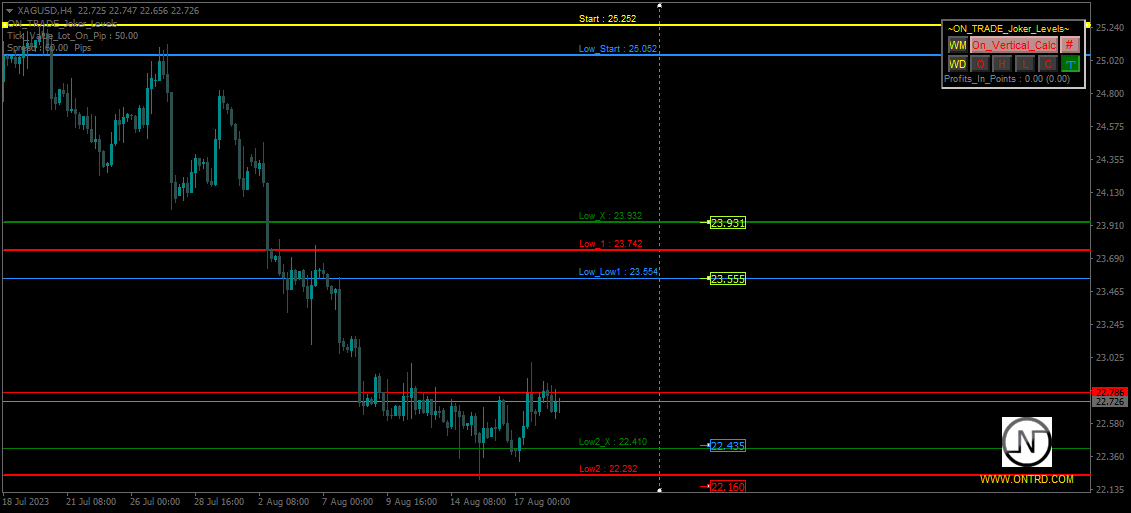
インジケーターの機能: 当社のインジケーターは、数秘術の隠れたパターンを利用して、チャート上にサポートとレジスタンスのレベルを描画します。これらのレベルは、金融市場で有意義な数秘術の重要な数字から派生しています。

学習のためのおすすめステップ:

数秘術の理解:インジケーターを使用する前に、数秘術の基本を理解するために時間をかけてください。重要な数字、その意味、そして金融市場との関連について学びましょう。

インジケーターのインストール:MetaTraderプラットフォームに数秘術ベースのサポートとレジスタンスインジケーターをインストールすることから始めます。ユーザーガイドに記載されているインストール手順に従ってください。

タイムフレームの選択:好きなトレーディング銘柄のチャートを開き、分析したいタイムフレームを選択します。このインジケーターはさまざまなタイムフレームで機能するため、短期および長期のトレーディングのための数秘術ベースのレベルを特定することができます。

インジケーターパラメータの調整:トレーディングの好みに合わせて、インジケーターのパラメータをカスタマイズします。インジケーターは、使用する数秘術の数字を指定したり、感度レベルを調整したりすることができるかもしれません。

レベルの解釈:インジケーターは、数秘術の原則に基づいて自動的にチャート上にサポートとレジスタンスのレベルを描画します。これらのレベルは、価格が反転またはコンソリデートする可能性のあるポテンシャルなエリアです。

価格アクションの確認:任意のトレーディングツールと同様に、数秘術ベースのレベルを他のテクニカルおよびファンダメンタルな分析で確認することが重要です。キャンドルパターンやトレンドラインなど、特定のレベルをサポートする追加要因を見つけます。

練習と観察:インジケーターを使用するスキルを向上させるために、過去のチャートで練習してみましょう。さまざまな市場条件で価格が数秘術ベースのレベルの周りでどのように反応するかを観察します。

リスク管理:トレーディング時に適切なリスク管理戦略を常に実施してください。ストップロスオーダーやポジションサイジングを使用して資本を保護します。

結論: 当社の数秘術ベースのサポートとレジスタンスインジケーターは、数秘術の神秘的な世界をトレーディング戦略に統合する強力なツールです。数秘術に影響を受けた潜在的なサポートとレジスタンスのレベルを特定することで、より情報のあるトレーディングの決定を行えます。数秘術は独自の分析レイヤーを追加しますが、他の確立されたトレーディングテクニックと組み合わせて最良の結果を得るためには必須です。

【免責事項:トレーディングにはリスクが伴い、インジケーターは包括的なトレーディングアプローチの一部として使用する必要があります。トレーディングの決定を行う前に、常に独自の調査と分析を行ってください。】

特定のインジケーターや対象読者に合わせてこれらのステップをカスタマイズして調整してください。


おすすめのプロダクト
>>> BIG SALE PROMOTION: 50% OFF + GIFT EA!  - Promo price: $64 / Regular price $129 <<< - The promotion will end soon! The Forex Trend Tracker is an advanced tool designed to enhance the trading capabilities of forex traders. This sophisticated indicator uses complex mathematical formulas alongside the Average True Range (ATR) to detect the beginnings of new upward and downward trends in the forex market. It offers visual cues and real-time alerts to give traders a competitive advantage in th
The elite (V3) multi-indicator suite from JoaquinTrading specifically geared towards Forex & binary options, including regulated exchanges such Nadex, Cantor Exchange, and other binary option brokers. The Probability Tool Suite Elite will provide the given win/loss outcome probabilities of up to 10 strike levels, a specific expiration duration, based on a combination of up to 16 indicators, rules, or conditions and derivative behavior (i.e. expiry, touch, touch & retrace).  Using this indicat
This is an arrow indicator without a future function,developed based on the most advanced profit trading algorithms.It has the most innovative and advanced dual trend analysis module, as well as the latest and highly effective market trend prediction algorithm.Trends are your friends, and following larger trends can earn the maximum profit in foreign exchange. This indicator helps traders identify current trends and track them. Someone once made a profit of 10 times in a week by relying on it.No
"The trend is your friend" is one of the best known sayings in investing, because capturing large trendy price movements can be extremely profitable. However, trading with the trend is often easier said than done, because many indicators are based on price reversals not trends. These aren't very effective at identifying trendy periods, or predicting whether trends will continue. We developed the Trendiness Index to help address this problem by indicating the strength and direction of price trend
Indicator function This index buys and sells according to the color, using time is one hour,Please run the test on a 30-minute cycle It is best to use 1H for testing   About update questions In order to be more suitable for market fluctuations, the company regularly updates the indicators   Product cycle and trading time applicable to indicators Applicable mainstream currency pair EUR/USD GBP/USD NZD/USD AUD/USD USD/JPY USD/CAD USD/CHF Applicable mainstream cross currency pair EUR/JPY EUR/GBP E
Owl smart levels
Sergey Ermolov
4.58 (55)
MT5版  |   FAQ Owl Smart Levels Indicator   は、 Bill Williams   の高度なフラクタル、市場の正しい波構造を構築する Valable ZigZag、エントリの正確なレベルをマークする Fibonacci レベルなどの一般的な市場分析ツールを含む 1 つのインジケーター内の完全な取引システムです。 利益を得るために市場と場所に。 戦略の詳細な説明 インジケータを操作するための指示 顧問-取引助手 プライベートユーザーチャット ->購入後に私に書いて、私はプライベートチャットにあなたを追加し、あなたはそこにすべてのボーナスをダウンロードすることができます 力はシンプルさにあります! Owl Smart Levels   取引システムは非常に使いやすいので、専門家にも、市場を勉強し始めて自分で取引戦略を選択し始めたばかりの人にも適しています。 戦略と指標に秘密の数式や計算方法が隠されているわけではなく、すべての戦略指標は公開されています。 Owl Smart Levels を使用すると、取引を開始するためのシグナルをすばやく確認し、
Signal trend indicator. Detects the direction of the trend and is coloured accordingly.  Has built in audible and visual alerts when trends change. Can send notifications to your phone or email. Allows Trend and Counter-Trend trading. Works on all timeframes, all currency pairs, metals, indices and cryptocurrencies. Can be used with binary options. Distinctive features No re-drawing; Simple and clear settings; Four types of alerts; Works on all timeframes and all trading tools; Su
What are Heiken Ashi Candles? Heiken Ashi, derived from the Japanese term 'Heikin Ashi,' translates to average price bars. It's an indicator depicting price bars on a chart. Formula for Heiken Ashi candles: - Heiken Ashi opening price: (previous candle's opening + closing price) / 2 - Closing price Heiken Ashi: (opening + high + low + closing) / 4 - Heiken Ashi peak: Max of high, opening, or closing price - Heiken Ashi bottom price: Min of low, opening, or closing price How to Read Heik
This is a trend indicator without redrawing Developed instead of the binary options strategy (by the color of the Martingale candlestick) Also works well in forex trading When to open trades (binary options) A signal will appear in the place with a candle signaling the current candle It is recommended to open a deal for one candle of the current timeframe M1 and M5 When a blue dot appears, open a deal up When a red dot appears, open a trade down. How to open trades on Forex. When a signal is rec
Trade with Gann on your side!! MASTER CIRCLE 360 CIRCLE CHART, originally created by Gann admitted that this is “The Mother of all charts”. It is one of the last studies that this great trader left for us. The numeric tab le is apparently quite simple like all the tables and is based on square numbers, the SQUARE OF 12 and is by evolution, one of the most important square numbers. Here we can find CYCLE, PRICE AND TIME thanks to angles and grades, to show past and future support and resistance.
フィボナッチリトレースと拡張ラインツール DiNapoliポイント取引方法とゴールデンセクション取引を使用するトレーダーにとって理想的なMT4プラットフォームのフィボナッチリトレースと拡張ラインツール 主な特長: あなたはフィボナッチリトレースメントの複数のセットを直接描くことができ、重要なリターンポイント間の関係は一目瞭然です。 2.フィボナッチ拡張を描画することができます。 3.フィボナッチフォールドバックとラインの延長は、簡単な観察と数値表示のために左右に動かすことができます。 4.チャートは非常に爽やかな 5.数字キーでサイクルを切り替えることができます。 ファンクションキー: 1。 [戻るを押す、要求に応じて描画する、最大8つのグループにする 2。拡張]を描くには[押す] 3。 \を押すと、現在のサイクルの下にあるすべての拡張機能と折り畳みが削除されます 4。フォールドバックを移動して削除して展開する (1)最初のフォールドバックセットのF5行をクリックします。 一度クリックすると(黄色に変わります)、キーボードのDel
まず第一に、この取引ツールはノンリペイント、ノンリドロー、ノンラグの指標であり、プロの取引に理想的ですことを強調する価値があります。 オンラインコース、ユーザーマニュアル、デモ。 スマートプライスアクションコンセプトインジケーターは、新米から経験豊富なトレーダーまで、非常 に強力なツールです。Inner Circle Trader AnalysisやSmart Money Concepts Trading Strategiesなど、20以上の有用な指標を1つに組み合わせています。このインジケーターはスマートマネーコンセプトに焦点を当て、大手機関の取引方法を提供し、彼らの動きを予測するのに役立ちます。 特に、流動性分析に優れており、機関がどのように取引しているかを理解しやすくしています。市場のトレンドを予測し、価格の動きを慎重に分析するのに優れています。機関の戦略とトレードを合わせることで、市場の動向についてより正確な予測ができます。このインジケーターは多目的であり、市場構造を分析し、重要な注文ブロックを特定し、さまざまなパターンを認識するのに優れています。 このインジケー
The indicator is usefull for: binary options and forex trading.. .Support all trading Pairs. --->Recommended expiration time for 3 to 5 candles. Exemple: Time frame 1 minute then expiration time will be 3 to 5 minutes. The indicator support MT2trading autotrading platform ; SELL BUFFER : 0 (red arrow) BUY BUFFER  : 1 ( green arraw) See #screenshot1. This is a premium powerfull indicator show hight daily winrate..
This indicator identifies pinbar candlesticks on the chart and displays an arrow as a trade signal based on the candlestick pattern. It offers user-friendly features, including push notifications and other types of alerts. It is most effective for identifying entry points or potential reversals at premium or discount prices. Additionally, it works on any time frame.
FREE
BUY SELL SIG. Utilizing unique price calculations BUY SELL SIG . generates high quality signals Now Features easy to use and Buy and Sell signals for Pro and Novice traders Supports Multi-currency Best results viewed on H1,H4 ,D1 and W1 Timeframes Supports audio alerts and notifications. No complex input parameters just notifications and the indicator style properties
PipFinite Trend PRO
Karlo Wilson Vendiola
4.9 (2780)
Breakthrough Solution For Trend Trading And Filtering With All Important Features Built Inside One Tool! Trend PRO's smart algorithm detects the trend, filters out market noise and gives entry signals with exit levels. The new features with enhanced rules for statistical calculation improved the overall performance of this indicator. Important Information Revealed Maximize the potential of Trend Pro, please visit www.mql5.com/en/blogs/post/713938 The Powerful Expert Advisor Version Automa
Levels ATR
Hafis Mohamed Yacine
The ATR Levels Indicator For MT4 is an indicator that is built specifically for traders who use the Meta Trader 4 for their trading analysis, charting of different currency pairs and trading assets, doing their technical analysis and making trading decisions all through the trading day as they work. One of the first major advantages of using the ATR Levels Indicator For MT4 is that it automatically helps the trader to spot very important levels in the markets based on the Average True Range In
The PatternMMB trading indicator finds the most common candlestick analysis patterns and provides trading recommendations based on them. The PatternMMB trading indicator is designed to search for candlestick patterns on the price chart and issue trading recommendations depending on the nature of the found candlestick pattern. It is also possible to send sound notifications when all or any of the selected patterns appear, with an explanation of the pattern and its interpretation. In addition, th
This indicator monitors the market for a flat state and possible breakout. The flat state is detected as a predefined number of consecutive bars during which price fluctuates inside a small range. If one of the next bars closes outside the range, breakout is signaled. The indicator shows 3 lines: blue - upper bound of flat ranges AND consecutive breakout areas; red - lower bound of flat ranges AND consecutive breakout areas; yellow - center of flat ranges (NOT including breakout areas). When a b
Akendicator X is a Non-repainting Indicator for trading at 5-15 minutes Timeframe.  Akendicator X extimates with clear arrows, in which direction the next candlestick will move. Pratically, when the length of the last candle reaches and exceeds a particular value (called Candle Power) immediately, after its closing, an arrow appears indicating whether the next candle could be Bullish or Bearish. I created a manual in pdf where you should learn exactly how to use AKENDICATOR X correctly; I will s
PipFinite Exit EDGE
Karlo Wilson Vendiola
4.88 (161)
Did You Have A Profitable Trade But Suddenly Reversed? In a solid strategy, exiting a trade is equally important as entering. Exit EDGE helps maximize your current trade profit and avoid turning winning trades to losers. Never Miss An Exit Signal Again Monitor all pairs and timeframes in just 1 chart www.mql5.com/en/blogs/post/726558 How To Trade You can close your open trades as soon as you receive a signal Close your Buy orders if you receive an Exit Buy Signal. Close your Sell orde
Smart Gread Ultimate Edition (SGUL) indicator - based on smart order grid strategy. Maximum customization and flexibility of strategies are the main features of this indicator. In the right corner there is a table with the number and volume of orders. List of adjustable parameters: K: 2.0 - Factor of the next order increase (if the price moves in the other direction). TP: 50 - The number of points at which the order is closed with a profit (minimum profit per 1 lot). Step: 80 -
MetaTrader 5 version available here: https://www.mql5.com/en/market/product/25794 FFx Pivot SR Suite PRO is a complete suite for support and resistance levels. Support and Resistance are the most used levels in all kinds of trading. Can be used to find reversal trend, to set targets and stop, etc. The indicator is fully flexible directly from the chart 4 periods to choose for the calculation: 4Hours, Daily, Weekly and Monthly 4 formulas to choose for the calculation: Classic, Camarilla, Fibona
Trend PA
Mikhail Nazarenko
5 (3)
The Trend PA indicator uses   Price Action   and its own filtering algorithm to determine the trend. This approach helps to accurately determine entry points and the current trend on any timeframe. The indicator uses its own algorithm for analyzing price changes and Price Action. Which gives you the advantage of recognizing, without delay, a new nascent trend with fewer false positives. Trend filtering conditions can be selected in the settings individually for your trading style. The indicator
Engulfing Candlestick Bulkowski The engulfing candlestick is a well-known candle pattern composed of two candles. This indicator for showing engulfing candlestick that describe by Thomas Bulkowski. If you need for MetaTrader 5 version, please visit here: https://www.mql5.com/en/market/product/34183 Feature Highlights Show bullish engulfing and bearish engulfing. Customizable "Up Symbol". Customizable "Down Symbol". Customizable symbol distance from candlestick. Customizable "Down Color". Cus
発見が困難で頻度が少ないため、分岐は最も信頼できる取引シナリオの1つです。このインジケーターは、お気に入りのオシレーターを使用して、通常の隠れた分岐点を自動的に見つけてスキャンします。 [ インストールガイド | 更新ガイド | トラブルシューティング | よくある質問 | すべての製品 ] 取引が簡単 通常の隠れた発散を見つけます 多くのよく知られている発振器をサポート ブレイクアウトに基づいて取引シグナルを実装します 適切なストップロスおよび利益レベルを表示します 設定可能なオシレーターパラメーター カスタマイズ可能な色とサイズ バー単位でサイズ別に分岐をフィルタリング パフォーマンス統計を実装します 電子メール/音声/視覚アラートを実装します 幅広い市場の見通しを提供するために、異なるオシレーターを使用して、干渉なしで同じチャートにインジケーターを何度もロードできます。このインジケーターは、次のオシレーターをサポートしています。 RSI CCI MACD オスマ 確率的 勢い 素晴らしい発振器 加速器発振器 ウィリアムズパーセントレンジ 相対活力指数 特に外国為替市
EFW Pattern Trader is a powerful pattern scanner for Forex and Stock trading. The pattern detection in EFW Pattern Trader uses the Fractal Wave Theory, which captures the endless up and down movement of the market. Therefore, EFW Pattern Trader can be considered as the robust price action indicator. Any patterns in EFW Pattern Trader can be backtested visually in your strategy tester. Visual backtesting with pattern will show you how pattern will likely behave in the live trading. Therefore, you
The indicator places Semaphore points on the maximum and minimum of a higher, medium and lower period. It includes A,B,C Triangles for easier spotting of reversal chart pattern which occurs very frequently and has a very high success ratio. Both Semaphore and A,B,C Triangles have Alerts and Push notifications to a mobile device when they occur on the chart. These indicators are very useful for breakout trading and spotting support/resistance levels which gives good opportunities for positions.
Embark on the pinnacle of Binary Options evolution. Our indicator isn't just adaptive—it's relentless. Picture a ninja riding a serpent, shadowing its every move; that's how this tool trails the market trend, unwavering till the end. Built upon the foundational prowess of the Ichimoku indicator and honed with an array of fine-tuned oscillators, it epitomizes accuracy and precision. Dive deep without getting lost in the Ichimoku's intricacies—our indicator simplifies the process for you. Perhaps
このプロダクトを購入した人は以下も購入しています
製品を購入する前に、以下の情報をお読みください。 Apollo Pips PLUS SP はユニークな製品です。これは、私の新しい「アポロ ピップス」インジケーターと、私のすべての取引インジケーターにアクセスできる「スーパー パック」ボーナスを手に入れたい人のためのものです。 Apollo Pips PLUS SP 製品を購入すると、実際には私の Apollo Pips インジケーターのまったく新しいバージョンを購入することになります。このバージョンのインジケーターには改良されたアルゴリズムと使いやすいパラメーターがあり、あらゆる市場およびあらゆる取引スタイルでインジケーターを使用する機会が得られます。 この製品の購入者は、私のスーパーボーナスとして、他のすべてのインジケーターにも無料でアクセスできます!私のすべての取引ツールにアクセスしたい場合は、この製品が最適です!:) しかし、これがすべてではありません!:) この製品のすべての購入者は、私の新しいインジケーターを無料で入手する資格もあります!:)新しい取引インジケーターを利用できるようになりました。私の特権のある「スーパー パッ
まず第一に、この取引インジケーターは再描画されず、再描画されず、遅延しないことを強調する価値があります。これにより、手動取引とロボット取引の両方に理想的なものになります。 ユーザーマニュアル:設定、入力、戦略。 アトミックアナリストは、価格の強さとモメンタムを利用して市場でより良いエッジを見つけるためのPA価格アクションインジケーターです。ノイズや誤ったシグナルを除去し、取引ポテンシャルを高めるための高度なフィルターを備えています。複雑なインジケーターの複数のレイヤーを使用して、アトミックアナリストはチャートをスキャンし、複雑な数学的計算をシンプルなシグナルと色に変換します。これにより、どのような初心者トレーダーでも理解して使用し、一貫した取引の決定を行うことができます。 「アトミックアナリスト」は、新規および経験豊富なトレーダー向けにカスタマイズされた包括的な取引ソリューションです。プレミアムインジケーターとトップノッチの機能を1つの取引戦略に組み合わせ、すべてのタイプのトレーダーにとって汎用性のある選択肢にします。 デイリートレーディングとスキャルピング戦略:高
Gold Channel is a volatility-based indicator, developed with a specific timing algorithm for the XAUUSD pair, which consists of finding possible corrections in the market. This indicator shows two outer lines, an inner line (retracement line) and an arrow sign, where the theory of the channel is to help identify overbought and oversold conditions in the market. The market price will generally fall between the boundaries of the channel. If prices touch or move outside the channel it is a tra
現在20%OFF! 初心者やエキスパートトレーダーのためのベストソリューション! このダッシュボードソフトウェアは、28の通貨ペアで動作しています。それは私達の主要な指標(高度な通貨の強さ28と高度な通貨インパルス)の2に基づいています。それは全体の外国為替市場の大きい概観を与えます。それは、すべての(9)時間枠で28の外国為替ペアのための高度な通貨の強さの値、通貨の動きの速度と信号を示しています。チャート上で1つのインディケータを使用して市場全体を観察し、トレンドやスキャルピングの機会をピンポイントで見つけることができたら、あなたのトレードがどのように改善されるか想像してみてください。 このインディケータには、強い通貨と弱い通貨の識別、潜在的な取引の識別と確認がより簡単になるような機能が搭載されています。このインディケータは、通貨の強さや弱さが増加しているか減少しているか、また、すべての時間枠でどのように機能しているかをグラフィカルに表示します。 新機能として、現在の市場環境の変化に適応するダイナミックなマーケットフィボナッチレベルが追加され、すでに当社のAdvan
PZ Day Trading
PZ TRADING SLU
3.67 (3)
このインディケータは、価格アクション分析とドンチャンチャネルのみを使用して、ジグザグ方式で価格の反転を検出します。再描画やバックペインティングを一切行わずに、短期取引向けに特別に設計されています。それは彼らの操作のタイミングを増やすことを目指している賢明なトレーダーにとって素晴らしいツールです。 [ インストールガイド | 更新ガイド | トラブルシューティング | よくある質問 | すべての製品 ] 驚くほど簡単に取引できます すべての時間枠で価値を提供します 自己分析統計を実装します 電子メール/音声/視覚アラートを実装します 可変長のブレイクアウトと混雑ゾーンに基づいて、インディケータは価格アクションのみを使用して取引を選択し、市場が非常に高速に行っていることに反応します。 過去のシグナルの潜在的な利益が表示されます この指標は、独自の品質とパフォーマンスを分析します 負けブレイクアウトは強調表示され、説明されます インジケータは、非バックペインティングおよび非再ペイントです この指標は、日中のトレーダーが単一の価格反転を見逃さないようにするのに役立ちます。ただし、す
NAM Order Blocks
NAM TECH GROUP, CORP.
5 (1)
MT4マルチタイムフレームオーダーブロック検出インジケーター。 特徴 -チャートコントロールパネルで完全にカスタマイズ可能で、完全な相互作用を提供します。 -必要な場所でコントロールパネルを表示および非表示にします。 -複数の時間枠でOBを検出します。 -表示するOBの数量を選択します。 -さまざまなOBユーザーインターフェイス。 -OBのさまざまなフィルター。 -OB近接アラート。 -ADRの高線と低線。 -通知サービス(画面アラート|プッシュ通知)。 概要 注文ブロックは、金融機関や銀行からの注文収集を示す市場行動です。著名な金融機関と中央銀行が外国為替市場を牽引しています。したがって、トレーダーは市場で何をしているのかを知る必要があります。市場が注文ブロックを構築するとき、それは投資決定のほとんどが行われる範囲のように動きます。 注文の構築が完了すると、市場は上向きと下向きの両方に向かって急激に動きます。注文ブロック取引戦略の重要な用語は、機関投資家が行っていることを含むことです。それらは主要な価格ドライバーであるため、機関投
Enigmera
Ivan Stefanov
5 (4)
エニグメラ:市場の中核 https://www.enigmera.com はじめに このインディケータと取引システムは、金融市場に対する驚くべきアプローチです。ENIGMERAは、フラクタルサイクルを使用して、サポートとレジスタンスレベルを正確に計算します。本格的な蓄積局面を示し、方向性と目標を示します。 トレンド中でも調整中でも機能するシステムです。 どのように作動するのか? ENIGMERAは、支持線・抵抗線、目標線、乖離線の3つのラインで構成されています。このシステムは、過去のデータを現在と未来に外挿する典型的な市場指標とは異なり、現在の完全な画像を提供します。支持線上にある場合、それは本当の支持を意味し、抵抗線上にある場合、それは本当の抵抗を意味する。ある水準が破られた場合、それはトレンドの変化を意味する。再描画はしない。 市場は常に進化しているため、ENIGMERAはその評価ツールを適応させ、定期的に戦略を修正しています。  これにより、すべてのシナリオが徹底的に評価されることが保証されます。この市場指標の独自性は、その能力を見れば明らかです。  ENIGM
トレンドトレーディング は、タイミングのプルバックとブレイクアウトにより、市場で起こっているトレンドから可能な限り利益を得るように設計された指標です。確立されたトレンドの中で価格が何をしているかを分析することにより、取引の機会を見つけます。 [ インストールガイド | 更新ガイド | トラブルシューティング | よくある質問 | すべての製品 ] 自信を持って効率的に金融市場を取引する むち打ちにならずに確立されたトレンドから利益を得る 収益性の高いプルバック、ブレイクアウト、早期の逆転を認識する この指標は、独自の品質とパフォーマンスを分析します 複数時間枠のダッシュボードを実装します インジケーターは再描画されていません 電子メール/音声/視覚アラートを実装します 確立されたトレンドは多くの取引機会を提供しますが、ほとんどのトレンド指標はそれらを完全に無視しています。インジケーターの解釈はかなり簡単です: (1) トレンドの変化 (2) トレンドの方向への後退 (3) トレンドの方向へのブレイクアウト 赤いダッシュ は下降トレンド中の修正です 青いダッシュ は上昇ト
最初のパルスレベルを反転 (RFI)     指示する     ロシア     -        utilizar con   el indicador の ESP 推奨事項 -   TPSpro トレンド プロフェッショナル版 -   MT5のバージョン 最も重要なことは、将来においても最も重要なことです。 機能のプリンシパル: ゾーンのほとんどは、ベンダーとコンプラドールによってアクティブ化されます。 状況を直感的に把握できるよう、初期の衝動を修正します。 LOGIC AI: MUESTRA zonas (círculos) parabuscar puntos de entrada cuando se activa una plantilla 視覚的に優れた視覚効果があり、最も重要な機能がすべて揃っていることに注意してください。 優れたニベレス/ゾーンの視覚化 (modo MTF) 世界で最も人気のある場所/ゾーンです。これを使用するのに最適な方法です (   TPSproTREND PRO   )。 アルゴリズム プロフェッショナル セパラド パソ ア パソ パラ オペラ それは
Connect Indicator is a tool used for connecting indicators between the MQL market and MT4. The connected indicators are made by our group and can be used for other applications, such as sending messages to the Line application or Telegram application. If you have any questions, please don't hesitate to ask us to receive support. Function and indicator buffer Buffer one is the high price of the previous candle. Buffer two is the high price of the previous candle. Usage To connect indicators to fu
Volatility Trend System - a trading system that gives signals for entries. The volatility system gives linear and point signals in the direction of the trend, as well as signals to exit it, without redrawing and delays. The trend indicator monitors the direction of the medium-term trend, shows the direction and its change. The signal indicator is based on changes in volatility and shows market entries. The indicator is equipped with several types of alerts. Can be applied to various trading
TPA True Price Action indicator reveals the true price action of the market makers through 100% non-repainting signals (except early signals mode) strictly at the close of a candle! TPA shows entries and re-entries, every time the bulls are definitely stronger than the bears and vice versa. Not to confuse with red/green candles. The shift of power gets confirmed at the earliest stage and is ONE exit strategy of several. There are available now two free parts of the TPA User Guide for our custo
Step into the realm of Forex trading with confidence and precision using XQ, a cutting-edge Forex indicator designed to elevate your trading game to unprecedented heights. Whether you're a seasoned trader or just stepping into the world of currency exchange,   XQ Forex Indicator   empowers you with the insights and signals needed to make informed trading decisions. The signal conditions are a combination of three indicators, and XQ Forex Indicator only display  medium and long-term trends . The
Ultimate Sniper Dashboard
Hispraise Chinedum Abraham
4.85 (27)
299ドルで割引中! 今後値上げの可能性あり! 下の説明を読んでください! 究極のスナイパーダッシュボードのための最高のエントリーシステム。究極のダイナミックレベル。(私の製品をチェックしてください) 究極のスナイパーダッシュボードはMT4多通貨テスト制限のため、ライブマーケットでのみ作動します。 究極のスナイパーダッシュボードをご紹介します。HA-Sniper、MA-Sniper、その他多くの特別なモードが含まれる最高の製品です。究極のスナイパーダッシュボードは絶対的な獣です! 初心者やエキスパートトレーダーにとって最高のソリューションです。もう二度と動きを見逃さない! シンプルさとピップを愛するトレーダーのために、特別な製品をご用意しました。シンプルでありながら、ダッシュボードは複数のカスタムアルゴリズムに基づき28の通貨ペアを監視し、すべての作業を行います。たった一つのチャートで、プロのように市場を読み解くことができます。もし、為替ペアが動き出したときに、その方向性を正確に特定することができれば、あなたの取引はどれほど改善されることでしょう。   当社のシ
Indicator : RealValueIndicator Description : RealValueIndicator is a powerful tool designed specifically for trading on the EURUSD pair. This indicator analyzes all EUR and USD pairs, calculates their real currency strength values, and displays them as a single realistic value to give you a head start on price. This indicator will tell you moves before they happen if you use it right. RealValueIndicator allows you to get a quick and accurate overview of the EURUSD currency pair tops and bottoms,
Cycle Sniper
Elmira Memish
4.41 (39)
NEW YEAR SALE PRICE FOR LIMITED TIME!!! Please contact us after your purchase and we will send you the complimentary indicators to complete the system Cycle Sniper is not a holy grail but when you use it in a system which is explained in the videos, you will feel the difference. If you are not willing to focus on the charts designed with Cycle Sniper and other free tools we provide, we recommend not buying this indicator. We recommend watching the videos about the indiactor and system before pu
How to use Pair Trading Station Pair Trading Station is recommended for H1 time frame and you can use it for any currency pairs. To generate buy and sell signal, follow few steps below to apply Pair Trading Station to your MetaTrader terminal. When you load Pair Trading Station on your chart, Pair Trading station will assess available historical data in your MetaTrader platforms for each currency pair. On your chart, the amount of historical data available will be displayed for each currency pai
The indicator is designed to work on any trading platform. The program is based on proprietary algorithms and W.D.Ganna's mathematics, allowing you to calculate target levels of price movement based on three points with the highest degree of certainty. It is a great tool for stock trading. The indicator has three buttons: NEW - call up a triangle for calculation. DEL - delete the selected triangle. DELS - completely remove all constructions. The probability of achieving the goals is more than 80
The AT Forex Indicator MT4 is a sophisticated trading tool designed to provide traders with a comprehensive analysis of multiple currency pairs. This   powerful indicator   simplifies the complex nature of the forex market, making it accessible for both novice and experienced traders. AT Forex Indicator uses   advanced algorithms   to detect trends, patterns and is an essential tool for traders aiming to enhance their forex trading performance. With its robust features, ease of use, and reliabl
回帰取引を意味する専門的かつ定量的なアプローチを実装する独自の指標。これは、価格が予測可能かつ測定可能な方法で迂回して平均に戻るという事実を利用しており、非定量的な取引戦略を大幅に上回る明確な出入りルールを可能にします。 [ Installation Guide | Update Guide | Troubleshooting | FAQ | All Products ] 明確な取引シグナル 驚くほど簡単に取引できます カスタマイズ可能な色とサイズ パフォーマンス統計を実装します ほとんどの取引戦略を上回ります 適切なSLおよびTPレベルを表示します 電子メール/音声/視覚アラートを実装します 使い方 インディケータは、より高い時間枠からの完全にカスタマイズ可能な移動平均の周りの標準偏差を測定し、トレンドフォローアプローチを使用して正確に取引を見つけます。取引は、現在のチャートの価格アクションに飛び込むことによって見つけられ、価格が選択したより高い時間枠から計算された平均価格帯に戻ったときに閉じられます。それがコード化される方法のために、指標は高ボラティリティと強いトレンドの
Introduction to X3 Chart Pattern Scanner X3 Cherart Pattern Scanner is the non-repainting and non-lagging indicator detecting X3 chart patterns including Harmonic pattern, Elliott Wave pattern, X3 patterns, and Japanese Candlestick patterns. Historical patterns match with signal patterns. Hence, you can readily develop the solid trading strategy in your chart. More importantly, this superb pattern scanner can detect the optimal pattern of its kind. In addition, you can switch on and off individu
ECM Elite Channel is a volatility-based indicator, developed with a specific time algorithm, which consists of finding possible corrections in the market. This indicator shows two outer lines, an inner line (retracement line) and an arrow sign, where the channel theory is to help identify overbought and oversold conditions in the market. The market price will generally fall between the boundaries of the channel. If prices touch or move outside the channel, it's a trading opportunity. The
TrendMaestro
Stefano Frisetti
5 (3)
note: this indicator is for METATRADER4, if you want the version for METATRADER5 this is the link:  https://www.mql5.com/it/market/product/108106 TRENDMAESTRO ver 2.4 TRENDMAESTRO recognizes a new TREND in the bud, he never makes mistakes. The certainty of identifying a new TREND is priceless. DESCRIPTION TRENDMAESTRO identifies a new TREND in the bud, this indicator examines the volatility, volumes and momentum to identify the moment in which there is an explosion of one or more of these data a
This product is based on the methodologies of Gann, his follower Don E. Hall. The Indicator builds a working view grid, which is used to analyze graphics. The Pyrapoint tool, developed by Don Hall, is a grid based on the Pythagorean cube. In his calculations he uses the Gann Square 9 methodology and the relationship between Price and Time. This tool is used to predict changes in trend and overall market actions. More information about the method   HERE
3 Indicators in 1 indicator Strategy based on price action Made specifically for the best forex currency pairs Can be used in the best time frame of the market at a very reasonable price This indicator is basically 3 different indicatos . But we have combined these 3 indicators in 1 indicator so that you can use 3 indicators at the lowest price. All three strategies are based on price action. But based on different trends. Long term, medium term and short term Attributes : No repaintin
Max Payneは、矢印の形でシグナルを与える反転/トレンドシグナルインジケーターです。このインジケーターは、同じバーの終値でシグナルを出します。このインジケーターは、異なる期間でチャート上に複数回ドロップして、シグナルの2倍/3倍の確認を取得できます。 このインジケーターは、あらゆる取引スタイルに合わせて高度に調整できますが、再描画やバックペイントは一切行われません。購入後には、使用したテンプレートとともにスクリーンショットに表示される完全なシステムが表示されます。 ----------------- 取引方法: トレンドフィルター(購入後に得られるペイントレンド)が方向に一致している間、同じバーでトリプル確認が得られるまで待ちます 取引を開始し、買い取引の場合は金色の矢印 (テンプレート) より下、売り取引の場合は金色の矢印 (テンプレート) より上にストップロスを設定します。終了シグナルは最初の反対側の白い点のシグナル (テンプレート) です。 ----------------- パラメーター : 信号周期:矢印周期 フィルター: 信号フィルター 距離 : ローソクからの矢印
JULY OFFER 80% OFF next price for unlimited version will be 17000$. This is the only time you can get this institutional and professional indicator at this price for unlimited version. Don't dare to miss this. The tool I am about to introduce to you you can't compare it with other tools due to its strategy and accuracy level in predicting the next price directional movement . This tool is designed for serious traders who have decided to make a difference through trading. Be the next person to wi
Dear Traders this is my another tool called " Swing Master Indicator ". As the name above the indicator is designed to help you in swing trading by capturing the low and highs of the price. You may us this tool with any trading strategy and style from scalping to position trading. It is made for level of traders including newbies and advanced traders even prop-firms, hedge funds and banks to help them make sold market analysis. I create tools for serious traders who want to make a difference in
This indicator has been developed to identify and display these trends quickly and easily, allowing you to see instantly, those currency pairs which are trending, and those which are not – and in all timeframes, with just one click. The 28 currency pairs are displayed as a fan as they sweep from strong to weak and back again, and this is why we call it the ‘currency array’. All 28 pairs are arrayed before you, giving an instant visual description of those pairs that are trending strongly, those
The indicator " ZigZag on Trend " is an assistant in determining the direction of price movement, as well as a calculator of bars and points. It consists of a trend indicator, which follows the price direction by the trend line presented in the form of a zigzag and a counter calculating the number of bars traversed in the direction of the trend and the number of points on the vertical scale. (calculations are carried out by the opening of the bar) The indicator does not redraw. For convenience,
作者のその他のプロダクト
もちろんです。以下は、提供いただいたテキストの日本語への翻訳です: MT4用の天文学指標をご紹介します:究極の天体トレーディングコンパニオン トレーディング体験を天空の高みに高める準備はできていますか?私たちの革命的なMT4用の天文学指標をご紹介します。この革新的なツールは、複雑なアルゴリズムの力を借りて、類まれなる天文学的洞察と精密な計算を提供します。 あなたの指先で宇宙の情報を: 宝のような天文学的データが明らかになる包括的なパネルをご覧ください。惑星の地理的/太陽中心座標、太陽と地球の距離、星の大きさ、伸び、星座、黄道座標および赤道座標、さらには水平座標まで、それぞれが綿密に計算され美しく表示されています。指標によって生成される垂直線は時間値に対応し、トレーディングの旅に宇宙の視点を提供します。 惑星のラインと関係: グラフを飾る惑星のラインの魔法を体験し、スケールと角度をカスタマイズできます。直感的なコントロールパネルを介して各惑星のラインの表示を簡単に切り替えることができます。指定された時刻範囲内での合会、六分会、四分会、三分会、対会、逆行の指標で天体の関係の芸術を発見してく
Gannスクエアインジケーターは、W.D. Gannによって執筆された「市場予測のための数学的な式」の記事に基づく強力な市場分析ツールです。このツールは、解析に数学的な概念を応用し、Gann理論に基づいています。それは、144、90、52のスクエアや9のスクエアなど、Gannの関連テクニックの要素を取り入れています。さらに、の方法を組み込んでおり、9のスクエアとその関連性についてのチャネルやスターパターンに焦点を当てています。 ユーザーマニュアルと使用方法: このインジケーターを使用する前に、ユーザーマニュアルを読んで疑問点を解決するためにお問い合わせいただくことをお勧めします。ユーザーマニュアルの完全版は、当社のウェブサイトで入手できます。 MT5の完全版は購入できますし、MT4の無料版も試すことができます。両方のバージョンへのリンクを提供していますので、ご利用ください。 主な機能と機能: Gannスクエアインジケーターは、市場分析のための完全なツールセットを提供し、幾何学的な概念とGann理論に基づいて的確な判断を行う手助けをします。以下に主な機能を示します。 9のスクエアの分析:
ON Trade Waves Patterns Harmonic Elliot Wolfeをご紹介します。これは手動および自動の方法を使用して市場のさまざまなパターンを検出するために設計された高度なインジケーターです。以下はその動作方法です: ハーモニックパターン: このインジケーターは、チャートに表示されるハーモニックパターンを識別できます。これらのパターンは、Scott Carneyの「Harmonic Trading vol 1および2」で説明されているように、ハーモニックトレーディング理論を実践するトレーダーにとって重要です。手動で描画するか、自動検出に頼るかにかかわらず、ON Trade Waves Patternsがお手伝いします。 コントロールパネル: このインジケーターはユーザーフレンドリーなコントロールパネルを備えています。チャートと時間枠の設定を保存し、異なる構成間をスムーズに切り替えることができます。チャートスペースを最大限に活用するために最小化することもできます。他の分析ツールで作業することを好む場合、閉じるボタンをクリックするだけで、すべてのインジケーターデ
このインジケータは、手動および自動的な方法でチャートに描かれたハーモニックパターンを検出します。ユーザーマニュアルは、このリンクから参照できます: あなたのレビューを追加し、入手するために私たちに連絡してください。 この製品をmt4で試すための無料版があります。 GartleyおよびNenstarパターンを検出するために使用できます。 https://www.mql5.com/en/market/product/30181 完全なMT4バージョンを購入するには、次の場所から購入できます。 https://www.mql5.com/en/market/product/15212 注 インジケータにはコントロールパネルがあり、すべての(チャート&時間枠)設定が保存されます。チャート上でスペースをより多く確保するために、最小化することができ、他の分析ツールで作業する場合は、すべてのインジケータデータを非表示にするために閉じるボタンを押すことができます。 このインジケータを使用して設定を変更し、移動平均やボリンジャーバンドなどのインジケータを追加すると、編集のテンプレートが自動的に保存され、必
このインジケーターは、エリオット波動理論と組み合わせて作動し、2つの方法で使用されます: 自動モード: このモードでは、インジケーターがチャート上の全ての5つのモーティブ波を自動的に検出し、予測とポテンシャルな逆転ゾーンを提供します。また、アラートやプッシュメッセージを生成する能力も備えています。この自動機能により、エリオット波動パターンの識別と分析のプロセスが効率化されます。 手動モード: このオプションは、エリオット波動理論を手動で扱いたいトレーダー向けです。9つの段階を使用して波を描画することができます。各段階は、表示された後に描画されたラインを調整して個別に定義できます。この機能により、手動で波を描画するプロセスがより効率的になります。重要な点として、すべての描画データが将来の参照のためにプラットフォームのデータフォルダに保存されることに注意してください。 パラメータ: Name: インジケーターの名前。 Use_System_Visuals: インジケーターのテーマを有効または無効にして、取引プラットフォーム全体の外観に合わせます。 Explain_Comment: 波の番号
This indicator has a lot of numerology analyzing methods that can support your analyzes or can work as custom strategy by it self ..we will start to explain them one by one :  this the trial version of this product to have this product here is the link : https://www.mql5.com/en/market/product/118782   1- Range channel that draws the limits of daily movements to detect places of buy and places of sell . 2- Angler will detect Dynamic numeral levels that result of time and price squaring with cus
FREE
この製品を使用すると、多くの機能を使用して注文とアカウントを管理できます 1- アカウント サイズ / SL サイズ / 1 ロット サイズのペア ポイント値に応じて、正しいロット サイズを計算します。 2- ラインの場所 (ターゲット SL TP) に応じて現在の注文状況を表示します。 3- ボタンを 1 回押すだけで、すべての注文をターゲット / SL に移動します。 4- アカウントに関する情報と、注文を開くために必要なマージンを表示します。 5- すべての注文 (シンボルまたはすべて) をクローズする機能があります。 6- 損益分岐点に達し、利益を保護する機能があります。 7- すべてのペアで簡単に使用できます。 レビューを追加することを忘れないでください
FREE
この指標は、W.D。Gannが書いた「市場予測の数式」​​の記事に基づく市場分析手法であり、9の2乗と144の2乗に依存しています。 ユーザーマニュアル: Add Your review And contact us to get it MT5のフルバージョンは次の場所から購入できます。 https://www.mql5.com/en/market/product/28669 あなたは無料でMT4でテストすることができます: https://www.mql5.com/en/market/product/15316 この製品は、レベル/スター/グリッド/ガンファン/として9の正方形を描くことができます。 ガンスクエアも描画します:52/90/144。 チャート上で直接移動可能なフリーガンスターを描画します。 また、ガンダイヤモンドを描画します。 それはあなたがあなたのエントリーのために最高のロットを計算することができるようにするロット計算機を持っています。 インジケーターにはパネルがあり、次のことができます。 144/90/5
FREE
This indicator will detect harmonic patterns that are drawn on the chart by manual and automatic methods. You can see user manual from this link: https://www.mql5.com/en/blogs/post/719257 There is a free version (it detect only Gartley and Nenstar Patterns) to try this product. You can buy the full MT4 version from: https://www.mql5.com/en/market/product/104689 Notes When you use this indicator and change the settings, add indicators like Moving Average or Bollinger Bands, this indicator will
FREE
ゴールドグラム価格計算ツールインジケーターのご紹介 地域通貨における金価格を常に把握したいですか?もっと探す必要はありません。ゴールドグラム価格計算ツールインジケーターは、お好きな地域通貨でグラム当たりの金価格をリアルタイムで計算できる画期的なツールを提供します。このインジケーターを使用することで、金融洞察力を活用して情報に基づいた意思決定ができます。 主な特徴: 地域化された金価格: ゴールドグラム価格計算ツールインジケーターは、特定の地域通貨での金属のグラム単位の価格、具体的には金のグラム単位の価格を提供します。これにより、身近な通貨で金の価値を便利に追跡できます。 ユーザーフレンドリーな設定: 当インジケーターは利便性を考慮して設計されています。インジケーターの設定から直接調整するか、メインチャート上で調整することができ、シームレスで個別の体験が可能です。 パラメータの説明: Use_System_Theme (システムテーマを使用): 好みのカラースキームを選択するオプションで、インジケーターの視覚的な外観を取引環境に簡単に統合できます。 Ounce_Value (オンス価値)
FREE
ON Trade Pivots is A technical indicator that Draws all Pivot levels depending on time frame that defined in settings. Notes It will be good tool for all traders who use pivot levels in their trades. Let me inform you that this indicator draw this level as buffers not as objects then you can connect it easily to EA. This indicator allow you to find pivots levels for any time frame not only daily you are free to choose time frame from settings. Parameters Use_System_Visuals - Enable /Disable
FREE
このインジケーターは、トレードチャート上でドンチャンチャネルを視覚的に表現するためのものです。ドンチャンチャネルは、特定の期間における最高値と最低値の間の範囲を描画するためのシンプルなテクニカルツールです。このインジケーターは、価格動向の視覚的な分析を向上させ、潜在的なブレイクアウトとトレンドの継続ポイントに関する洞察を提供します。ドンチャンチャネルは、現在の時間枠とより高い時間枠の両方に適用できるため、このオプションを有効にすることができます。 インジケーターの主な特徴: Use_System_Visuals: このパラメータを有効にすると、システムの視覚スタイルとインジケーターの外観を切り替えることができます。有効にすると、インジケーターの視覚的要素はトレードプラットフォーム全体のテーマに合わせられます。 Signal_from_HT_Timeframe: このオプションを有効にすると、より高い時間枠からのシグナルを受信できます。言い換えれば、現在の時間枠でのトレーディングの決定に影響を与えるために、より長い時間枠でのドンチャンチャネルの動作を考慮できます。 HT_Timefram
FREE
このインジケーターは、「回帰チャンネルツール」のコンセプトに基づいた堅牢な市場分析手法を提供します。このツールを活用することで、トレーダーはチャートの回帰チャンネルに対して優れたコントロールを行い、より情報を得てトレードの決定を行うことができます。 回帰チャンネルツールは、トレーダーのツールボックスにおける強力な道具です。価格トレンドや潜在的なサポートと抵抗レベルに対する貴重な洞察を提供することを目的としています。このツールは特にトレンド内の修正波動を視覚化するのに効果的であり、価格のダイナミクスの包括的なビューを提供します。 以下は、このインジケーターを使用する際の主な特徴と利点について詳しく説明します: チャンネルレベルとサポート/レジスタンス: このインジケーターの主な利点の一つは、動的なサポートとレジスタンスゾーンとして機能するチャンネルレベルを生成する能力です。これらのレベルは潜在的なエントリーポイントや出口ポイントを特定するのに重要であり、トレーディング戦略の精度を向上させます。 修正波動レベル: 修正波動レベルを有効にすることで、トレーダーは大きなトレンド内での潜在的な修
"私たちの強力な外国為替インジケーターをご紹介します。これは、トレード戦略を向上させ、市場のトレンドについて正確な洞察を提供するために設計されました。この先進のツールは、蝋燭の測定を詳細に分析し、最適な精度を得るために調整を行う複雑なカスタムアルゴリズムを使用しています。その結果、戦略的なエントリーポイントを示すチャート上に巧みにプロットされた矢印のセットが得られます。 このインジケーターの素晴らしさは、蝋燭のパターンの力を活用し、それらを慎重に調整された調整と組み合わせる能力にあります。これにより、市場の動きに対する独自の視点が提供され、トレードの意思決定に優位性が生まれます。 このインジケーターの際立った特徴の1つは、H1時間枠での優れたパフォーマンスです。この時間枠に特化したトレーダーは、正確なエントリーポイントの多くを提供することがわかるでしょう。ただし、私たちは相乗効果の力を信じています。このインジケーターは単独で強力なツールですが、より広範なトレード戦略に組み込まれると、そのパフォーマンスはさらに向上します。既存のアプローチと組み合わせることで、その真のポテンシャルが発揮さ
もちろん、こちらが日本語への翻訳です: "このインジケーターは、バイストラ・パターン理論に基づいてエントリーを検出し、エントリー値を提供し、ターゲットとストップのレベルでリミットオーダーを配置します。これにより、リスクの割合を計算できます。 注意事項: このインジケーターにはEAで使用できるバッファがあります。 この製品を使用する際には、良好なマネーマネジメントを実践することが重要です。 タイムフレームを変更すると、 インジケーターは前回のセッションで使用したテンプレートを保存します。 この方法を学ぶための書籍が必要な場合は、購入後にお知らせいただくか、ご購入後にご意見をお寄せください。 パラメーター: システムビジュアルを使用 - この製品の視覚的なテーマを有効/無効にします。 スピードに関連 - 最後の波の速い動きのみでパターンを検出するを有効/無効にします。 最後のキャンドルカウンターを表示 - キャンドルタイマーを有効/無効にします。 キャンドルカウンターの色 - キャンドルタイマーのテキストの色。 上昇パターンの色 - 上昇パターンの色。 下降パターンの色 - 下降パターンの
もちろん、こちらが「Fibo Star」という指標についての詳細な説明です。これはFibonacciファンを星の形でチャートに描画するためのもので、価格の動きに効果的であり、描画と設定を行う際の手間を減らすためのコントロールパネルもサポートされています。 使用方法: この指標は手動の使用になります。効果的に使用するためには、以下の手順に従ってください: チャート上でFibonacciファンを描画するための高値と安値のポイントを特定します。 これらの高値と安値に紫色のラインを置きます。 価格がこれらのラインに到達するのを待ち、それらがサポートと抵抗のラインとして機能するのを観察します。 パラメータ: Use_System_Theme: このパラメータを使用して、外観をトレーディングプラットフォーム全体のテーマに合わせるか、独自にカスタマイズするかを選択できます。 Levels_Color: Fibonacciファンのレベルに適用する色を選択します。 Levels_Style: Fibonacciファンのレベルのスタイルを定義し、外観を好みに調整します。 Levels_Width: チャー
「通貨強度インジケーター」は、外国為替市場での異なる通貨の相対的な強さに関する情報を提供するために開発された強力なツールです。各通貨の強さをそれぞれの対応する時間枠に基づいて計算し描画することで、この指標はトレーダーに、特に顕著なダイバージェンスやクロスが観察された場合に潜在的なトレード機会を特定する機会を提供します。 指標の主な特徴: 1. 通貨の強さの計算: この指標は、各通貨の強さを対応する時間枠に基づいて計算します。この計算は、指定された期間内に一つの通貨が他の通貨のバスケットに対するパフォーマンスを評価することを含みます。これにより、トレーダーは通貨の相対的な強さまたは弱さを理解することができます。 2. 収縮とダイバージェンス: 2つの通貨の強さの間に収縮またはダイバージェンスの動きがある場合、これは潜在的なトレード機会を示唆する可能性があります。例えば、ある通貨が著しく強くなる一方、別の通貨が弱くなる場合、可能なエントリーポイントを示す可能性があります。 3. ゼロレベルのクロス: この指標は、通貨の強さがゼロレベルをクロスする場合も識別します。ゼロを上回るクロスは強化傾
強力な価格アクションパターンを検出するためのテクニカルインジケーター:ピンバー、インサイドバー、アウトサイドバー はじめに: テクニカル分析の領域において、価格アクションパターンは市場の動向の可能性を示す重要な指標です。私たちは、チャート上での堅牢な価格アクションパターンの特定を効率化する高度なテクニカルインジケーターを開発しました。私たちのインジケーターは、ピンバー、インサイドバー、アウトサイドバーの3つの基本的なパターンを検出するのに特化しています。 主な検出パターン: ピンバー: ピンバーパターンは、市場トレンドのポテンシャルな反転を示す単一のローソク足の形成です。小さな実体と、実体の上または下に突き出る長いしっぽまたは「ヒゲ」が特徴です。バルシュピンバーは可能なバルシュ反転を示し、ベアリッシュピンバーはベアリッシュ反転を示唆します。 インサイドバー: インサイドバーパターンは、単一のローソク足の価格範囲が前のローソク足の価格範囲に含まれるときに発生します。このパターンは一時的な相場のコンソリデーションや未決定を示し、しばしばどちらかの方向にのみブレイクアウトする前に現れます。
This indicator will give you entries as result of scalping strategy that will be applied on 14 symbols in same time and you are able to be notified with this entries  Note :   This indicator for scalping on 5 minutes timeframe only . How to use it : 1-Open chart and adjust settings (edit symbols names as your platform names , activate the alert system if you need it . 2-Wait for any signal you have it from this scanner you will have it as alert and as notification and you will see it on bo
This indicator gives you the signal of real cross on stochastic indicator. This indicator is easy to attach to an ea. This indicator will work best on All time frames. Arrow appears depending on many algorithms that study the cross parameters. Indicator properties Use_System_Visuals: enable/disable visual styles. Stochastic_K_Period. Stochastic_D_Period. Stochastic_Slowing. Use_Notifications: enable/disable Push Notifications. Use_Alert: enable/disable Alerts. Use_E_Mail: enable/disable Email
「ON Trade VSA」をご紹介します - ボリュームと分布の究極の分析ツール! 我々の先進的な指標「ON Trade VSA」を使って、ボリュームスプレッド分析(VSA)の力を解き放ちましょう。VSAは、市場の強さを評価し、トレンドを特定し、情報に基づいた判断を行うためのトレーダーによって使用される強力な手法です。以下に、「ON Trade VSA」を必携の取引ツールとするための主な特徴を探ってみましょう: マルチカラーのボリュームキャンドル :平均動きに基づいてボリュームキャンドルに異なる色を割り当てるユニークな機能を通じて、市場のダイナミクスについての洞察を得ることができます。この直感的な視覚化は、市場センチメントの変化を素早く把握するのに役立ちます。 強力なトレンドの検出 :私たちの指標は基本的な要素を超えます。グラフ上で最も強力なトレンドを正確に特定してプロットし、市場の主要な方向性を明確に示します。 ボリューム-レンジ乗数 :レンジにボリュームを乗じる機能を通じて、隠れたパターンを発見します。ボリュームと価格レンジの関係を分析することで、市場のボラティリティと潜在的なブ
This product is a part of  ON Trade Waves Patterns Harmonic Elliot Wolfe you can test free version on EURJPY from this link  Wolf Waves Indicator ウルフウェーブを発見しよう - あなたの究極の取引ツール! どんな時間軸でも簡単にウルフウェーブを見つけるための強力なツールを探していますか?もう探す必要はありません!私たちのウルフウェーブインジケーターは、その仕事を簡単にこなします。なぜこのインジケーターがあなたにぴったりか、以下でご紹介します。 主な特徴: 自動検出: ウルフウェーブインジケーターは、複雑なアルゴリズムを使用して、チャート上のキーポイントを自動的に見つけ、対応するラインを描画します。手動でパターンを探す手間が不要です。 使いやすさ: このインジケーターはシンプルなデザインで、経験豊富なトレーダーからウルフウェーブ初心者まで、誰でも簡単に利用できます。 高精度: 数多くのウルフウェーブインジケーターの中で、当社のものは完璧
This program serves as an effective tool for sending messages through a Telegram bot using the MetaTrader platform. It enables you to send your trading recommendations related to the orders you open on the trading platform directly to your Telegram channel or group. These messages may include details about open trades and can be accompanied by illustrative images of the orders. Alternatively, they can be configured to be without images based on your preferences. This means that if you are the ow
新しいインジケーターのご紹介:[ON Trade Breakout Zone] すべてのトレーダーに向けたシンプルでありながら強力な市場分析ツール! プロフェッショナルから初心者まで、どなたにも適しています トレーディング戦略を一層強力にしませんか?当社の最新のインジケーターは市場分析を簡素化し、あらゆるレベルのトレーダーに力を与えるよう設計されています。経験豊富なプロであろうと、たった今始めたばかりであろうと、[ON Trade Breakout Zone] は市場で潜在的な利益を引き出すための鍵です。 [ON Trade Breakout Zone] の使い方: この賢明なツールは、毎日、先進的なアルゴリズムを使用してチャート上にゾーンを描きます。最大限に活用する方法は以下の通りです: ゾーンの識別: [ON Trade Breakout Zone] は高い精度でチャート上の重要なゾーンを識別し、潜在的なトレードの機会を簡単に見つけるのに役立ちます。 トレードの実行: 描かれたゾーンのどちらかの側に価格が移動するのを待ちます。 価格が購入ラインを上回った場合
This indicator has a lot of numerology analyzing methods that can support your analyzes or can work as custom strategy by it self ..we will start to explain them one by one :   1- Range   channel that draws the limits of daily movements to detect places of buy and places of sell . 2-   Angler   will detect Dynamic numeral levels that result of time and price squaring with custom numeral method that works like support and resistant and will support your analyzes 3-   Shepherd Levels   it is l
トレンドトレーディングの力をマスター このインジケーターは、初心者、中級者、そしてプロのトレーダー向けに設計されています。どの通貨ペアでも、正確に実際のトレンドを特定することで、トレーディングプロセスを簡素化します。 なぜこのインジケーターを選ぶべきなのか? - 簡単なトレード: もはや複雑な分析は必要ありません。インジケーターをチャートにロードし、買いまたは売りのシグナルを待つだけで、1日中チャートに貼り付く必要がありません。 - 明確なエントリーシグナル: インジケーターは正確なエントリーポイントを提供し、買いシグナルには青い矢印、売りシグナルには赤オレンジの矢印が表示されます。さらに、トレンドラインは市場の現在のトレンドを確認するために色が変わります。 - 理想的なタイムフレーム: 最良の結果を得るには、5分足のタイムフレームを使用することをお勧めします。H1のタイムフレームで再度インジケーターを適用してシグナルを確認することで、より正確なデータを得ることができます。 - スキャナーと組み合わせるとさらに強力: 内蔵スキャナーを使用して、すべての通貨ペアのトレンドを
Gannスクエアインジケーターは、W.D. Gannによって執筆された「市場予測のための数学的な式」の記事に基づく強力な市場分析ツールです。このツールは、解析に数学的な概念を応用し、Gann理論に基づいています。それは、144、90、52のスクエアや9のスクエアなど、Gannの関連テクニックの要素を取り入れています。さらに、の方法を組み込んでおり、9のスクエアとその関連性についてのチャネルやスターパターンに焦点を当てています。 ユーザーマニュアルと使用方法: このインジケーターを使用する前に、ユーザーマニュアルを読んで疑問点を解決するためにお問い合わせいただくことをお勧めします。ユーザーマニュアルの完全版は、当社のウェブサイトで入手できます。 MT5の完全版は購入できますし、MT4の無料版も試すことができます。両方のバージョンへのリンクを提供していますので、ご利用ください。 主な機能と機能: Gannスクエアインジケーターは、市場分析のための完全なツールセットを提供し、幾何学的な概念とGann理論に基づいて的確な判断を行う手助けをします。以下に主な機能を示します。 9のスクエアの分析:
このインジケーターは、「回帰チャンネルツール」のコンセプトに基づいた堅牢な市場分析手法を提供します。このツールを活用することで、トレーダーはチャートの回帰チャンネルに対して優れたコントロールを行い、より情報を得てトレードの決定を行うことができます。 回帰チャンネルツールは、トレーダーのツールボックスにおける強力な道具です。価格トレンドや潜在的なサポートと抵抗レベルに対する貴重な洞察を提供することを目的としています。このツールは特にトレンド内の修正波動を視覚化するのに効果的であり、価格のダイナミクスの包括的なビューを提供します。 以下は、このインジケーターを使用する際の主な特徴と利点について詳しく説明します: チャンネルレベルとサポート/レジスタンス:   このインジケーターの主な利点の一つは、動的なサポートとレジスタンスゾーンとして機能するチャンネルレベルを生成する能力です。これらのレベルは潜在的なエントリーポイントや出口ポイントを特定するのに重要であり、トレーディング戦略の精度を向上させます。 修正波動レベル:   修正波動レベルを有効にすることで、トレーダーは大きなトレンド内での潜
もちろんです。以下は、提供いただいたテキストの日本語への翻訳です: MT4用の天文学指標をご紹介します:究極の天体トレーディングコンパニオン トレーディング体験を天空の高みに高める準備はできていますか?私たちの革命的なMT4用の天文学指標をご紹介します。この革新的なツールは、複雑なアルゴリズムの力を借りて、類まれなる天文学的洞察と精密な計算を提供します。 あなたの指先で宇宙の情報を:   宝のような天文学的データが明らかになる包括的なパネルをご覧ください。惑星の地理的/太陽中心座標、太陽と地球の距離、星の大きさ、伸び、星座、黄道座標および赤道座標、さらには水平座標まで、それぞれが綿密に計算され美しく表示されています。指標によって生成される垂直線は時間値に対応し、トレーディングの旅に宇宙の視点を提供します。 惑星のラインと関係:   グラフを飾る惑星のラインの魔法を体験し、スケールと角度をカスタマイズできます。直感的なコントロールパネルを介して各惑星のラインの表示を簡単に切り替えることができます。指定された時刻範囲内での合会、六分会、四分会、三分会、対会、逆行の指標で天体の関係の芸術を発
フィルタ:
Abraham Correa
2387
Abraham Correa 2023.08.27 01:09 
 

ユーザーは評価に対して何もコメントを残しませんでした

Abdullah Alrai
41061
開発者からの返信 Abdullah Alrai 2023.08.27 07:15
Thanks mr abraham we will release other products also this week ..
Follow us on telegram if you like
https://t.me/On_Trade_Telegram
レビューに返信