• 概要
  • レビュー
  • コメント
  • 最新情報

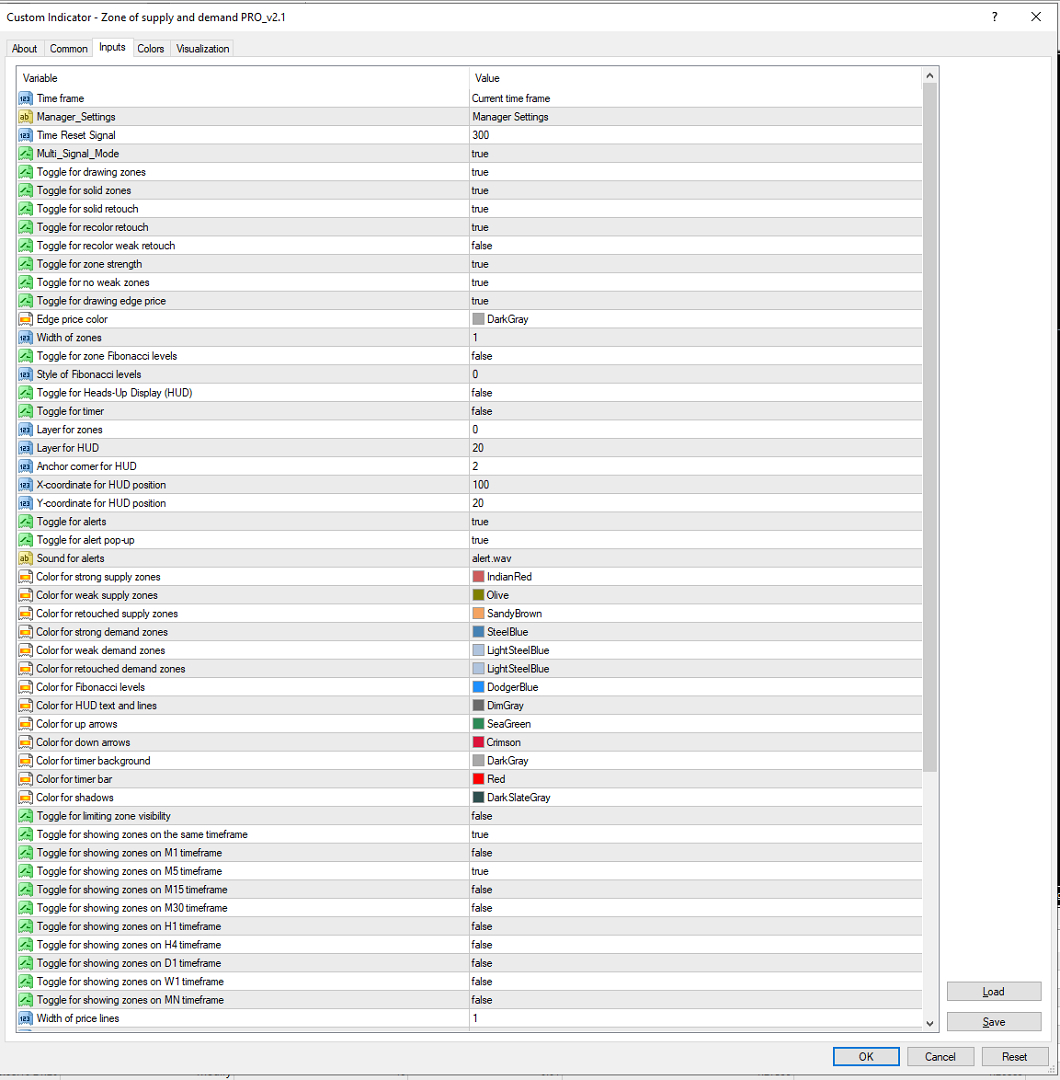
Zone of supply and demand Pro

Introducing the "Zone of Supply and Demand Pro" Indicator - Redefining Precision with Multi-Time Frame (MTF) Technology and Non-Repaint Capability

In the intricate world of financial markets, understanding supply and demand can be the key to success. We are excited to present the "Zone of Supply and Demand Pro" - a powerful analytical tool designed not only to help you seize trading opportunities but also to ensure unparalleled accuracy through groundbreaking technology.

**The Significance of Supply and Demand and Multi-Time Frame (MTF) Technology**

The "Zone of Supply and Demand Pro" is not just another tool; it is a major leap in displaying supply and demand on price charts. This indicator assists you in identifying and marking crucial supply and demand zones, revolutionizing your market perception.

**Non-Repaint Capability: Maximum Reliability for Trading Decisions**

One of the most remarkable features of the "Zone of Supply and Demand Pro" is its Non-Repaint capability. This means that the supply and demand zones displayed by the indicator are never repainted. You can trust that the information provided by the indicator is dependable and stable, facilitating smarter trading decisions.

**Unprecedented Benefits**

1. **Spot Breakthrough Opportunities**: By utilizing the "Zone of Supply and Demand Pro," you gain the ability to identify potential supply and demand zones where the equilibrium might shift abruptly. This empowers you not only to enter trades at the right moment but also to capitalize on breakout opportunities.

2. **Deeper Market Psychology Understanding**: Supply and demand zones are not just price levels; they reflect the psychology and interaction between buyers and sellers. The "Zone of Supply and Demand Pro" helps you gain a deeper understanding of market sentiment and identifies moments when supply and demand dynamics might change.

3. **Integrate Strategies with Multi-Time Frame (MTF) Technology**: The market operates across multiple time frames. Therefore, the "Zone of Supply and Demand Pro" integrates Multi-Time Frame (MTF) Technology, allowing you to confirm strong supply and demand zones across different time frames.

Elevate your approach to the financial markets with the "Zone of Supply and Demand Pro." Explore potential trading opportunities and ensure unmatched accuracy with exclusive non-repaint technology.
おすすめのプロダクト
【V1.00】MTF NRPA 5 RSI RTDがリリースされました! 非再描画矢印リアルタイム ダッシュボード。 さまざまな RSI インジケーターを使用するのにうんざりしていて、それらが不正確であると感じた場合は、このツールを試してください。 通常、時間枠内の OBOS レベルを決定するために RSI を 1 つだけインストールします。 悪いニュースは、さまざまな時間枠の OBOS レベルと傾向を一度に確認できないことです。 それが私がこの取引ツールを開発した理由です。 それは次のように説明されています。 この取引ツールでは、5 つの RSI を使用します。 はい、5つです! デフォルトでは、RSI 1 と RSI 2 を大きな時間枠、つまり M30 に設定します。 RSI 1 と RSI 2 の交差は、M30 タイムフレームでトレンドの変化があることを意味します。 次に、現在の(小さい)時間枠に RSI 3 と RSI 4 を設定します。たとえば、M5 でチャートを開いたとします。 RSI 3 と RSI 4 の交差点は、現在のタイムフレーム (M5) でトレ
This    Nice Trade Point     indicator is designed for signal trading. This indicator generates trend signals. It uses many algorithms and indicators to generate this signal. It tries to generate a signal from the points with the highest trend potential. This indicator is a complete trading product. This indicator does not need any additional indicators. The indicator certainly does not repaint. The point at which the signal is given does not change.     Features and Suggestions Time
Taurus All4 Taurus All4 is a high-performance indicator, it will tell you the strength of the trend, and you will be able to observe the strength of the candle. Our indicator has more than 4 trend confirmations. It is very simple and easy to use. Confirmation Modes Candle Trend Confirmations: When the candle switches to light green the trend is high. When the candle switches to light red the trend is reverting down. When the candle changes to dark red the trend is low. Trendline Trend Conf
SystemBinaryM1 - a professional indicator for trading short-term binary options, is a complete, self-contained author's strategy for working in the binary options market. The unique algorithm for analyzing the foreign exchange market is based on the calculation of reference points on three different time periods M15, M5. M1. Thus, the indicator simultaneously analyzes the long-term, medium-term and short-term price behavior before issuing a signal. The indicator is set in the usual way and work
I make this indicator to help you for setting effective stoploss and getting more signals from following trends. This indicator helps to tell the trends and sideway, when 2 lines stand above of blue cloud, it means uptrend. When 2 lines stand above red cloud, it means down trend, the other else, it means sideway market. For taking order, you have to wait the arrows. You also need to see the cloud position, if the cloud's res, you have to wait the yellow arrow for selling order. If the cloud's bl
Black series MT4 - The indicator is designed for trading on binary options with Timeframe M1-M5-M15 Multicurrency (Works on cryptocurrency and currency pairs) The signal appears when the candle opens Up to 90% correct signals There is no signal redrawing at all Can be used with other indicators. Good for scalping! In Settings there is: -Indicator working methods -I Allert Arrow color Red signal down Blue signal up Also watch the video how the indicator works and signals
VR Cub
Vladimir Pastushak
VR Cub は、質の高いエントリーポイントを獲得するためのインジケーターです。このインジケーターは、数学的計算を容易にし、ポジションへのエントリーポイントの検索を簡素化するために開発されました。このインジケーターが作成されたトレーディング戦略は、長年にわたってその有効性が証明されてきました。取引戦略のシンプルさはその大きな利点であり、初心者のトレーダーでもうまく取引することができます。 VR Cub はポジション開始ポイントとテイクプロフィットとストップロスのターゲットレベルを計算し、効率と使いやすさを大幅に向上させます。取引の簡単なルールを理解するには、以下の戦略を使用した取引のスクリーンショットを見てください。 設定、設定ファイル、デモ版、説明書、問題解決方法は、以下から入手できます。 [ブログ] レビューを読んだり書いたりすることができます。 [リンク] のバージョン [MetaTrader 5] エントリーポイントの計算ルール ポジションをオープンする エントリーポイントを計算するには、VR Cub ツールを最後の高値から最後の安値までストレッチする必要があります。
The indicator builds a graphical analysis based on the Fibonacci theory. Fibo Fan is used for the analysis of the impulses and corrections of the movement. Reversal lines (2 lines at the base of the Fibonacci fan) are used to analyze the direction of movements. The indicator displays the of 4 the target line in each direction. The indicator takes into account market volatility. If the price is above the reversal lines, it makes sense to consider buying, if lower, then selling. You can op
Owl smart levels
Sergey Ermolov
4.63 (54)
MT5版  |   FAQ Owl Smart Levels Indicator   は、 Bill Williams   の高度なフラクタル、市場の正しい波構造を構築する Valable ZigZag、エントリの正確なレベルをマークする Fibonacci レベルなどの一般的な市場分析ツールを含む 1 つのインジケーター内の完全な取引システムです。 利益を得るために市場と場所に。 戦略の詳細な説明 インジケータを操作するための指示 顧問-取引助手 プライベートユーザーチャット ->購入後に私に書いて、私はプライベートチャットにあなたを追加し、あなたはそこにすべてのボーナスをダウンロードすることができます 力はシンプルさにあります! Owl Smart Levels   取引システムは非常に使いやすいので、専門家にも、市場を勉強し始めて自分で取引戦略を選択し始めたばかりの人にも適しています。 戦略と指標に秘密の数式や計算方法が隠されているわけではなく、すべての戦略指標は公開されています。 Owl Smart Levels を使用すると、取引を開始するためのシグナルをすばやく確認し、
PABT Pattern Indicator - it's classical system one of the signal patterns. Indicator logic - the Hi & Lo of the bar is fully within the range of the preceding bar, look to trade them as pullback in trend. In the way if indicator found PABT pattern it's drawing two lines and arrow what showing trend way.  - First line - it's entry point and drawing at: 1. On the high of signal bar or on middle of the signal bar (depending from indicator mode) for buy; 2. On the low of signal bar or on middle of t
Fourteen plus nine What is it for? Applying Tom DeMark’s TD Sequential serves the purpose of identifying a price point where an uptrend or a downtrend exhausts itself and reverses. . What are the main components of TD Sequential? TD Sequential has two parts – TD Setup and TD Countdown. The first phase of TD Sequential starts with a TD Setup and is completed with a 9 count. When the 9 count is completed, it is at that point, a price pause, price pullback, or reversal is likely. It is also at tha
Price reach indicator. It also serves as the perfect term for supports and resistance. I use it in two experts. The basic tool for professional trading. The indicator analyzes the last 500 bar and uses this to determine the levels ( but it doesn't predict the future ) . Personally, I use it on TF H1.  It is very simple. Four lines on chart and that's all. Only two input parameters.  Thousands of indicators. Why this? Is good ? No! Is very good. Please test the indicator prior to purchasing.
PipFinite Trend PRO
Karlo Wilson Vendiola
4.9 (2779)
Breakthrough Solution For Trend Trading And Filtering With All Important Features Built Inside One Tool! Trend PRO's smart algorithm detects the trend, filters out market noise and gives entry signals with exit levels. The new features with enhanced rules for statistical calculation improved the overall performance of this indicator. Important Information Revealed Maximize the potential of Trend Pro, please visit www.mql5.com/en/blogs/post/713938 The Powerful Expert Advisor Version Automa
The trend is your friend! This is what this indicator is all about. Follow this famous saying and be safe. Characteristics: Buy/Sell signals fixed on the close of a bar. Works on all symbols and all timeframes. Clear visual market trend laser line, Buy/Sell signal arrows, market strength meter, TP1 & TP2 boxes. Visual signals when to enter, when to exit the market. No repainting. Compatible with Flexible EA for trading automation. (Ask for a free set file optimized to perform 2010-2018) Para
"The trend is your friend" is one of the best known sayings in investing, because capturing large trendy price movements can be extremely profitable. However, trading with the trend is often easier said than done, because many indicators are based on price reversals not trends. These aren't very effective at identifying trendy periods, or predicting whether trends will continue. We developed the Trendiness Index to help address this problem by indicating the strength and direction of price trend
The Arriator forex indicator algorithm allows you to quickly determine the current trend in the market. The Elephant indicator accompanies long-term trends and can be used without restrictions on instruments or timeframes. This indicator not only helps predict future values, but also generates buy and sell signals. It tracks market trends, ignoring wild swings and market noise around the average price. The indicator implements a type of technical analysis based on the idea of ​​market cyclicalit
The LineMagnit Indicator for MT4 is a highly precise tool that builds support and resistance levels which magnetically attract prices. This feature allows traders to easily determine the most probable entry and exit points in the market, as well as identify the market's directional forces, as levels are based on capital inflows into the instrument. Equipped with an intuitively understandable graphical interface, the LineMagnit Indicator enables users to quickly locate and analyze support and res
This indicator is another variant of the famous powerful indicator Fibonacci-SS https://www.mql5.com/en/market/product/10136 but has different behaviour in placing Pending Order and TP Line. Automatically places Fibonacci retracement lines from the last highest and lowest visible bars on the chart with: An auto Pending Order (Buy/Sell). Taking Profit 1, Taking Profit 2 is pivot point and Taking Profit 3 for extended reward opportunity. The best risk and reward ratio. Simple and powerful indica
Next Trend Pro INDICATOR - the best trend indicator on the market, the indicator works on all timeframes and assets, the indicator is built on the basis of 12 years of experience in forex and many other markets. You know that many trend indicators on the internet are not perfect, late and difficult to trade with, but the Next Trend Pro indicator is different, the Next Trend Pro indicator shows a buy or sell signal, colored candles confirm the signal, and support levels and resistance levels give
RSI heatmap
Mr Pimook Chokdamrongsuk
Welcome to the world of trading and technical analysis. In today's fast-paced markets, understanding market sentiment and identifying potential entry and exit points is crucial for successful trading. One essential tool in a trader's arsenal is the Relative Strength Index, or RSI. And now, we introduce the Free RSI Heat Map, a powerful visualization tool that brings RSI data to life. RSI Heat Map offers a comprehensive overview of the RSI values across multiple instruments, allowing trade
FREE
***** The REAL , ORIGINAL, Non-Repainting, Non-Delaying, Arrow Trade Entry indicator for Very Low-Risk market execution ***** Check MYFXBOOK HERE!!! Check out my   LIVE   channel to see the EA based on this Indicator in profitable action! Check My Profile . ***This is the Golden standard in arrow indicators for MT4.*** BING Setup Arrows Indicator(BSA) will show easy-to-read High Probability trading situations with Non-Repainting , Non-Delaying , Up or Down arrows on the graph.  So simple, it'
DMAX pro
Danny Teoh Kok Keong
DMAX SIGNAL IS VERY POWERFUL TOOL TO HELP YOU ENTRY,ITS CAN DETECT OVERSOLD AND OVERBOUGHT IN FOREX MARKET. ITS CAN TRADE 24 FOREX PAIR IN MARKET, 80% ACCURATE RESULT. MANY TRADER FAIL BECAUSE OF ENTRY POINT AND EXIT POINT , SIGNAL OF DMAX WILL GIVE VERY GOOD SIGNAL TO LET YOU KNOW WHERE TO ENTRY AND EXIT.  RISK MANAGEMENT IS VERY IMPORTANT IN TRADING FOREX, PLEASE DONT RISK OVER 5% PER TRADE IS FORE MARKET
Gendel Gendut is Binary Option Indicator From @realTatino Trade with expaired time Pairs : All Forex Pair Time Frame : M5 only Trade Time All Time Alert : Alert Message, Alert Email, Alerts Push Buffer : 4 Buffer (0,2 (Buy) || 1,3 (Sell) Broker Suitable : All Broker Binary With Forex Pair Auto Trade : Yes Repaint : NO Delay : NO Other Binary Indicator : https://www.mql5.com/en/market/product/70915 https://www.mql5.com/en/market/product/71054 https://www.mql5.com/en/market/product/57755 etc I
[ZhiBiCCI]インディケータは全てのサイクル使用に適しており、そして全ての市場品種にも適しています。 [ZhiBiCCI]緑色の実線は強気の発散の逆転です。緑色の点線は古典的な強気の発散です。 [ZhiBiCCI]赤への実線は逆弱気の発散である。赤い点線は古典的な弱気の発散です。 [ZhiBiCCI]はパラメータ(アラート、メール送信、通知送信)で設定でき、(true)に設定するとインスタント信号をアラームウィンドウに送信し、Eメール、インスタントメッセージを送信できます。 パラメータ設定の説明 [displayAlert]:これはアラームスイッチで、trueに設定され、矢印が表示されればプロンプトに自動的に警告され、falseに設定されれば警告されません。 [sendmail_NO_OFF]:これはメールを送信するためのスイッチで、trueに設定します。矢印が表示されていればMT4で設定したメールボックスにメールを送信し、falseに設定されていればメールを送信しません。 [sendnotification_NO_OFF]:これはインスタントメッセー
This is a trend indicator without redrawing Developed instead of the binary options strategy (by the color of the Martingale candlestick) Also works well in forex trading When to open trades (binary options) A signal will appear in the place with a candle signaling the current candle It is recommended to open a deal for one candle of the current timeframe M1 and M5 When a blue dot appears, open a deal up When a red dot appears, open a trade down. How to open trades on Forex. When a signal is rec
The main idea of this indicator is rates analysis and prediction by Fourier transform. The indicator decomposes exchange rates into main harmonics and calculates their product in future. The indicator shows 2 price marks in history, depicting price range in the past, and 2 price marks in future with price movement forecast. Buy or sell decision and take profit size are displayed in a text label in the indicator window. The indicator uses another indicator as an engine for calculations - FreqoMet
Simple to read and powerful, no fancy lines and drawings to clutter your chart or distract you. The trend probability oscillator estimates how likely a trend will continue in a certain period. The cummulator period controls how many bars in the past to use and is a proxy for the timescale the trend probability should hold. The use of a Max Line improves this further by indicating when a trend is likely to reverse. In most cases a trend must lose momentum before reversing. Hence, a trend probabil
Skalpex is a system indicator for wave diagnostic analysis of the early phases of a market condition. The indicator lags exactly 1 bar. It shows the exact price reversals, does not redraw its values, but is 1 bar late. This is due to the fact that the last (zero bar) has not yet been formed before closing, which means that no one ever knows where it will go exactly and where it will close. We can assume. In order not to try to play fortune-telling, the Skalpex indicator is late by one candle an
The main idea of this indicator is rates analysis and prediction by Fourier transform. Indicator decomposes exchange rates into main harmonics and calculates their product in future. You may use the indicator as a standalone product, but for better prediction accuracy there is another related indicator - FreqoMaster - which uses FreqoMeterForecast as a backend engine and combines several instances of FreqoMeterForecast for different frequency bands. Parameters: iPeriod - number of bars in the ma
The indicator displays renko bars on a chart, uses them to plot the fast and slow moving average and Stochastic, as well as it provides buy/sell signals: a buy signal is generated when the fast moving is above the slow one, and the signal line of Stochastic crosses the lower level from bottom up; a sell signal is generated when the fast moving is below the slow one, and the signal line of Stochastic crosses the upper level from top to bottom; Renko is a non-trivial price display method. Instead
このプロダクトを購入した人は以下も購入しています
Indicator : RealValueIndicator Description : RealValueIndicator is a powerful tool designed specifically for trading on the EURUSD pair. This indicator analyzes all EUR and USD pairs, calculates their real currency strength values, and displays them as a single realistic value to give you a head start on price. This indicator will tell you moves before they happen if you use it right. RealValueIndicator allows you to get a quick and accurate overview of the EURUSD currency pair tops and bottoms,
JULY OFFER 80% OFF next price for unlimited version will be 17000$. This is the only time you can get this institutional and professional indicator at this price for unlimited version. Don't dare to miss this. The tool I am about to introduce to you you can't compare it with other tools due to its strategy and accuracy level in predicting the next price directional movement . This tool is designed for serious traders who have decided to make a difference through trading. Be the next person to wi
TrendMaestro
Stefano Frisetti
5 (3)
note: this indicator is for METATRADER4, if you want the version for METATRADER5 this is the link:  https://www.mql5.com/it/market/product/108106 TRENDMAESTRO ver 2.4 TRENDMAESTRO recognizes a new TREND in the bud, he never makes mistakes. The certainty of identifying a new TREND is priceless. DESCRIPTION TRENDMAESTRO identifies a new TREND in the bud, this indicator examines the volatility, volumes and momentum to identify the moment in which there is an explosion of one or more of these data a
ZeusArrow Smart Liquidity Finder  Smart Liquidity Finder is Ai controlled indicator based on the Idea of Your SL is My Entry. It scan and draws the major Liquidity areas on chart partitioning them with Premium and Discount Zone and allows you find the best possible trading setups and help you decide the perfect entry price to avoid getting your Stop Loss hunted . Now no more confusion about when to enter and where to enter. Benefit from this one of it's kind trading tool powered by Ai an trade
A. A2SR とは何ですか ?   * 先行テクニカル指標です (塗り直しなし、ラグなし)。 -- ガイダンス : -- https://www.mql5.com/en/blogs/post/734748/page4#comment_16532516 -- そして https://www.mql5.com/en/users/yohana/blog A2SR には、サポート (需要) とレジスタンス (供給) のレベルを決定する特別な手法があります。 ネットで見かける通常の方法とは異なり、A2SR は実際の SR レベルを決定する独自のコンセプトを持っています。 元の手法はインターネットから取得されたものではなく、インターネット上で公開されたこともありません。 A2SR は、取引スタイルに応じて SR レベルを自動選択します。 時間枠を変更しても、SR レベルはその位置にとどまります。 実際のSRは、使用する時間枠から取得されるわけではないため. A2SR には、取引のための完全な手段があります 。 実際のサポート (需要) とレジスタンス (供給) の真のコンセプト。
This indicator uses support and resistance, volume and some special formula to calculate the volume to filter the candles. If the volume reaches a specific value, And at the same time, Candle breaks the support/resistance line, There would be a signal and we can enter the market. Signals appear when the current candle closes. then you can enter the trade when a new candle appears. Please don't forget to follow your money management plan. MT5 Version Support/Resistance Breakout MT5 :   https:
️️ Attention:      The price will soon be raised to what it was before ($500).      No more losses with this indicator, test it for years ago and see if there is losses in one day results. but before testing it please see the explaining video down here.    FxBears Powers is working on all forex pairs, metals, commodities, futures, indices, energies, crypto, and everything...and on all timeframes from M1 to MN.   It's based on supply and demand zones, price action, and some internal indicators,
Gold Channel is a volatility-based indicator, developed with a specific timing algorithm for the XAUUSD pair, which consists of finding possible corrections in the market. This indicator shows two outer lines, an inner line (retracement line) and an arrow sign, where the theory of the channel is to help identify overbought and oversold conditions in the market. The market price will generally fall between the boundaries of the channel. If prices touch or move outside the channel it is a tra
Enigmera
Ivan Stefanov
5 (4)
エニグメラ:市場の中核 https://www.enigmera.com はじめに このインディケータと取引システムは、金融市場に対する驚くべきアプローチです。ENIGMERAは、フラクタルサイクルを使用して、サポートとレジスタンスレベルを正確に計算します。本格的な蓄積局面を示し、方向性と目標を示します。 トレンド中でも調整中でも機能するシステムです。 どのように作動するのか? ENIGMERAは、支持線・抵抗線、目標線、乖離線の3つのラインで構成されています。このシステムは、過去のデータを現在と未来に外挿する典型的な市場指標とは異なり、現在の完全な画像を提供します。支持線上にある場合、それは本当の支持を意味し、抵抗線上にある場合、それは本当の抵抗を意味する。ある水準が破られた場合、それはトレンドの変化を意味する。再描画はしない。 市場は常に進化しているため、ENIGMERAはその評価ツールを適応させ、定期的に戦略を修正しています。  これにより、すべてのシナリオが徹底的に評価されることが保証されます。この市場指標の独自性は、その能力を見れば明らかです。  ENIGM
もちろんです。以下は、提供いただいたテキストの日本語への翻訳です: MT4用の天文学指標をご紹介します:究極の天体トレーディングコンパニオン トレーディング体験を天空の高みに高める準備はできていますか?私たちの革命的なMT4用の天文学指標をご紹介します。この革新的なツールは、複雑なアルゴリズムの力を借りて、類まれなる天文学的洞察と精密な計算を提供します。 あなたの指先で宇宙の情報を: 宝のような天文学的データが明らかになる包括的なパネルをご覧ください。惑星の地理的/太陽中心座標、太陽と地球の距離、星の大きさ、伸び、星座、黄道座標および赤道座標、さらには水平座標まで、それぞれが綿密に計算され美しく表示されています。指標によって生成される垂直線は時間値に対応し、トレーディングの旅に宇宙の視点を提供します。 惑星のラインと関係: グラフを飾る惑星のラインの魔法を体験し、スケールと角度をカスタマイズできます。直感的なコントロールパネルを介して各惑星のラインの表示を簡単に切り替えることができます。指定された時刻範囲内での合会、六分会、四分会、三分会、対会、逆行の指標で天体の関係の芸術を発見してく
Please send me Direct message on MQL5 CHAT after purchasing the Indicator for Training and Installation Support There are some additional files that is important to use with the Indicator . So be sure to contact me after purchasing the Indicator So that I can add you for training and support . If you find any difficulty with installation then send me Direct message here So that I can connect with you via Anydesk or Teamview for the product installation. " Smart Order Block Indicator " to find
ECM Elite Channel is a volatility-based indicator, developed with a specific time algorithm, which consists of finding possible corrections in the market. This indicator shows two outer lines, an inner line (retracement line) and an arrow sign, where the channel theory is to help identify overbought and oversold conditions in the market. The market price will generally fall between the boundaries of the channel. If prices touch or move outside the channel, it's a trading opportunity. The
Gann Signal is a very simple indicator at first glance, but hidden inside is many years of experience in studying W.D.Ganna methods. The indicator gives accurate BUY/SELL signals, without redrawing. The indicator is very easy to use. All you need to do is attach it to your chart and follow its recommendations. The indicator constantly analyzes the market for entry opportunities. When such an opportunity appears, the indicator gives a signal in the form of an arrow. I repeat, all signals are NOT
驚異的なFXインジケーター「Miraculous」をご紹介します。完璧な結果を得るための1時間足を含むすべてのタイムフレームで効果的に機能する、最強の強力な特殊MT4フォレックスインジケーターです。 すべてのタイムフレームで優れた結果を提供する最高のFXインジケーターを探し続けるのに疲れましたか?これ以上探す必要はありません!「Miraculous」フォレックスインジケーターをご紹介します。このインジケーターは、トレーディングの経験を変革し、収益を新たなレベルに引き上げるために設計されました。 先進のテクノロジーと長年にわたる緻密な開発に基づいて構築された「Miraculous」フォレックスインジケーターは、FX市場における力と正確さの頂点となります。この素晴らしいツールは、すべてのレベルのトレーダーのニーズを満たすように設計されており、一貫した収益性を追求する上で比類のない優位性を提供します。 「Miraculous」フォレックスインジケーターの他との違いは、その非常に適応性にあります。デイトレーダー、スウィングトレーダーであろうと、長期ポジションを好む方であろうと、このインジケータ
3 Indicators in 1 indicator Strategy based on price action Made specifically for the best forex currency pairs Can be used in the best time frame of the market at a very reasonable price This indicator is basically 3 different indicatos . But we have combined these 3 indicators in 1 indicator so that you can use 3 indicators at the lowest price. All three strategies are based on price action. But based on different trends. Long term, medium term and short term Attributes : No repaintin
Introduction to X3 Chart Pattern Scanner X3 Cherart Pattern Scanner is the non-repainting and non-lagging indicator detecting X3 chart patterns including Harmonic pattern, Elliott Wave pattern, X3 patterns, and Japanese Candlestick patterns. Historical patterns match with signal patterns. Hence, you can readily develop the solid trading strategy in your chart. More importantly, this superb pattern scanner can detect the optimal pattern of its kind. In addition, you can switch on and off individu
Max Payneは、矢印の形でシグナルを与える反転/トレンドシグナルインジケーターです。このインジケーターは、同じバーの終値でシグナルを出します。このインジケーターは、異なる期間でチャート上に複数回ドロップして、シグナルの2倍/3倍の確認を取得できます。 このインジケーターは、あらゆる取引スタイルに合わせて高度に調整できますが、再描画やバックペイントは一切行われません。購入後には、使用したテンプレートとともにスクリーンショットに表示される完全なシステムが表示されます。 ----------------- 取引方法: トレンドフィルター(購入後に得られるペイントレンド)が方向に一致している間、同じバーでトリプル確認が得られるまで待ちます 取引を開始し、買い取引の場合は金色の矢印 (テンプレート) より下、売り取引の場合は金色の矢印 (テンプレート) より上にストップロスを設定します。終了シグナルは最初の反対側の白い点のシグナル (テンプレート) です。 ----------------- パラメーター : 信号周期:矢印周期 フィルター: 信号フィルター 距離 : ローソクからの矢印
MT5 Version SMT Divergences MT4 SMT Divergences is one of the most innovative indicators in the market. It offers the possibility of analyzing price divergences between 2 pairs. These divergences highlight and help to foresee what banks and institutions are planning to do. SMT divergences also provides you with a kill zones indicator and the possibility of filtering divergences occurring during these kill zones.  The strategy tester is limited in MT4. Contact the author to get your Demo Version
How to use Pair Trading Station Pair Trading Station is recommended for H1 time frame and you can use it for any currency pairs. To generate buy and sell signal, follow few steps below to apply Pair Trading Station to your MetaTrader terminal. When you load Pair Trading Station on your chart, Pair Trading station will assess available historical data in your MetaTrader platforms for each currency pair. On your chart, the amount of historical data available will be displayed for each currency pai
スイングトレーディング は、トレンドの方向のスイングと可能な反転スイングを検出するように設計された最初のインジケーターです。トレーディングの文献で広く説明されているベースラインスイングトレーディングアプローチを使用します。インディケータは、いくつかの価格と時間のベクトルを調査して、全体的なトレンドの方向を追跡し、市場が売られ過ぎまたは買われ過ぎて修正の準備ができている状況を検出します。 [ インストールガイド | 更新ガイド | トラブルシューティング | よくある質問 | すべての製品 ] むち打ちを起こさずに市場スイングの利益 インジケーターは常にトレンドの方向を表示します 色付きの価格帯は機会のベースラインを表します 色付きのダッシュは、可能な反転スイングを表します この指標は、独自の品質とパフォーマンスを分析します 複数時間枠のダッシュボードを実装します カスタマイズ可能なトレンドおよびスイング期間 電子メール/サウンド/プッシュアラートを実装します インジケータは再描画またはバックペインティングではありません Swing Tradingとは Swing Tradi
フルSTOインジケータ(3つのSTOインジケータのすべてのバージョンを含む:プレミアム、ゴールド、シルバー) - STABLE TRADE OPTIONは、自動バイナリーオプション取引のために設計されています。 注意深くお読みください! 重要 1つのターミナルで、異なる有効期限を持つ2つのテンプレートを作成します。18:01、18:02のテンプレートは有効期限が1~15分、22:00のテンプレートは有効期限が10~20分です。 勝率:過去5年間で71 資金管理: 預金から0.3 このバージョンのインジケータは、モスクワ時間18:01、18:02、22:00の取引にのみ設定され、有効期限は銀と金が1~15分、プレミアムバージョンは10~20分です。シグナルはローソク足の内側に表示され、すぐに取引を開始します。 インジケータは完全に設定されているので、自分で何かを変更する必要はありません。インストールして取引してください! 実際の口座でstoの全バージョンをチェックし、結果を確認するのに2年以上かかりました。長年のテストの結果、最適なパラメータが選択さ
回帰取引を意味する専門的かつ定量的なアプローチを実装する独自の指標。これは、価格が予測可能かつ測定可能な方法で迂回して平均に戻るという事実を利用しており、非定量的な取引戦略を大幅に上回る明確な出入りルールを可能にします。 [ Installation Guide | Update Guide | Troubleshooting | FAQ | All Products ] 明確な取引シグナル 驚くほど簡単に取引できます カスタマイズ可能な色とサイズ パフォーマンス統計を実装します ほとんどの取引戦略を上回ります 適切なSLおよびTPレベルを表示します 電子メール/音声/視覚アラートを実装します 使い方 インディケータは、より高い時間枠からの完全にカスタマイズ可能な移動平均の周りの標準偏差を測定し、トレンドフォローアプローチを使用して正確に取引を見つけます。取引は、現在のチャートの価格アクションに飛び込むことによって見つけられ、価格が選択したより高い時間枠から計算された平均価格帯に戻ったときに閉じられます。それがコード化される方法のために、指標は高ボラティリティと強いトレンドの
This indicator is based on the mathematics of the great trader W.D. Ganna. With its help, you can easily find strong levels by analyzing swings to find the optimal entry point. The indicator works on all instruments and all timeframes. The indicator is fully manual and has control buttons. All you need to do is press the NEW button, a segment will appear, which you can place on any movement, swing or even 1 candle that you want to analyze. By placing the segment, press the OK button. A grid (th
Currently Price 20% OFF ( for unlimited use )   BONUS  AUX VIP Club 2024 : Include  EA Airbag  and  Load Data History  to enhance the performance of this tool to its maximum potential  Click Here to Download Files   ( for users only )   Hello World! Introducing.. SMCpro VIP tool and Indicator for MetaTrader 4, designed to revolutionize your trading experience with the ICT Smart Money Concept. This system is meticulously crafted to empower traders with advanced insights and precision in
The indicator of a Professional Trader is an arrow indicator for predicting the direction of price movement. I have been working on this indicator since 2014. You can use this indicator as your main indicator, use its entry signals, and use it as your only indicator to find entry points. About the product: Recommended TF [H4-D1-W1]   . The indicator predicts the direction of the next candle. Fits a variety of tools; Flexibility in settings for different instruments and intervals through the
トレンドトレーディング は、タイミングのプルバックとブレイクアウトにより、市場で起こっているトレンドから可能な限り利益を得るように設計された指標です。確立されたトレンドの中で価格が何をしているかを分析することにより、取引の機会を見つけます。 [ インストールガイド | 更新ガイド | トラブルシューティング | よくある質問 | すべての製品 ] 自信を持って効率的に金融市場を取引する むち打ちにならずに確立されたトレンドから利益を得る 収益性の高いプルバック、ブレイクアウト、早期の逆転を認識する この指標は、独自の品質とパフォーマンスを分析します 複数時間枠のダッシュボードを実装します インジケーターは再描画されていません 電子メール/音声/視覚アラートを実装します 確立されたトレンドは多くの取引機会を提供しますが、ほとんどのトレンド指標はそれらを完全に無視しています。インジケーターの解釈はかなり簡単です: (1) トレンドの変化 (2) トレンドの方向への後退 (3) トレンドの方向へのブレイクアウト 赤いダッシュ は下降トレンド中の修正です 青いダッシュ は上昇ト
Liquidity Pro The Liquidity Pro pin points liquidity zones in any financial instrument, including currency pairs, cryptocurrencies, commodities, equities and indices. The Liquidity Pro shows previous and current liquidity zones, down to the present minute, providing essential information about your chosen trading pair, when conducting chart analysis or initiating trades. Remember each trading pair requires a different price separation value for M5, M15 and M30 Tally, to provide accurate data. Y
The indicator " ZigZag on Trend " is an assistant in determining the direction of price movement, as well as a calculator of bars and points. It consists of a trend indicator, which follows the price direction by the trend line presented in the form of a zigzag and a counter calculating the number of bars traversed in the direction of the trend and the number of points on the vertical scale. (calculations are carried out by the opening of the bar) The indicator does not redraw. For convenience,
TRANSACTION SPEEDは、大口注文がいつどこで市場に集積され、その恩恵を受けているかを示す最高品質の指標です。トレンドの変化を非常に早い段階で検知します。インジケーターであると同時にトレーディングシステムでもあります。そのコンセプトはユニークで、驚くほど収益性が高い。 FXでは、ティックボリュームはボリュームと呼ばれ、誤解を招きやすい。実際は、単位時間当たりの価格変動であり、事実上、取引速度(TRANSACTION SPEED)です。 このインジケーターは、FXにおける出来高の概念を完全に見直し、正しい方法で論理的に定義し、このロジックを適用することで、ユニークで正確なトップレベルの収益ツールになります。 スピードが上がれば、それはより大きな関心とそれに対応するエントリーとエグジットのサインです。 使い方は? このインジケーターは、市場の取引スピードを測定・比較するため、まず最初に行うべきことは以下の通りです。 比較を行う期間を選択することです。 通常、15日前が比較の出発点となります。 インジケータに日付を入力して実行する。 30分または1時間のタイムフレー
これはほぼ間違いなく、MetaTraderプラットフォームで見つけることができる最も完全な調和価格形成自動認識インジケーターです。 19種類のパターンを検出し、フィボナッチプロジェクションをあなたと同じように真剣に受け止め、潜在的逆転ゾーン(PRZ)を表示し、適切なストップロスとテイクプロフィットレベルを見つけます。 [ インストールガイド | 更新ガイド | トラブルシューティング | よくある質問 | すべての製品 ] 19の異なる調和価格形成を検出します プライマリ、派生および補完フィボナッチ投影(PRZ)をプロットします 過去の価格行動を評価し、過去のすべてのパターンを表示します この指標は、独自の品質とパフォーマンスを分析します 適切なストップロスとテイクプロフィットのレベルを表示します ブレイクアウトを使用して適切な取引を通知します すべてのパターン比をグラフにプロットします 電子メール/音声/視覚アラートを実装します スコット・M・カーニーの本に着想を得て、この指標は最も純粋で急を要するトレーダーのニーズを満たすように設計されています。ただし、トレードを
作者のその他のプロダクト
**Introducing Supply Demand Zones Indicator for MT4** Hello, esteemed traders in the financial markets! Today, we are pleased to introduce to you a powerful tool called the "Supply Demand Zones Indicator" - a valuable utility designed for the MetaTrader 4 (MT4) platform, aimed at helping you identify key supply and demand areas on your trading charts. **Brief Introduction:** The Supply Demand Zones Indicator is a unique technical analysis tool that assists in pinpointing significant price l
FREE
ZigZag Fibo Retracement Indicator Optimize Your Trading Strategy! Are you seeking to optimize your trading strategy in the financial markets? Explore the unique features of the ZigZag Fibo Retracement Indicator, a powerful tool designed to help you identify potential support and resistance levels based on the combination of ZigZag patterns and Fibonacci ratios. Integration of ZigZag Patterns and Fibonacci: The ZigZag Fibo Retracement Indicator combines the effectiveness of ZigZag patterns, helpi
FREE
Dear everyone, Today, I would like to introduce you to an amazing tool on the MetaTrader 4 platform - "Pivotal Moments." This indicator will be a reliable companion on your trading journey in the financial market. "Pivotal Moments" is not just an ordinary indicator, but an intelligent tool that helps you better understand significant fluctuations on the chart. With a variety of customization options, it provides valuable information and deep insights into the market. The key features of "Pivotal
FREE
Bollinger Bands Stops Indicator for MT4 The Bollinger Bands Stops Indicator is a versatile tool designed to help traders make informed decisions in the financial markets. Developed for the MetaTrader 4 (MT4) platform, this indicator provides valuable insights by visually representing the Bollinger Bands along with stops and signals. Key Features: Bollinger Bands Analysis: The indicator incorporates Bollinger Bands, a widely used technical analysis tool. These bands help traders identify potentia
FREE
Sure, here's the introduction for the "Enhanced Volume" indicator designed for MetaTrader 4 (MT4): --- ## "Enhanced Volume" Indicator for MetaTrader 4 (MT4) Greetings MT4 Traders! The "Enhanced Volume" indicator is a powerful tool designed to help you track and analyze trading volume alongside signals of changing market trends.  ### Key Features: 1. **Separate Window Display:** The "Enhanced Volume" indicator can be displayed on a separate window, making it easy to observe and analyze
FREE
「究極のノンリペイントスマート」インジケーター - リペイントしないスマートなトレードシステム。 製品概要: 「究極のノンリペイントスマート」インジケーターは、MT4プラットフォームのトレーダー向けに設計されたパワフルなツールであり、市場分析と取引の意思決定を最適化するのに役立ちます。複数の指標とスマートシステムの組み合わせにより、このインジケーターは潜在的な買いポイントと売りポイントを特定するだけでなく、信頼性のある取引シグナルを提供します。 主な特徴: ノンリペイントシステム:このインジケーターの重要な利点の1つは、リペイントしない機能です。これにより、取引シグナルがチャート上に表示された後も変更されないことが保証されます。これにより、信号に対して信頼性を持ち、正確な取引の意思決定が可能となります。 多様なテクニカル指標:「究極のノンリペイントスマート」インジケーターは、移動平均線、RSI、ボリンジャーバンド、ブルパワー、ベアパワーなど、複数の主要なテクニカル指標を組み合わせています。これらの指標のスマートな統合により、市場の包括的な視点を提供し、成功する取引
**"Support and Resistance Breakout" Indicator for MetaTrader 4 (MT4)** Hello traders and investors on the MetaTrader 4 (MT4) platform, We are excited to introduce to you the "Support and Resistance Breakout" indicator - a powerful tool designed for MT4 that helps you capitalize on trading opportunities involving support and resistance breakouts effectively and confidently. **Overview:** The "Support and Resistance Breakout" indicator is a custom tool built on the MetaTrader 4 platform,
Welcome to the "Keltner Amplified Breakout" Indicator Are you searching for a powerful and effective trading tool on the MT4 platform? Let us introduce you to the "Keltner Amplified Breakout" Indicator. Designed to help you capture potential trading opportunities, this indicator offers the perfect blend of high performance and user-friendliness. Key Advantages: Identify Strong Trends: This indicator utilizes Keltner channels and fractal signals to identify robust upward or downward trends in
こんにちは、 MetaTrader 4(MT4)プラットフォームで金融市場から利益を上げるための最適な解決策をお探しですか?「Sonic R Non Repaint Smart」をご紹介します。これはトレーダーに正確さと効率性をもたらすスマートな取引システムです。 「Sonic R Non Repaint Smart」の紹介: 「Sonic R Non Repaint Smart」は、高く評価されているSonic R取引戦略に基づいて構築された頑健な取引指標です。私たちは、市場のトレンドを正確に特定するだけでなく、取引プロセスを自動化するソリューションを自信をもって提供しています。 主な特徴: 再描画なし、高い精度:「Sonic R Non Repaint Smart」を使用すると、決して変化しない正確な取引シグナルを受け取ることができます。これにより、取引の判断に自信を持つことができます。 自動取引:システムは市場を自動的に分析し、Sonic R戦略に基づいて買いと売りのシグナルを提供します。これにより、取引の管理にかかる時間とエネルギーが節約されます。
EA MT4製品 - AI PowerTrend Intelligence 尊敬なるお客様へ、 弊社のEA(エキスパートアドバイザー)製品「AI PowerTrend Intelligence」をご紹介させていただきます。これはMT4取引プラットフォーム向けの強力なツールです。このEAは、金融市場での取引においてスマートな意思決定と高いパフォーマンスを提供することを目的として開発されました。 特徴的な機能: スマートな指標:本製品は、指数移動平均(EMA)、相対力指数(RSI)、ボリンジャーバンド、ブルズパワー、ベアーズパワーなどの多くのテクニカル指標を使用して、スマートな取引決定を行います。 自動取引:本製品を使用することで、ストップロス、テイクプロフィット、および取引資金の割合などの取引パラメータを設定し、EAが自動的に売買注文を実行できるようにすることができます。 リスク管理:EAは、固定ロットまたは口座残高に基づくリスク比率などのリスク管理オプションを提供します。 複数時間枠のインジケーター(MTF):この機能を有効にすると、EAは複数の異なる時間
AI Sonic R Trader - MT4向けのスマートな自動取引プロダクト 尊敬する貴重なお客様へ、 私たちはAI Sonic R Traderを紹介することを非常に誇りに思っています。これは、KPROチームによって開発されたMT4プラットフォーム用のスマートで効率的なエキスパートアドバイザー(EA)です。この製品は、金融市場で最高品質の自動取引機能を提供するために作成されました。 Sonic R Trader戦略と人工知能の進歩の組み合わせが、この製品の成功の基盤を築いています。 AI Sonic R Traderの主な特徴: スマートな自動取引:EAは、指数移動平均(EMA)などの技術指標を組み合わせたスマートなアルゴリズムを使用し、Sonic R戦略に基づいてEMA34およびEMA89などを使用して、チャート上の最適なエントリーポイントと出口ポイントを特定します。 柔軟なリスク管理とATRの活用:ATR(平均真値幅)インジケーターに基づいて、取引のリスク管理をカスタマイズする機能を提供しています。製品は、ATR値に基づいて利益確定とストップロスのレベル
**Introduction to TradeMatic EA for MT4 - Adjust Trading Strategy and Risk Management** TradeMatic EA is a versatile indicator created with version 1.1 by KPRO for MetaTrader 4 (MT4). Designed to assist traders in automating their trading processes, this indicator provides multiple settings and options to fine-tune your trading strategy along with strict risk management. **Key Features:** 1. **Diverse Risk Management:** TradeMatic EA offers various risk management options, allowing you to
こんにちは、金融市場とMT4プラットフォームで取引に情熱を注ぐ仲間のトレーダーの皆様、 私たちは自信を持って、独自で強力なEA(エキスパートアドバイザー)であるAI Breakout Boxを紹介します。これは特にブレイクアウト戦略内で取引結果を最適化するための頼りになる自動取引ツールを求めている方々にとって、MetaTrader 4プラットフォーム上での完璧なソリューションです。 AI Breakout Boxについて AI Breakout Boxは、ブレイクアウト市場の条件内での取引機会を検出して活用するために特別に設計されたエキスパートアドバイザーです。要するに、ブレイクアウトとは価格が範囲内の価格レベルから抜け出そうとするときのことを指します。これはトレンドの変化の兆候や大きな市場動向の可能性を示す重要な瞬間です。 ブレイクアウト戦略の特徴と利点 自動ブレイクアウト検出:AI Breakout Boxは、RSI、EMA、ATRなどの技術指標に基づいてブレイクアウト信号を自動的に識別します。これにより、チャート上の重要なブレイクアウト機会を見逃すことがありません。 最適化された
**MT4用ブレイクアウトボックスインジケーター - 効率的なトレーディングチャンスを発見** こんにちは、尊敬するトレーダーの皆様、 私たちは、KPROによって作成された強力で正確なトレーディングツール、ブレイクアウトボックスインジケーターのバージョン2.0をご紹介させていただきます。これは、外国為替市場でトレーディングチャンスを捉え、利益を最適化し同時にリスクを最小限に抑えるための貴重な資産です。 **主な特徴:** 1. **効率的なブレイクアウトトレーディング:** ブレイクアウトボックスインジケーターは、チャート上の重要なブレイクアウトポイントを特定するために特別に設計されています。これにより、強力な価格変動を捉え、最良のトレーディングチャンスを活用することができます。 2. **リペイントのないシグナル:** このインジケーターの特筆すべき特徴の1つは、リペイントのないシグナルの機能です。これにより、インジケーターが提供する買いと売りのシグナルに信頼を置くことができ、トレーディングの決定に信頼性のある基盤が築かれます。 3. **マルチタイムフレー
**お好みのテクニカルインジケーターを活用した自動売買の力を解放 - MT4向け IndicatorTrader Pro のご紹介** こんにちは! あなたは、大事に設定したテクニカルインジケーターに基づいて取引シグナルを探し、チャートに夢中になっていることはありませんか?ストレスを減らし、取引決定にかける時間を節約する方法をお探しではないですか?もう探す必要はありません。IndicatorTrader Pro こそ、すべてのトレーダーに最適な取引のパートナーです。 ### 既存のテクニカルインジケーターを活用した自動化 なぜテクニカルインジケーターがシグナルを生成するたびに注文の実行に苦労する必要があるのでしょうか?IndicatorTrader Pro はこのジレンマを解決する究極の解決策です。選択したテクニカルインジケーターに基づいて自動的に買い注文と売り注文を検出し、実行するために設計されています。 ### テクニカルインジケーターの力を引き出す IndicatorTrader Pro を使用することで、RSI、MA、ADXなどのテクニカルインジケータ
**新登場: オーダーブロックプロ - あなたのMT4取引の秘密兵器!** 金融市場であなたのポテンシャルを最大限に引き出す新しいトレードツールをお探しですか?それなら、我々が誇りを持ってご紹介するのは「オーダーブロックプロ」です。このパワフルなツールは、幅広い機能を提供するだけでなく、従来の指標の制約を克服します。 **オーダーブロックプロの主な特徴** **1. 正確なエントリーシグナル:** チャートと対話する際、オーダーブロックプロは単にエントリーアローを表示するだけでなく、これらのアローが「リペイント」されないように保証します。これにより、不確実性を排除したユニークなエントリーシグナルを提供します。 **2. タイムリーなアラート:** オーダーブロックプロは重要な注文ブロックエリアを特定するだけでなく、価格がこれらのエリアに近づいたときにアラートを出すことも可能です。これにより、素早く正確なトレードチャンスを捉えることができます。 **3. フレキシブルでカスタマイズ可能:** オーダーブロックプロは、好みに合わせてカスタマイズ可能です。注文ブロックエ
**TrendLine ProX - The Ultimate Non-Repaint Indicator for MT4 Trading** **Product Introduction:** We are delighted to introduce TrendLine ProX - an optimized and reliable trading tool for the MT4 platform. With its accurate trend detection and non-repainting feature, TrendLine ProX will be your trustworthy companion to support intelligent trading decisions. **The Power of TrendLine ProX:** TrendLine ProX is more than just a trading tool; it is a harmonious blend of technology and market ana
Introducing Market Structure AIO: The Smart Money Concepts Mastermind Tired of chasing false signals and battling market confusion?   Introducing Market Structure AIO, the all-in-one indicator powered by Smart Money Concepts, designed to   unravel market structure, identify high-probability trade opportunities, and empower you to trade with confidence. What is Market Structure AIO? A comprehensive Smart Money Concepts toolkit:   Analyze market structure, identify imbalances, and anticipate price
フィルタ:
レビューなし
レビューに返信
バージョン 2.2 2023.08.21
fix bugs