RSITrendLine
- インディケータ
- Omar Hakim Abdulla Alhabsi
- バージョン: 1.0
- アクティベーション: 20
RSI Trend Lines Indicator - Identify Optimal Buying and Selling Opportunities
Introduction:
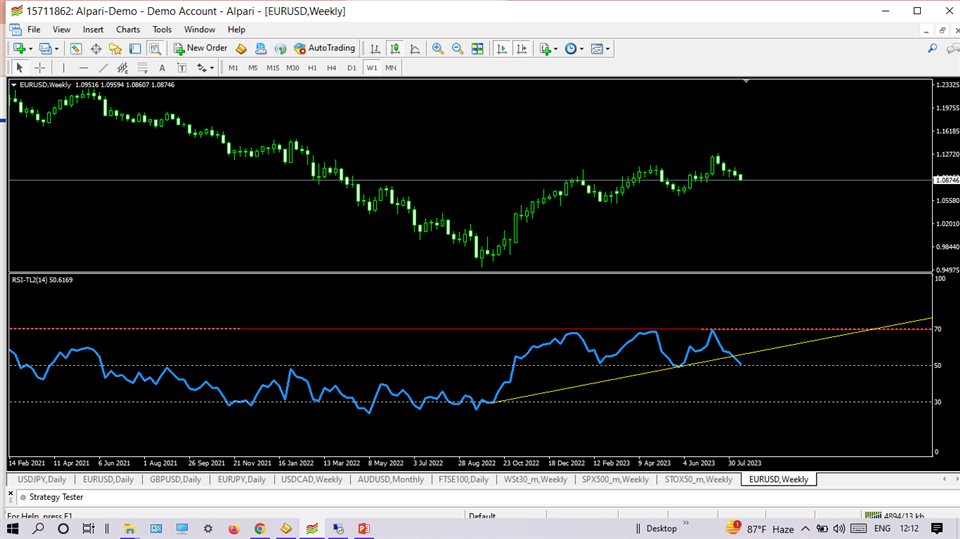
The RSI Trend Lines Indicator is a powerful tool designed to assist traders in identifying optimal buying and selling opportunities based on the Relative Strength Index (RSI) oscillator. This advanced indicator draws trend lines on the RSI chart using multiple points, providing valuable insights into potential market trends and reversals. By leveraging the RSI Trend Lines Indicator, traders can enhance their decision-making process and potentially improve their trading outcomes.
Key Features:
-
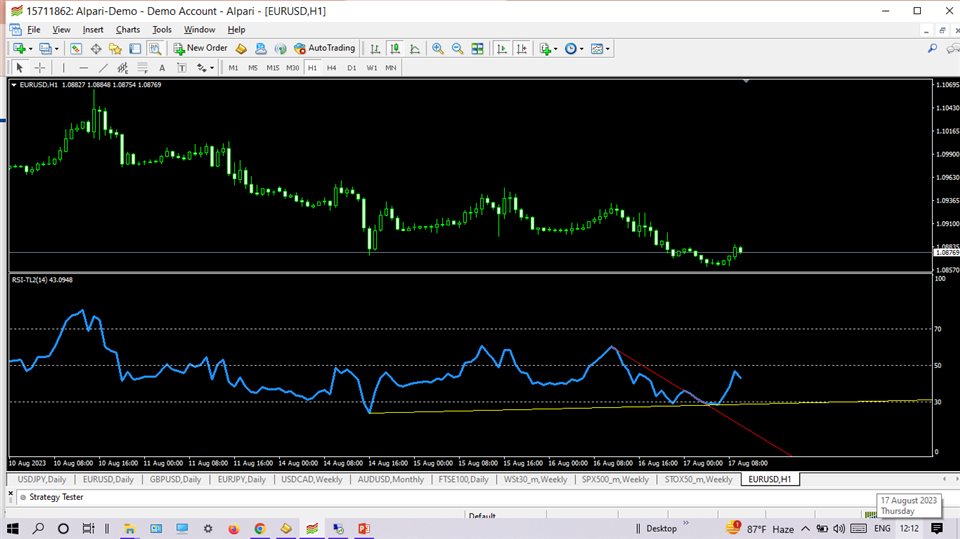
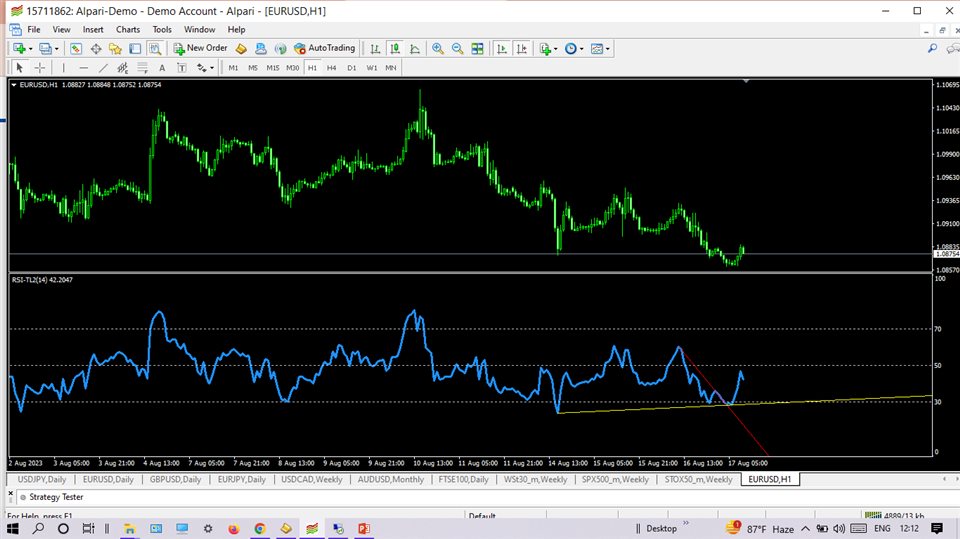
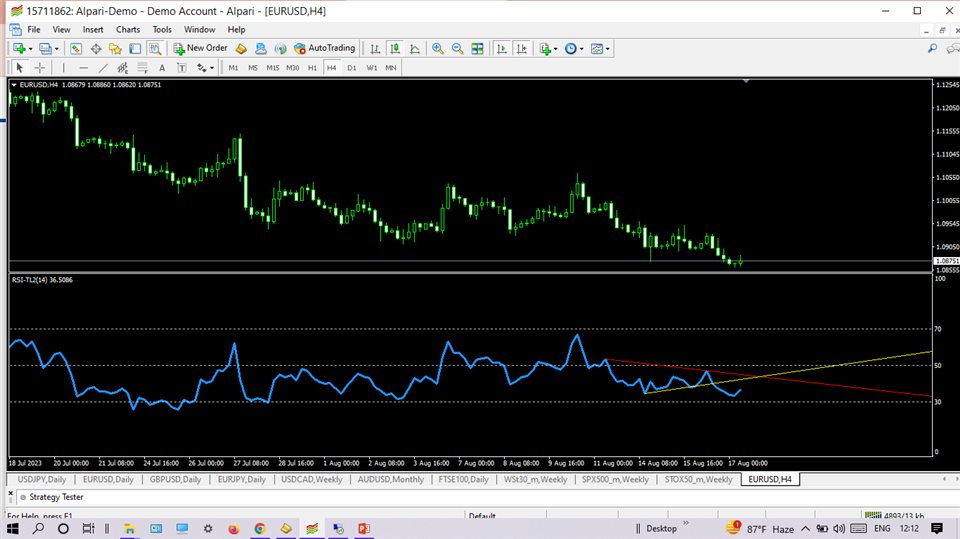
Trend Line Drawing: The RSI Trend Lines Indicator offers the ability to draw trend lines directly on the RSI oscillator chart, enabling traders to visualize the RSI's movements with greater clarity. These trend lines are automatically generated by the indicator based on user-defined parameters, making it easier to identify key support and resistance levels.
-
Multiple Point Drawing: Unlike traditional trend lines that are drawn using only two points, this indicator allows traders to draw trend lines using multiple points on the RSI chart. This feature provides a more accurate representation of trend strength and stability, enabling traders to make more informed trading decisions.
-
Buying and Selling Situations: By analyzing the drawn trend lines, the RSI Trend Lines Indicator identifies potential buying and selling situations. It highlights critical levels where the RSI is likely to reverse, signaling optimal entry or exit points for trades. Traders can take advantage of these situations to capture potential profits and minimize risks.
-
Customizable Parameters: The indicator offers a range of customizable parameters to adapt to individual trading preferences. Traders can adjust the sensitivity of the trend line detection, modify the number of points required to draw a trend line, and set alert notifications for specific conditions. This flexibility ensures that the indicator aligns with various trading strategies and styles.
-
User-Friendly Interface: The RSI Trend Lines Indicator features a user-friendly interface, making it accessible to both novice and experienced traders. The intuitive design allows for easy installation, customization, and interpretation of the trend lines. Additionally, comprehensive documentation and customer support are available to assist users with any queries or concerns.
How to Use:
-
Install the indicator on your preferred trading platform (MetaTrader 4).
-
Apply the RSI Trend Lines Indicator to the desired chart, selecting the appropriate settings.
-
Observe the drawn trend lines on the RSI chart, which represent potential support and resistance levels.
-
Analyze the buying and selling situations indicated by the trend lines to make informed trading decisions.
-
Consider additional technical and fundamental analysis in conjunction with the RSI Trend Lines Indicator for comprehensive market evaluation.
Conclusion:
The RSI Trend Lines Indicator is a robust technical analysis tool that empowers traders to identify optimal buying and selling opportunities based on the RSI oscillator's trend lines. By leveraging its advanced features and customizable parameters, traders can gain valuable insights into market trends and reversals, enhancing their trading strategies and potentially improving their overall profitability. Add the RSI Trend Lines Indicator to your trading toolbox today and unlock new possibilities in your trading journey.
Disclaimer: The RSI Trend Lines Indicator is offered for informational purposes only and does not guarantee profitable trading outcomes. Users should exercise caution and perform thorough analysis before making any trading decisions.
