• 概要
  • レビュー
  • コメント

White Light POC

White Light POC (WLP)

Experience precision in trading analysis with White Light POC (WLP), a meticulously designed powerful tool for traders seeking accurate Point of Control (POC) calculations. This advanced indicator has been crafted with a focus on efficiency and adaptability, ensuring seamless integration into Expert Advisors or other indicators through a convenient copybuffer interface.

Features:

  • Lightweight Efficiency: White Light POC (WLP) offers a streamlined solution that provides POC calculations with minimal resource consumption. Its lightweight design ensures swift processing without compromising accuracy.

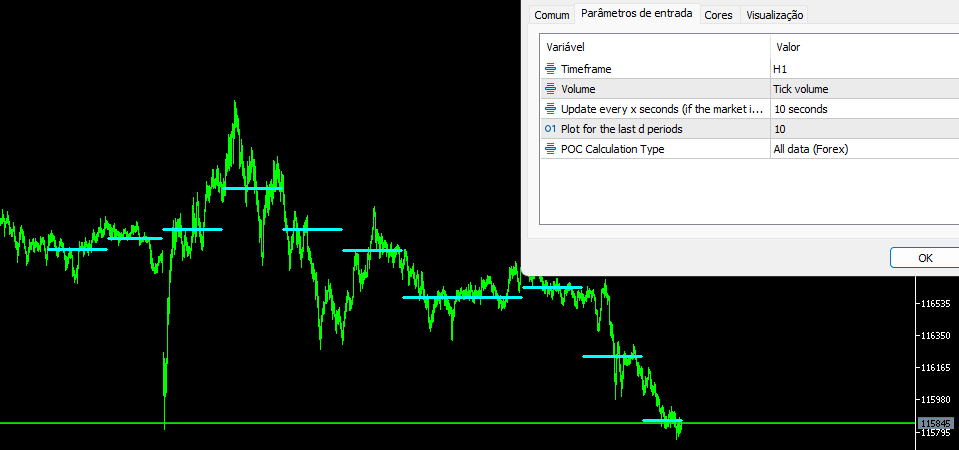
  • Customizable Parameters: Tailor your analysis to your trading style. WLP empowers you with a range of customizable parameters, including selecting different timeframes, volume type (real or ticks), update interval (data refresh frequency), the number of candles for plotting historical data, and the choice of POC calculation type (all data or trade-specific data).

  • Seamless Integration: Whether you're an algorithmic trader or a technical analysis enthusiast, WLP seamlessly integrates into your trading arsenal. It can be easily utilized within Expert Advisors or incorporated into other indicators through a copybuffer, enhancing your trading strategies.

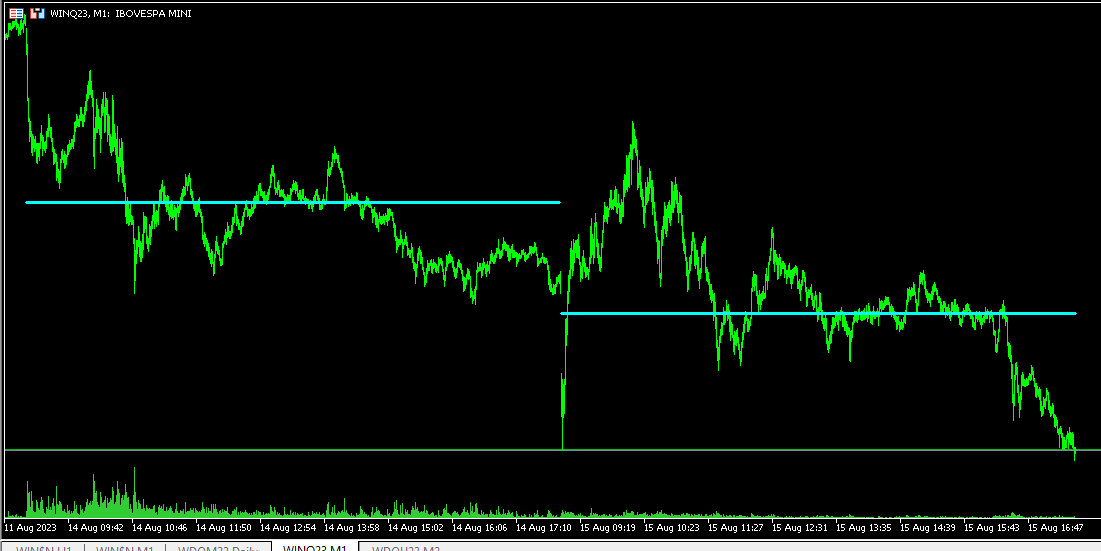
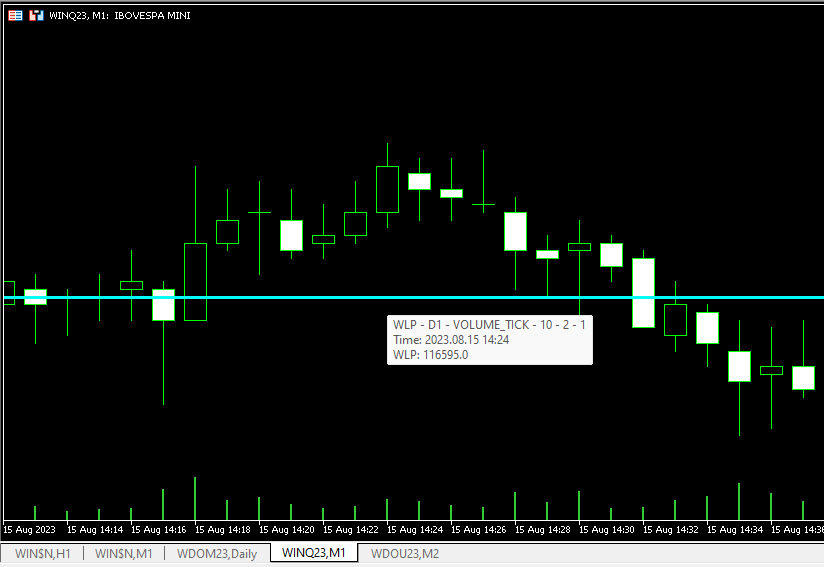
  • Precise POC Calculation: White Light POC utilizes proprietary algorithms to provide accurate Point of Control calculations. This market profile indicator helps identify price levels where trading activity is concentrated, assisting in making informed trading decisions.

  • Real-time Updates: Stay ahead of the market with real-time updates. WLP allows you to receive updated data at defined intervals, ensuring you have the latest information at your fingertips.

  • Flexible Plotting: Plot historical data over a specified number of candles, providing a comprehensive view of how POC levels have evolved over time. This historical context can guide your trading strategies.

  • Trade-specific Insights: Choose between analyzing all available data or focusing exclusively on trade-specific data. This flexibility allows you to tailor your analysis to different trading scenarios.

Elevate your trading experience with White Light POC (WLP) and unlock the power of precise Point of Control calculations. Empower your trading decisions with this indispensable tool that combines accuracy, adaptability, and efficiency.

Explore other products by White Trader Indicators as well!


おすすめのプロダクト
Ignition
Dansie Software Limited
Strategy Overview The Ignition EA tries to take advantage of sudden momentum when the Ignition pattern is detected. The final bar in the ignition pattern has a small opening wick, a very little or no closing wick, is large in comparison to recent bars and must start from the lower end of the current range (for a bullish ignition) Quick Testing Use Symbol EURUSD, Timeframe M2, and remove the GBPUSD symbol from the "Symbols" input (stratergy 1 and stratergy 2) Settings The below settings
Robot Manual Order Manager is a tool that allows you to automatically include Stop Loss, Breakeven, Take Profit and partials in open trades. Be it a market order or a limit order. Besides, it automatically conducts your trade, moving your stop or ending trades, according to the parameters you choose. To make your operations more effective, the Manual Orders Manager Robot has several indicators that can be configured to work on your trade. Among the options you can count on the features: Conducti
Smart Currency Strength is a powerful yet simple indicator that measures the strength of individual currencies. It features a graphic panel that lists the main currencies and their strength in each timeframe, ranging from 0 (most oversold) to 100 (most overbought). The strength for all currencies in the current timeframe is also shown in a separate window as a multi-line graph, where each currency is represented with a different color, this allows you to monitor the evolution of strength tre
RenkoChart EA
Paulo Henrique Da Silva
4.33 (3)
The RenkoChart tool presents an innovative and highly flexible approach to visualizing market data in MetaTrader 5. This expert creates a custom symbol with Renko bricks directly on the chart, displaying accurate prices at the respective opening date/time for each brick. This feature makes it possible to apply any indicator to the Renko chart. Furthermore, this tool also allows access to historical brick data through native methods in the MQL5 programming language, such as iOpen, iHigh, iLow and
FREE
Contact me after payment to send you the User-Manual PDF File. Volume Profile Indicator A functional and useful tool that can improve your trading plan. This indicator calculates volume in price levels(typical volume indicator shows only candle volumes). With the volume of price levels, you can identify important areas that have the potential to reverse. You can also see the volume of support and resistance levels and decide on them. Using volume profiles along with   Price Action   and  
This MetaTrader 5 (MT5) indicator script is designed to create a visual book representation of the market order book, displaying buy and sell orders directly on the chart. The indicator uses the following features: Customizable Width and Colors : The width of the visual book can be adjusted, and different colors can be set for buy and sell orders. Market Book Data Handling : It retrieves the current market order book data for the symbol and visualizes this data as rectangles overlaid on the char
Enhance Your Trading Performance with the "Better Volume" Indicator Discover the "Better Volume" Indicator: The "Better Volume" is the essential market volume analysis tool for traders aiming to stand out. It analyzes tick volumes with unprecedented accuracy, featuring an advanced moving average function (PERIOD_MA) and customizable buy and sell alerts. Key Features: Advanced Volume Analysis: Recognize volume peaks signaling crucial price movements. Intuitive Buy and Sell Alerts: Stay one step a
Visual Depth of Market
Fernando Lahude Ritter
3.5 (6)
Level 2 Book Visualization Indicator Our innovative indicator seamlessly integrates Level 2 order book data onto your trading chart, offering a real-time view of market depth and the dynamics of supply and demand. With its two key features, you can enhance your market analysis and make more informed trading decisions: Biggest Volume Highlight: This input allows traders to instantly identify the price levels with the largest order lots. By highlighting the heaviest concentration of buy or sell or
FREE
An anchored Vwap With Arrows is an indicator that includes a moving average weighted by volume that allows you to plot on a bottom or a top. Usually banks and institutions measure an average price, this average price is a price range where they agree to make a trade. Using the logic of anchored vwap with arrows it is possible to understand that if the price breaks the vwap it means that someone with enough buying and selling power has lost control. You can use vwap anchored with arrows in any ti
This multi symbol indicator has been designed to automatically identify when price reaches major psychological levels. Also known as round numbers, whole numbers or key levels. As a bonus it can also scan for pivot point level on one selected time frame. Combined with your own rules and techniques, this indicator will allow you to create (or enhance) your own powerful system. Features Can write the signals to a file which can be used by an Expert Advisor for auto trading. Can monitor all symbols
You can change the time period of the chart at the touch of a button. You can also change multiple charts at the touch of a button. You can also change multiple charts at the touch of a button,   saving you the trouble of changing time periods. We are live-streaming the actual operation of the system. Please check for yourself if it is usable. Please check it out for yourself. https://www.youtube.com/@ganesha_forex We do not guarantee your investment results. Investments should be made at y
インディケータは現在のクオートを作成し、これを過去のものと比較して、これに基づいて価格変動予測を行います。インジケータには、目的の日付にすばやく移動するためのテキスト フィールドがあります。 オプション: シンボル - インジケーターが表示するシンボルの選択; SymbolPeriod - 指標がデータを取る期間の選択; IndicatorColor - インジケータの色; HorisontalShift - 指定されたバー数だけインディケータによって描画されたクオートのシフト; Inverse - true は引用符を逆にします。false - 元のビュー。 ChartVerticalShiftStep - チャートを垂直方向にシフトします (キーボードの上下矢印)。 次は日付を入力できるテキストフィールドの設定で、「Enter」を押すとすぐにジャンプできます。
Set price targets, and leave everything else to HINN Lazy Trader! This tool is designed for automatic position sizing from specified levels to designated targets. Using a VPS is recommended (*). The demo version   limited in functionality, be sure to watch this video before using -->  https://youtu.be/2NE8COr9-Bk  and this -->  https://youtu.be/Yv9gid3bMxE A community for users, product discussion, update news, and first line of support are organized in a free Discord: https://discord.gg/zFhEZc
Was: $299  Now: $99   Supply Demand uses previous price action to identify potential imbalances between buyers and sellers. The key is to identify the better odds zones, not just the untouched ones. Blahtech Supply Demand indicator delivers functionality previously unavailable on any trading platform. This 4-in-1 indicator not only highlights the higher probability zones using a multi-criteria strength engine, but also combines it with multi-timeframe trend analysis, previously confirmed swings
「 Professional Manager Trader 」をご紹介します。- トレーディング体験を向上させるために設計された強力なツールです。熟練したフルタイムトレーダーの専門知識に基づいて開発され、このトレーディングインターフェースは効果的に取引と資本を管理します。その戦略はブレイクアウトに基づいており、個別に開発された確認指標を組み込んでいます。これらは成功の実績を持っています。 リスクと資金管理に重点を置いた「 Professional Manager Trader 」は、成功するトレーディングの鍵を握っています。それは抜群のリスク管理と厳格なポジションサイズを持ちながら、予測できない外国為替市場を航海し、資本を守り、下降リスクを制限します。 当社の革新的なトレーディングインターフェースは市場サイクルに先んじており、金融市場の絶え間ない変化にシームレスに適応します。幅広い研究と高度なアルゴリズム分析によって作成されたこのインターフェースは、信頼性のあるトレーディングソリューションを提供します。 パフォーマンスを示すために、私たちはトレーディングインターフェースが数ヶ月間成功
(暗号通貨チャート) 指定した数のバーの数だけ履歴が表示され、インスタントデータが直接表示され始めます。 すべての時間枠で働く機会を提供します。 複数のシンボルを操作できます。 このアプリはバックグラウンドサービスです。 マーケットウォッチ画面に「S」で始まるすべてのシンボルの履歴をダウンロードし、ティックデータを表示します。 BinanceSpotのリアルタイム取引データをMT5に自動的に転送します。 リンク内のスクリプトを実行して、プログラムを使用します。 https://www.mql5.com/en/market/product/69000 このプログラムはインストールが必要です。 https://www.mql5.com/tr/market/product/73887 [ツール]メニュー>> [オプション] >> [エキスパートアドバイザー]からWebRequestを許可し、URLを追加する必要があります:https://api.binance.com https://fapi.binance.
First and foremost, the Insight Flow Indicator stands out as a Non-Repainting, Non-Redrawing, and Non-Lagging tool. This makes it a prime choice for both manual and algorithmic trading, ensuring reliable and consistent signals. User Manual: Settings, Inputs, and Strategy The Insight Flow Indicator leverages price action, strength, and momentum to provide a clear edge in the market. Equipped with advanced filters, it eliminates noise and false signals, enhancing trading potential. By using multip
DYJ MOBILE GAMING TRADING WINNER は、さまざまな端末(MOBILE PHONE、WEB、TRADINGVIEW、MT5)を使用して手動で取引し、EAによって自動的に処理されます。 モバイルトレーディングは、EAのさまざまなグリッドモード、頭皮モード、ヘッジアービトラージモード、および独立注文モードを使用して、手動でポジションを開くことができます。 EAは、モバイルオープニングのストップロスを自動的に設定できます。そして、携帯電話を使用して、グリッド、頭皮、ヘッジ注文を開きます。 EAは、完全自動取引を設定したり、自動および携帯電話の手動混合取引を設定したり、独立した携帯電話の手動取引を設定したりできます。 注文の方向が正しければ、TPは市場を離れます。 注文の方向が間違っている場合、EAはそれを敗北から勝ちに変えることができます。 EAはあらゆる外国為替ブローカーやあらゆる種類の取引に適しています。デリバティブブローカー合成口座インデックスと互換性があります EAは預金とレバレッジのサイズを制限しません。アカウントのレバレッ
The indicator automatically calculates the level and   real volume       Point of control, and also displays the market profile for an array of candles, within the boundaries of a rectangle. If your strategy is based on taking profit on a rebound from price accumulations,   the Range profile indicator will become the main tool in scalping trading. Point of control is calculated based on the total volume for each tick or minute candles, depending on the settings and trading timeframe. In the abse
ichimoku indicator with alert; audible alert, email alert, push alert you can enable or disable the settings as you wish When there is a crossing of tenkansen and kijun you will get an alert When there is a cross between Senkouspan A and Senkouspan B you will get an alert Affordable sound settings possibility to modify the parameters of the ichimoku indicator
EA の暗号通貨ライブティックデータの買値と売値および予約の深さ 利用可能な交換所: 1. Binance Spot (アクティブなチャートウィンドウで注文帳深度をサポート) および先物 (複数の注文帳深度をサポート) 2. Kucoin スポットと先物、アクティブなチャート ウィンドウでオーダーブックの深さをサポート 3. Bybit 先物およびインバース先物ティック データ ビッド アスク 最後 今後の取引所: OKX、MEXC など。 特徴 : 1. 買い値と売り値情報を含むライブティックデータ 2. 最高入札額と注文数量、ユーザーは設定から深さを有効/無効にできます 3. 履歴のロード: 始値高値安値終値値とティック値データを更新します 4. 履歴の自動更新:MT5ターミナルを再起動すると不足しているバーを埋める 5. 暗号データのストラテジーテスターを使用して、暗号シンボルティックのエキスパートアドバイザーであらゆる戦略をバックテストできます 6. このユーティリティは外部 DLL ファイルをロードする必
An ICT fair value gap is a trading concept that identifies market imbalances based on a three-candle sequence. The middle candle has a large body while the adjacent candles have upper and lower wicks that do not overlap with the middle candle. This formation suggests that there is an imbalance where buying and selling powers are not equal. Settings Minimum size of FVG (pips) -> FVGs less than the indicated pips will be not be drawn Show touched FVGs Normal FVG color -> color of FVG that hasn't
FREE
Here I present you this awesome indicator I made. This is a nique combination witch puts you in the same level as MM's. So you can surf a lot of waves and identify the rally time, breakouts, and the perfect time to get in the market. ---- The SSL Channel is a great all-rounder based on 2 Simple Moving Averages, one of recent Highs, one of recent Lows. The calculation prints a   channel   on the chart consisting of 2 lines. This strategy gives a Long signal when price closes above the top of the
MT5 Broker  Ticks HTTP Provider Description EA turns your MT5 terminal into historical/realtime ticks  data provider for your application.  There are many market data providers on the internet, but in practice, the data provided is not always of good quality. Moreover, these services are often more expensive and typically require monthly subscription fees per each symbol. With this EA, you can feed your application with exactly the same tick data that you see in the MT5 terminal, the same dat
Market Profile MetaTrader System  — is a classic Market Profile implementation that can show the price density over time, outlining the most important price levels, value area, and control value of a given trading session. This indicator can be attached to timeframes between M1 and D1 and will show the Market Profile for daily, weekly, monthly, or even intraday sessions. Lower timeframes offer higher precision. Higher timeframes are recommended for better visibility. It is also possible to use a
The Volumebyprice.com Indicator for MetaTrader 5 features Volume Profile and Market Profile TPO (Time Price Opportunity). Volume and TPO histogram bar and line charts. Volume Footprint charts. TPO letter and block marker collapsed and split structure charts. Static, dynamic and flexible range segmentation and compositing methods with relative and absolute visualizations. Session hours filtering and segment concatenation with Market Watch and custom user specifications. Graphical layering, posit
Welcome to the Ultimate Harmonic Patterns recognition indicator that is focused to detect advanced patterns. The Gartley pattern, Bat pattern, and Cypher pattern  are popular technical analysis tools used by traders to identify potential reversal points in the market. Our Ultimate Harmonic Patterns recognition Indicator is a powerful tool that uses advanced algorithms to scan the markets and identify these patterns in real-time. With our Ultimate Harmonic Patterns recognition Indicator, you
Awesome Oscillator by Bill Williams with the ability to fine-tune and replace the averaging algorithms of the indicator, which significantly expands the possibilities of using this oscillator in algorithmic trading and brings it closer in its properties to such an indicator as the MACD. To reduce price noise, the final indicator is processed with an additional Smooth averaging. The indicator has the ability to give alerts, send mail messages and push signals when the direction of movement of th
Start Display N Bars
Ricardo Almeida Branco
5 (1)
Do you already know Display N Bars? Do you already know the Start tool (from Midas indicators)? In this indicator, we unified the two tools, allowing you to define which candle will start counting, or use the automatic numbering that was already available in the previous version. Description of the utility follows: Display N Bars The Display N Bars utility is a simple tool that aims to help identify candles. If a trader tries to share the knowledge with a colleague but it i
Was: $249  Now: $99   Market Profile defines a number of day types that can help the trader to determine market behaviour. A key feature is the Value Area, representing the range of price action where 70% of trading took place. Understanding the Value Area can give traders valuable insight into market direction and establish the higher odds trade. It is an excellent addition to any system you may be using. Inspired by Jim Dalton’s book “Mind Over Markets”, this indicator is designed to suit the
このプロダクトを購入した人は以下も購入しています
まず第一に、この取引インジケーターは再描画されず、再描画されず、遅延しないことを強調する価値があります。これにより、手動取引とロボット取引の両方に理想的なものになります。 ユーザーマニュアル:設定、入力、戦略。 アトミックアナリストは、価格の強さとモメンタムを利用して市場でより良いエッジを見つけるためのPA価格アクションインジケーターです。ノイズや誤ったシグナルを除去し、取引ポテンシャルを高めるための高度なフィルターを備えています。複雑なインジケーターの複数のレイヤーを使用して、アトミックアナリストはチャートをスキャンし、複雑な数学的計算をシンプルなシグナルと色に変換します。これにより、どのような初心者トレーダーでも理解して使用し、一貫した取引の決定を行うことができます。 「アトミックアナリスト」は、新規および経験豊富なトレーダー向けにカスタマイズされた包括的な取引ソリューションです。プレミアムインジケーターとトップノッチの機能を1つの取引戦略に組み合わせ、すべてのタイプのトレーダーにとって汎用性のある選択肢にします。 デイリートレーディングとスキャルピング戦略:高速で正確な
まず第一に、このトレーディングシステムがノンリペイント、ノンリドロー、ノンラグのインジケーターであることを強調する価値がある。これにより、手動取引とロボット取引の両方に理想的なものになっています。 オンラインコース、マニュアル、プリセットのダウンロード。 「スマートトレンドトレーディングシステム MT5」は、新規および経験豊富なトレーダー向けにカスタマイズされた包括的なトレーディングソリューションです。10以上のプレミアムインジケーターを組み合わせ、7つ以上の堅実なトレーディング戦略を備えており、多様な市場状況に対応する多目的な選択肢となっています。 トレンドフォロー戦略:トレンドを効果的に乗り越えるための正確なエントリーとストップロス管理を提供します。 リバーサル戦略:潜在的なトレンドの反転を特定し、トレーダーがレンジ相場を活用できるようにします。 スキャルピング戦略:高速で正確なデイトレードおよび短期取引のために設計されています。 安定性:すべてのインジケーターはノンリペイント、ノンリドロー、ノンラグであり、信頼性の高いシグナルを保証します。 カスタマイズ:個々の取引の嗜好に合わせ
Gold Stuff mt5
Vasiliy Strukov
4.9 (183)
Gold Stuff mt5 は、金専用に設計されたトレンド指標であり、あらゆる金融商品にも使用できます。 インジケーターは再描画せず、遅れません。 推奨時間枠 H1. 設定と個人的なボーナスを得るために、購入後すぐに私に連絡してください!  トレンド スキャナーの強力なサポートを利用して、無料のインジケーターを入手し、プライバシーを守ります。あーみー!   設定 矢印を描く - オンオフ。 チャートに矢印を描く。 アラート - 可聴アラートのオンオフ。 メール通知 - オンオフ。 電子メール通知。 プチ通知 - オンオフ。 プッシュ通知。 次に、色域を調整します。 Gold Stuff mt5 は、金専用に設計されたトレンド指標であり、あらゆる金融商品にも使用できます。 インジケーターは再描画せず、遅れません。 推奨時間枠 H1. 設定と個人的なボーナスを得るために、購入後すぐに私に連絡してください!   設定 矢印を描く - オンオフ。 チャートに矢印を描く。 アラート - 可聴アラートのオンオフ。 メール通知 - オンオフ。 電子メール通知。 プチ通
Reversal First Impulse levels (RFI)      INSTRUCTIONS        RUS       -       ENG              R ecommended to use with an indicator   -   TPSpro  TREND PRO -  Version MT4                 A key element in trading is zones or levels from which decisions to buy or sell a trading instrument are made. Despite attempts by major players to conceal their presence in the market, they inevitably leave traces. Our task was to learn how to identify these traces and interpret them correctly. Main functi
TPSpro TREND PRO  - is a trend indicator that automatically analyzes the market and provides information about the trend and each of its changes, as well as giving signals for entering trades without redrawing! The indicator uses each candle, analyzing them separately. referring to different impulses - up or down impulse. Exact entry points into transactions for currencies, crypto, metals, stocks, indices!  Version MT4               DETAILED DESCRIPTION               R ecommended to use with an
トレンド スクリーナー インジケーターでトレンド取引の力を解き放ちます。ファジー ロジックと複数通貨システムを活用した究極のトレンド取引ソリューションです。 ファジー ロジックを活用した革新的なトレンド インジケーターである Trend Screener を使用して、トレンド取引を向上させます。 これは、13 を超えるプレミアム ツールと機能、および 3 つの取引戦略を組み合わせた強力なトレンド追跡インジケーターであり、Metatrader をトレンド アナライザーにする多用途の選択肢となります。 期間限定オファー : トレンド スクリーナー インジケーターは、わずか 50 ドルで生涯ご利用いただけます。 (元の価格 125$ ) (オファー延長) Trend Screener の 100% 非再描画精度の揺るぎない精度を体験して、取引の決定が過去の価格変動の影響を受けないようにしてください。 マルチタイムフレームおよびマルチ通貨機能の多用途性を解放し、比類のない自信を持って外国為替、商品、暗号通貨、インデックスの世界を取引できるようにします。 Trend Screener の包括的な
Quantum Trend Sniper
Bogdan Ion Puscasu
4.92 (48)
ご紹介   クォンタム トレンド スナイパー インジケーターは 、トレンド反転を特定して取引する方法を変革する画期的な MQL5 インジケーターです。 13年以上の取引経験を持つ経験豊富なトレーダーのチームによって開発されました。     クォンタムトレンドスナイパーインジケーター   は、非常に高い精度でトレンドの反転を識別する革新的な方法で、あなたのトレーディングの旅を新たな高みに押し上げるように設計されています。 ***Quantum Trend Sniper Indicatorを購入すると、Quantum Breakout Indicatorを無料で入手できます!*** クォンタム ブレイクアウト インジケーターは、トレンドの反転を特定するとアラートを発し、矢印を示し、3 つのテイクプロフィットレベルを提案します。 初心者トレーダーにもプロのトレーダーにも適しています。 量子EAチャネル:       ここをクリック MT4のバージョン:       ここをクリック 推奨事項: 期間:すべての時間枠。最良の結果を得るには、M
Atbot
Zaha Feiz
4.95 (20)
AtBot: どのように機能し、どのように使用するか ### どのように機能するか MT5プラットフォーム用の「AtBot」インジケーターは、テクニカル分析ツールの組み合わせを使用して売買シグナルを生成します。単純移動平均(SMA)、指数移動平均(EMA)、および平均真実範囲(ATR)インデックスを統合して取引機会を特定します。さらに、Heikin Ashiキャンドルを使用してシグナルの精度を向上させることもできます。 購入後にレビューを残すと、特別なボーナスギフトを受け取ります。 ### 主な機能: - 再描画なし: シグナルはプロット後に変更されません。 - 再描画なし: シグナルは一貫しており、変更されません。 - 遅延なし: 遅延なくタイムリーなシグナルを提供します。 - 多様な時間枠: あらゆる時間枠で使用可能で、取引戦略に合わせることができます。 ### 操作手順: #### 入力と設定: - firstkey (TrendValue): トレンド検出の感度を調整します。 - Secondkey (SignalValue): 売買シグナル生成の感度を定義します。 - ma
mql5と Telegramの モーニング・ブリーフィングで、詳細とスクリーンショットを含む毎日のマーケット・アップデートをご覧 ください! FX Power MT5 NGは 、長年の人気を誇る通貨強度計FX Powerの次世代モデルです。 この次世代ストレングスメーターは何を提供するのでしょうか?初代FXパワーの魅力すべて プラス GOLD/XAUの強さ分析 より正確な計算結果 個別に設定可能な分析期間 カスタマイズ可能な計算上限値により、さらに優れたパフォーマンスを実現 もっと見たい人のための特別なマルチインスタンス設定 すべてのチャートでお好みの色を無限に設定可能 数え切れないほどの通知オプションにより、重要なことを見逃すことはありません。 Windows 11とmacOSのスタイルで角を丸くした新しいデザイン 魔法のように動くインジケーターパネル FXパワーの主な機能 すべての主要通貨の強さの完全な履歴 すべての時間枠における通貨の強さの履歴 すべてのブローカーとチャートで同一の計算結果 100%信頼できるリアルタイム計算 -> リペイントなし ドロップダウン・リストから
まず第一に、この取引ツールはノンリペイント、ノンリドロー、ノンラグの指標であり、プロの取引に理想的ですことを強調する価値があります。 オンラインコース、ユーザーマニュアル、デモ。 スマートプライスアクションコンセプトインジケーターは、新米から経験豊富なトレーダーまで、非常 に強力なツールです。Inner Circle Trader AnalysisやSmart Money Concepts Trading Strategiesなど、20以上の有用な指標を1つに組み合わせています。このインジケーターはスマートマネーコンセプトに焦点を当て、大手機関の取引方法を提供し、彼らの動きを予測するのに役立ちます。 特に、流動性分析に優れており、機関がどのように取引しているかを理解しやすくしています。市場のトレンドを予測し、価格の動きを慎重に分析するのに優れています。機関の戦略とトレードを合わせることで、市場の動向についてより正確な予測ができます。このインジケーターは多目的であり、市場構造を分析し、重要な注文ブロックを特定し、さまざまなパターンを認識するのに優れています。 このインジ
IX Powerは 、FX Powerの無敵の精度をついにFX以外のシンボルにも提供します。 お気に入りの指数、株式、コモディティ、ETF、さらには暗号通貨の短期、中期、長期のトレンドの強さを正確に判断します。 お使いの端末が提供する すべてを分析する ことができます。ぜひお試しいただき、取引 タイミングが大幅に改善 されることをご体験ください。 IXパワーの主な特徴 100%正確で再描画されない計算結果 - ターミナルで利用可能なすべての取引シンボルに対して 予め設定され、さらに個別に設定可能な強度分析期間のドロップダウン選択 Eメール、メッセージ、モバイル通知による無数の通知オプション EAリクエストのためのアクセス可能なバッファ カスタマイズ可能な計算制限により、さらに優れたパフォーマンスを実現 もっと見たい人のための特別なマルチインスタンス設定 すべてのチャートでお好みの色を無限に設定可能 Windows 11とmacOSのスタイルで角を丸くした新しいパネルデザイン サブ・ウィンドウとメイン・チャートの間をシームレスに移動する、魔法のように動くイン
このダッシュボードは、選択されたシンボルの最新の利用可能なハーモニックパターンを表示するので、時間を節約し、より効率的に /   MT4バージョン 。 無料インジケーター:   Basic Harmonic Pattern インジケーター列 Symbol : 選択したシンボルが表示されます。 Trend :   強気または弱気 Pattern : パターンの種類(ガートレー、バタフライ、バット、カニ、サメ、サイファー、ABCD) Entry : エントリー価格 SL: ストップロス価格 TP1: 1回目の利食い価格 TP2: 2回目の利食い価格 TP3:   3回目の利食い価格 Current price :   現在値 Age (in bars):    最後に描画されたパターンの年齢 主な入力項目 Symbols:   "28 Major Currency Pairs "または "Selected Symbols "から選択。 Selected Symbols:   カンマで区切られた監視したいシンボル("EURUSD,GBPUSD,XAUUSD")。ブローカーが
これはMT5のインジケーターで、再描画なしで取引に参入するための正確なシグナルを提供します。 外国為替、暗号通貨、金属、株式、インデックスなど、あらゆる金融資産に適用できます。かなり正確な見積もりを提供し、取引を開始して終了するのに最適な時期を教えてくれます。1つのシグナルを処理しただけでインジケーターの元が取れた例の 動画 (6:22)をご覧ください。Entry PointsPro インジケーターの助けを借りたほとんどのトレーダーの最初の1週間の結果が改善しています。 Telegramグループ に登録してください。Entry Points Proインジケーターのメリットは次の通りです。 再描画のないエントリーシグナル 再描画されるインジケーターでは一度表示されたシグナルが削除されて大きな金銭的損失につながることがありますが、これと異なり、表示されて確認されたシグナルは消えることがありません。 エラーなしの取引開始 インジケーターアルゴリズムによって取引を開始する(資産を売買する)理想的な瞬間を見つけることができます。それを使用するすべてのトレーダーの成功率が向上します。
今、147ドル(いくつかの更新後に499ドルに増加します) - 無制限のアカウント(PCSまたはMac) RelicusRoad ユーザー マニュアル + トレーニング ビデオ + プライベート Discord グループへのアクセス + VIP ステータス 市場の新しい見方 RelicusRoad は、外国為替、先物、暗号通貨、株式、および指数の世界で最も強力な取引インジケーターであり、トレーダーに収益を維持するために必要なすべての情報とツールを提供します。初心者から上級者まで、すべてのトレーダーが成功するためのテクニカル分析と取引計画を提供します。これは、将来の市場を予測するのに十分な情報を提供する重要な取引指標です。意味をなさないチャート上のいくつかの異なる指標ではなく、完全な解決策を信じています.これは、信号、矢印 + 価格アクション情報を表示するオールインワンのインジケーターで、他に類を見ない非常に正確です。 強力な AI に基づいて、RelicusRoad は不足している情報とツールを提供して、あなたを教育し、トレーディングのプロ、成功したトレーダーにします。
ICT, SMC, SMART MONEY CONCEPTS, SMART MONEY, Smart Money Concept, Support and Resistance, Trend Analysis, Price Action, Market Structure, Order Blocks, BOS/CHoCH,   Breaker Blocks ,  Momentum Shift,   Supply&Demand Zone/Order Blocks , Strong Imbalance,   HH/LL/HL/LH,    Fair Value Gap, FVG,  Premium  &   Discount   Zones, Fibonacci Retracement, OTE, Buy Side Liquidity, Sell Side Liquidity, BSL/SSL Taken, Equal Highs & Lows, MTF Dashboard, Multiple Time Frame, BigBar, HTF OB, HTF Market Structure
Easy By Sell is a market indicator for opening and closing positions. It becomes easy to track market entries with alerts. It indicates trend reversal points when a price reaches extreme values ​​and the most favorable time to enter the market. it is as effective as a Fibonacci to find a level but it uses different tools such as an algorithm based on ATR indicators and Stochastic Oscillator. You can modify these two parameters as you wish to adapt the settings to the desired period. My othe
現在33%オフ 初心者にもエキスパートトレーダーにも最適なソリューション このインジケーターは独自の機能と新しい公式を多数内蔵しており、ユニークで高品質かつ手頃な取引ツールです。このアップデートでは、2つの時間枠ゾーンを表示できるようになります。より長いTFだけでなく、チャートTFとより長いTF(ネストゾーンを表示)の両方を表示できます。すべてのSupply Demandトレーダーの皆さんのお気に召すはずです。:) 重要情報の公開 Advanced Supply Demandの可能性を最大化するには、 https://www.mql5.com/ja/blogs/post/720245 にアクセスしてください。   エントリーまたはターゲットの正確なトリガーポイントを正確に特定できれば取引がどのように改善されるか想像してみてください。新しい基盤となるアルゴリズムに基づいて構築されているため、買い手と売り手の間の潜在的な不均衡をさらに簡単に特定できます。これは、最も強い需要と供給のゾーンと、過去のパフォーマンス(古いゾーンを表示)がグラフィカルに表現されるためです。これらの機能は、最適
Introduction to X3 Chart Pattern Scanner X3 Cherart Pattern Scanner is the non-repainting and non-lagging indicator detecting X3 chart patterns including Harmonic pattern, Elliott Wave pattern, X3 patterns, and Japanese Candlestick patterns. Historical patterns match with signal patterns. Hence, you can readily develop the solid trading strategy in your chart. More importantly, this superb pattern scanner can detect the optimal pattern of its kind. In addition, you can switch on and off individu
AW Trend Predictor MT5
AW Trading Software Limited
4.78 (58)
1 つのシステムでのトレンド レベルとブレイクダウン レベルの組み合わせ。高度なインジケーター アルゴリズムは、市場のノイズをフィルター処理し、トレンド、エントリー ポイント、および可能なエグジット レベルを決定します。インジケーターシグナルは統計モジュールに記録されるため、最適なツールを選択してシグナル履歴の有効性を示すことができます。この指標は、テイクプロフィットとストップロスのマークを計算します。 マニュアルと説明書 ->   ここ / MT4 バージョン ->   ここ インジケーターで取引する方法: Trend Predictor での取引は、たった 3 つの簡単なステップです。 ステップ 1 - ポジションを開く 70% 以上の成功率で買いシグナルが受信されました ステップ 2 - ストップロスの決定 逆信号でトランクを選択 ステップ 3 - テイクプロフィット戦略の定義 戦略 1: TP1 に到達したらポジション全体をクローズする 戦略 2: TP1 に達した時点でポジションの 50% をクローズし、TP2 に達した時点で残りの 50% をクローズします。 戦略 3:
FX Trend MT5
Daniel Stein
4.68 (37)
常に利益を出し続ける5つ星FXトレーダーになりたいですか? 購入時のスクリーンショットを送信して、専用トレーディングチャットへの個人的な招待を受ける FXトレンド は、すべての時間枠のトレンド方向、期間、強度、その結果のトレンド評価をリアルタイムで表示します。 トレンドがどの方向に動いているか、どのくらい続いているか、どのくらい強力かが一目瞭然です。 これらにより初心者、上級者およびプロのトレーダーにとって使いやすいトレンド取引システムとなって います 。 分析機能 全時間軸のリアルタイムトレンド分析 すべてのタイムフレームで同一の計算結果 時間枠を個別に設定することが可能 トレンドの計算パラメータをカスタマイズ可能 グラフィック機能 コンパクトモード、詳細モード、ダッシュボードモードをワンクリックで切り替え可能 コンパクトモードでは、基本的なトレンド情報を縮小パネルで表示します。 詳細モードでは、基礎となるシンボルの詳細なトレンド分析が可能です。 ダッシュボードモードは、すべてのメジャー銘柄やお気に入りの取引銘柄をカバーします。 パネル内でワンクリックするだけで、すべて
ご紹介     Quantum Breakout PRO は 、ブレイクアウト ゾーンの取引方法を変革する画期的な MQL5 インジケーターです。 13年以上の取引経験を持つ経験豊富なトレーダーのチームによって開発されました。     クォンタム ブレイクアウト プロ   は、革新的でダイナミックなブレイクアウト ゾーン戦略により、あなたのトレーディングの旅を新たな高みに押し上げるように設計されています。 クォンタム ブレイクアウト インジケーターは、5 つの利益ターゲット ゾーンを備えたブレイクアウト ゾーン上のシグナル矢印と、ブレイクアウト ボックスに基づいたストップロスの提案を提供します。 初心者トレーダーにもプロのトレーダーにも適しています。 量子EAチャネル:       ここをクリック 重要!購入後、インストールマニュアルを受け取るためにプライベートメッセージを送ってください。 推奨事項: 時間枠: M15 通貨ペア: GBPJPY、EURJPY、USDJPY、NZDUSD、XAUUSD アカウントの種類: ECN、Raw、またはス
Auto Order Block with break of structure based on ICT and Smart Money Concepts (SMC) Futures Break of Structure ( BoS )             Order block ( OB )            Higher time frame Order block / Point of Interest ( POI )    shown on current chart           Fair value Gap ( FVG ) / Imbalance   -  MTF      ( Multi Time Frame )    HH/LL/HL/LH  -  MTF      ( Multi Time Frame )  Choch  MTF      ( Multi Time Frame )  Volume Imbalance     ,  MTF          vIMB Gap’s Power of 3 Equal High
The AT Forex Indicator MT5 is a sophisticated trading tool designed to provide traders with a comprehensive analysis of multiple currency pairs. This powerful indicator simplifies the complex nature of the forex market, making it accessible for both novice and experienced traders. AT Forex Indicator uses advanced algorithms to detect trends, patterns and is an essential tool for traders aiming to enhance their forex trading performance. With its robust features, ease of use, and reliable signal
Matrix Arrow Indicator MT5
Juvenille Emperor Limited
5 (14)
マトリックスアローインジケーターMT5は、すべてのシンボル/商品(外国為替、商品、暗号通貨、インデックス、株式)で使用できる100%再描画されていないマルチタイムフレームインジケーターに続くユニークな10in1トレンドです。マトリックスアローインジケーターMT5は、初期段階で現在のトレンドを判断し、最大10の標準インジケーターから情報とデータを収集します。 平均方向移動指数(ADX) 商品チャネルインデックス(CCI) クラシック平研アシキャンドル 移動平均 移動平均収束発散(MACD) 相対活力指数(RVI) 相対力指数(RSI) 放物線SAR ストキャスティクス ウィリアムズのパーセント範囲 すべてのインジケーターが有効な買いまたは売りシグナルを与えると、対応する矢印がチャートに印刷され、次のろうそく/バーの開始時に強い上昇トレンド/下降トレンドを示します。ユーザーは、使用するインジケーターを選択し、各インジケーターのパラメーターを個別に調整できます。マトリックスアローインジケーターMT5は選択されたインディケーターからのみ情報を収集し、それらのデータのみに基づいてアローを印
Gold TMAF MTF - これは最高の株式テクニカル指標です。指標のアルゴリズムは、資産の値動きを分析し、ボラティリティと潜在的なエントリーゾーンを反映しています。 最高の指標シグナル: - 売りの場合 = TMA2の赤い上限がTMA1の赤い上限の上にある場合 + 上記の赤いフラクタル指標 + 同じ方向に黄色のSRシグナル矢印。 - 買いの場合 = TMA2の青い下限線がTMA1の青い下限線より下にある場合 + 下からの青いフラクタル指標 + 同じ方向の水色のSRシグナル矢印。 このインディケータの利点 1. このインディケータは、高精度のシグナルを生成します。 2. 確定した矢印シグナルは再描画されませんが、フラクタルシグナルは半周期再描画されます。 3. どのブローカーのMetaTrader 5取引プラットフォームでも取引できます。 4. あらゆる資産(通貨、金属、暗号通貨、株式、指数など)を取引できます。 5. M30-H1タイムフレーム(中期取引)で取引するのがよい。 6. 各トレーダーがインディケータを自分用に簡単にカスタマイズできるよ
トレンドラインは、外国為替取引におけるテクニカル分析の最も重要なツールです。残念ながら、ほとんどのトレーダーはそれらを正しく描画していません。自動トレンドラインインジケーターは、市場のトレンドの動きを視覚化するのに役立つ本格的なトレーダー向けのプロフェッショナルツールです。 トレンドラインには、強気トレンドラインと弱気トレンドラインの2種類があります。 上昇トレンドでは、外国為替トレンドラインは価格変動の最低スイングポイントを介して描画されます。 少なくとも2つの「最低安値」を接続すると、トレンドラインが作成されます。 下降トレンドでは、トレンドラインは価格変動の最も高いスイングポイントを介して描画されます。 少なくとも2つの「最高値」を接続すると、トレンドラインが作成されます。 トレンドラインが壊れたとき? 弱気のろうそくが強気のトレンドラインの下で閉じ、ろうそくの高さがトレンドラインの上にあるとき、強気のトレンドラインは壊れます。 強気のろうそくが弱気のトレンドラインの上で閉じ、ろうそくの安値がトレンドラインの下にあるとき、弱気のトレ
Elliott Wave Trend was designed for the scientific wave counting. This tool focuses to get rid of the vagueness of the classic Elliott Wave Counting using the guideline from the template and pattern approach. In doing so, firstly Elliott Wave Trend offers the template for your wave counting. Secondly, it offers Wave Structural Score to assist to identify accurate wave formation. It offers both impulse wave Structural Score and corrective wave Structure Score. Structural Score is the rating to sh
Gartley Hunter Multi - An indicator for searching for harmonic patterns simultaneously on dozens of trading instruments and on all possible timeframes. Manual (Be sure to read before purchasing) | Version for MT4 Advantages 1. Patterns: Gartley, Butterfly, Shark, Crab. Bat, Alternate Bat, Deep Crab, Cypher 2. Simultaneous search for patterns on dozens of trading instruments and on all possible timeframes 3. Search for patterns of all possible sizes. From the smallest to the largest 4. A
Golden Spikes Detector Overview: The Golden Spikes Premium is a groundbreaking trading indicator meticulously crafted for the Boom and Crash indices on the Deriv market. Tailored to meet the needs of discerning traders, this powerful tool operates exclusively on the one-minute timeframe, providing timely and precise signals to maximize your trading potential. The Golden Spikes Detector stands out in its ability to deliver accurate signals, ensuring that you capitalize on market opportunities wit
FX Volume MT5
Daniel Stein
4.94 (17)
mql5と Telegramの モーニング・ブリーフィングで、詳細とスクリーンショットを含む毎日のマーケット・アップデートをご覧 ください! FX Volumeは、ブローカーの視点から市場のセンチメントをリアルに洞察する、最初で唯一の出来高インジケーターです。 ブローカーのような機関投資家が外国為替市場でどのようなポジションをとっているか、COTレポートよりもはるかに速く、素晴らしい洞察を提供します。 この情報をチャート上で直接見ることは、あなたの取引にとって真のゲームチェンジャーであり、画期的なソリューションです。 以下のようなユニークなマーケットデータ洞察から利益を得てください。 比率は 、通貨のロングポジションとショートポジションの比率をパーセントで表示します。 比率の変化は 、選択した期間内のロング比率とその変化率を表示します。 Volumes Totalは 、通貨の取引量(ロングとショート)の合計をロット単位で表示します。 Volumes Long :全通貨のロングポジションの取引量を表示します。 Volumes(ショート )は、全通貨のショートポジションの取引量を表示
作者のその他のプロダクト
White Weis Volume This indicator shows the sum of the volume in each wave, bulish or bearish, as idealized by David Weis , but it brings an important addition , which is the marking of the bar with the highest volume of the wave (White Bar)! In coding the indicator, it was sought to optimize the code to require minimal processing during use and not to overload mt5. The indicator can be used for pre-trading analysis and study, where the trader analyzes possible points of support and resi
Attention: New update - 4 major practicality improvements! 1) Alarm 2) Midas text value 3) Click panel 4) Can be connected to an EA to operate in semi-automatic mode Attention - This indicator does not work perfectly in backtest due to MT5 peculiarities (Reading hotkeys or panel clicks) . My suggestion is that you test Automatic Vwap Midas which has automatic operation to analyze the calculation and then buy Start if you think the indicator will match your operating.     This indicator i
The Danko Trend Color indicator is actually a candle coloring to bring practicality, ease and information to your charts. Danko Trend Color combines PRICE AND VOLUME indicators to define the prevailing trend, so the colors are: Blue (indicates an uptrend) Orange (indicates a downtrend) White (indicates undefined trend) I don't like to promise anything with my indicators, I ask you to download, test it for free (for use in backtesting) and see if the indicator can, in some way, help you
Start Midas SD Channel
Ricardo Almeida Branco
5 (1)
Do you already know the Start Midas indicator? What about the Vwap Standard Deviation indicator? And I need to speak again in the book MIDAS Technical Analysis ... The Start Midas SD Channel indicator combines the two in one, bringing the practicality and efficiency of Midas with the statistical calculation of the standard deviation. All of this with the practicality of the White Trader Start indicators, where you can plot the indicator and move them on the screen using keyboard s
Display N Bars
Ricardo Almeida Branco
4.89 (9)
The Display N Bars utility is a simple tool designed to help identify candles. If a trader tries to share knowledge with a colleague but it is difficult to pinpoint exactly the desired candle, just say the corresponding candle number. The candle count is reset every day. Seeking to offer a good customization the inputs are: Display type -> Display only odd, only odd, or both candles? Direction -> Horizontal or Vertical? Display multiples of: (display frequency) -> Displa
FREE
Volume Doji
Ricardo Almeida Branco
Hey guys. This indicator will show you, in the volume histogram, if the candle was a Doji, a bullish candle, or a bearish candle. The construction of this indicator was requested by a trader who uses other indicators from my catalog, and I decided to release it free to help traders who think that the indicator can contribute to their operations. The parameters are: Volume Type: Real Volume or Tick Volume. Color if the candle is bearish: select the color. Color if the candle is high:
FREE
White Trader Clock
Ricardo Almeida Branco
5 (1)
Simple countdown indicator for the next candle. Only claim is to be light! The indicator inserts a text object to the right of the current price and calculates how much time is left for the new bar, showing this to the trader. Leave your comment if the indicator helped you in any way! If you have any suggestions, let me know to evaluate the improvements. Success and Good Trades!
FREE
Automatic Vwap Midas
Ricardo Almeida Branco
5 (1)
The 3 Automatic Vwap (Midas) Indicator can be used for Price and Volume studyers to map the movement of market drivers. It automatically plots 3 Vwaps, two of which are dynamic and will be updated throughout the day if new highs or new lows emerge. The third Vwap is daily and can help if the trend is up or down. Also, an auxiliary indicator that plots (also dynamic) points of interest with OHLC prices (Open, High and Low of the current day and Close of the previous day) was inserted. Success and
O HL2 C Lines
Ricardo Almeida Branco
5 (2)
If you consider the extremes of the daily price as important points, this indicator will help in your trades. Now, instead of manually drawing lines that mark daily highs and lows, you can use the O (HL) ² C Lines indicator. Thus, the OHLC Lines indicator automatically plots the lines O (Open for the current day), H (High for the current day), L (Low for the current day) and C (Close for the previous day). Plot also the high and low of the previous day. Thus, we have 4 static lines
PVA Dragon
Ricardo Almeida Branco
Users of PVRSA / PVA certainly already know the Dragon indicator and its use. The Dragon works as dynamic support and resistance and can be used for scalper or trend follower. In addition to the Dragon we have the WGT (fast) and EMA (slow) averages that can show immediate movement and also trend movement. Stay tuned for the Dragon's inclination! The indicator can be used on any asset/currency pair and can be customized according to the trader's interest. See also my volume analysi
Several techniques use volume as an important point in the trade. Whether to indicate strength, exhaustion, pullback weakness, among others. In chief I quote Richard Wyckoff's theory, which said about the importance of looking price and volume. However, there are several possibilities to filter what is volume that should be noticed. PVRSA/PVA users use an indicator with specific colors, which assist in identifying the volume and type of movement that the price has made. Will the high
Do you use volume in your reading of the market? Certainly many traders use it, and do not imagine operating without it. The Color Histogram Volume Set indicator allows the user to choose the value that he considers interesting to monitor. When you pass this you will have visual confirmation and if you want you will also have the audible alert that is given by the indicator. Of course, there are other ways to try to find a high volume, such as assessing whether the volume
Do you use volume in your reading of the market? Certainly many traders use it, and do not imagine operating without it. The Color Candle Volume Set indicator allows the user to choose the value that he considers interesting to monitor. When you pass this you will have visual confirmation on the price chart and if you want you will also have the audible alert that is given by the indicator. Of course, there are other ways to try to find a high volume, such as assessing whet
WT Vwap Bands
Ricardo Almeida Branco
The WT Vwap Bands indicator is an indicator that combines price and volume, helping to show whether the price is within the "fair price", overbought or oversold. The indicator code was designed for performance and has already been tested in a real trading account. In addition to the visual inputs (color, thickness and line style), the user can define a% value that depends on the price. The default values work with the most distant band at 1% of the price and then dividing this distan
Fibo Z
Ricardo Almeida Branco
5 (1)
With it, you leave pre-configured two expansion settings and one fibo retraction configuration to use via keyboard shortcut and mouse click. That is, the Fibo_Z utility facilitates the use of MT5's native functions. The shortcut keys are: "Z" configuration 1 of the expansion. "X" expansion setting 2 "Z" retraction configuration. "V" clears objects from the screen. It is. Success and good trades!
Want to make the graph cleaner? Don't you use the opening price in your analysis? Want to use a chart model that was used by Richard Wyckoff? Then you need to know the Color HLC Candles and Bars indicator. In the same indicator you can switch to the display of candles or bars. Take a look at the other volume indicators to complement your operating. And don't forget to look at the best Vwap Custom (Midas)! Leave your comment! Success and good trades!
Vwap Freeze
Ricardo Almeida Branco
5 (1)
The previous day's vwap is used by some traders as a support and resistance point, after all it is one of the ways to consider the fair price of that asset or that pair the day before. Possible defenses can occur in this region indicating a reversal, or triggering stops starting a new, more directional movement. It is a matter of analyzing how it will add to your operational. To avoid manually drawing the previous day's vwaps and saving time for your analysis, use the Vwap Freeze indicator,
Start Display N Bars
Ricardo Almeida Branco
5 (1)
Do you already know Display N Bars? Do you already know the Start tool (from Midas indicators)? In this indicator, we unified the two tools, allowing you to define which candle will start counting, or use the automatic numbering that was already available in the previous version. Description of the utility follows: Display N Bars The Display N Bars utility is a simple tool that aims to help identify candles. If a trader tries to share the knowledge with a colleague but it i
WT Vwap 5 Bands
Ricardo Almeida Branco
5 (1)
WT Vwap 5 Bands The WT Vwap Bands indicator is an indicator that combines price and volume, helping to show whether the price is within the "fair price", overbought or oversold. The indicator code was designed for performance and has already been tested in a real trading account. In addition to the visual inputs (color, thickness and line style), the user can define a% value that depends on the price. The default values work with the most distant band at 1% of the price and then di
The White's Candle Color indicator (by volume) will color the candles based on the current candle's volume compared to the moving average of the volume. This will allow you to see clearly if the volume (real or tick) is within the normal range, whether it is high or low and bring very important information about the market. I hope that this indicator can help in your operational. Success and good trades!
Haos MT5
Ricardo Almeida Branco
5 (1)
The Haos oscillator coded for the MT5! This oscillator allows to verify overbought / oversold regions in two periods (14 and 96, for example), making it possible to anticipate a reversal. Possibility to activate an audible alert when it reaches a defined level. Possibility to choose the alert sound by placing a .wav song in each asset or timeframe. (save a .wav file to the MQL5 \ Files folder) Possibility to activate / deactivate histogram and levels to make the screen cleaner. Customizable co
The Initial Balance (Initial Balance / Initial Balance) is a concept related to the study of volume (to learn more, study about Market Profile and Auction Market Theory. You can find some videos in English when searching for "Initial Balance Market Profile"). The IB defines a range in which prices were negotiated in the first hour of trading.The amplitude of the range is important and the break in the range defined by the Initial Balance may have occurred due to the movement of several players
The VTC Volatility indicator was written to support a Brazilian stock market strategy in the WDO (USDBRL), but it can be adapted to other strategies and markets. In the new indicator update, it is now allowed to choose up to 4 levels to determine the range, and thus be more versatile. The Brazilian stock exchange (B3) has the VTC which is a "Structured Exchange Rate Volatility Transaction" (more information on the B3 website). At around 10:00 am, the VTC "Call" comes out and Brazilian
O indicador Vwap Deviation Bands segue na mesma linha dos outros indicadores da White Trader, que buscam leveza, personalização e qualidade, para entregar o que há de melhor para o trader. Isto, além de combinar preço e volume (informações importantes para o trader) com uma medida estatística do desvio padrão. Este indicador já foi utilizado e testado por outros traders que deram sugestões, inclusive, para chegarmos nesta versão final (embora ainda esteja aceitando sugestões, sempre :)   ). O d
Midas is the acronym for Market Interpretation / Data Analysis System is a trade approach started in 1995 by technical analyst Paul Levine and later developed by Andrew Coles, PhD and David Hawkins. Learn more in the book MIDAS Technical Analysis: A VWAP Approach to Trading and Investing in Today's Markets , (I saw that it is possible buy via Amazon). The positive points in relation to the Midas-based indicators are the prediction of movement reversal points, the negative point is the subjectivi
The Vwap Bands Auto indicator seeks to automatically map the maximum market frequency ( automatic update of the outermost band ) and has two intermediate bands that also adjust to daily volatility. Another tool from White Trader that combines price and volume, in addition to mapping the daily amplitude. The external band is updated automatically when the daily maximum or minimum breaks the current frequency, and can be an input signal, seeking a return to the daily vwap. Thus, in ad
Here we have the Start Midas Fibo Bands , I confess that it is an indicator that excited me enough to operate because I was able to find more defined rules. Well, the indicator has the functions of the other indicators of the Start line , which is a possibility to plot several Midas on the screen, you can move the anchor point using keyboard shortcuts and use the legend to differentiate one anchor from another. The rules that I have analyzed for my possible setup are recommended to the entry, st
Prior Lines
Ricardo Almeida Branco
This indicator shows on the current day some lines of interest, such as maximum, minimum and closing of the previous day, as well as the opening, maximum and minimum price of the current day. It can also show the GAP (closing of the previous day and opening of the current day) and projections of the amplitude of the previous day, according to the value you choose in the multiplier. Oh, I was going to forget. It is also possible to determine the time frame, which is daily by default. If th
The best Vwap Midas coding for Metatrader 5 you can find in White Trader indicators. The indicator has been optimized not to recalculate (improving performance) and has several visual settings for you to adapt in your own way. TRY IT FOR FREE by clicking the free demo button Where and why to use Vwap Midas (and Auto Zig Vwap Midas) can be used on a variety of indices, currencies, forex, cryptocurrencies, stocks, indices and commodities. Many successful traders use price and volume to ge
フィルタ:
レビューなし
レビューに返信