GaussChannelPro MT5
- インディケータ
- Flora Rosa Seeholzer
- バージョン: 1.1
- アップデート済み: 14 5月 2024
- アクティベーション: 5
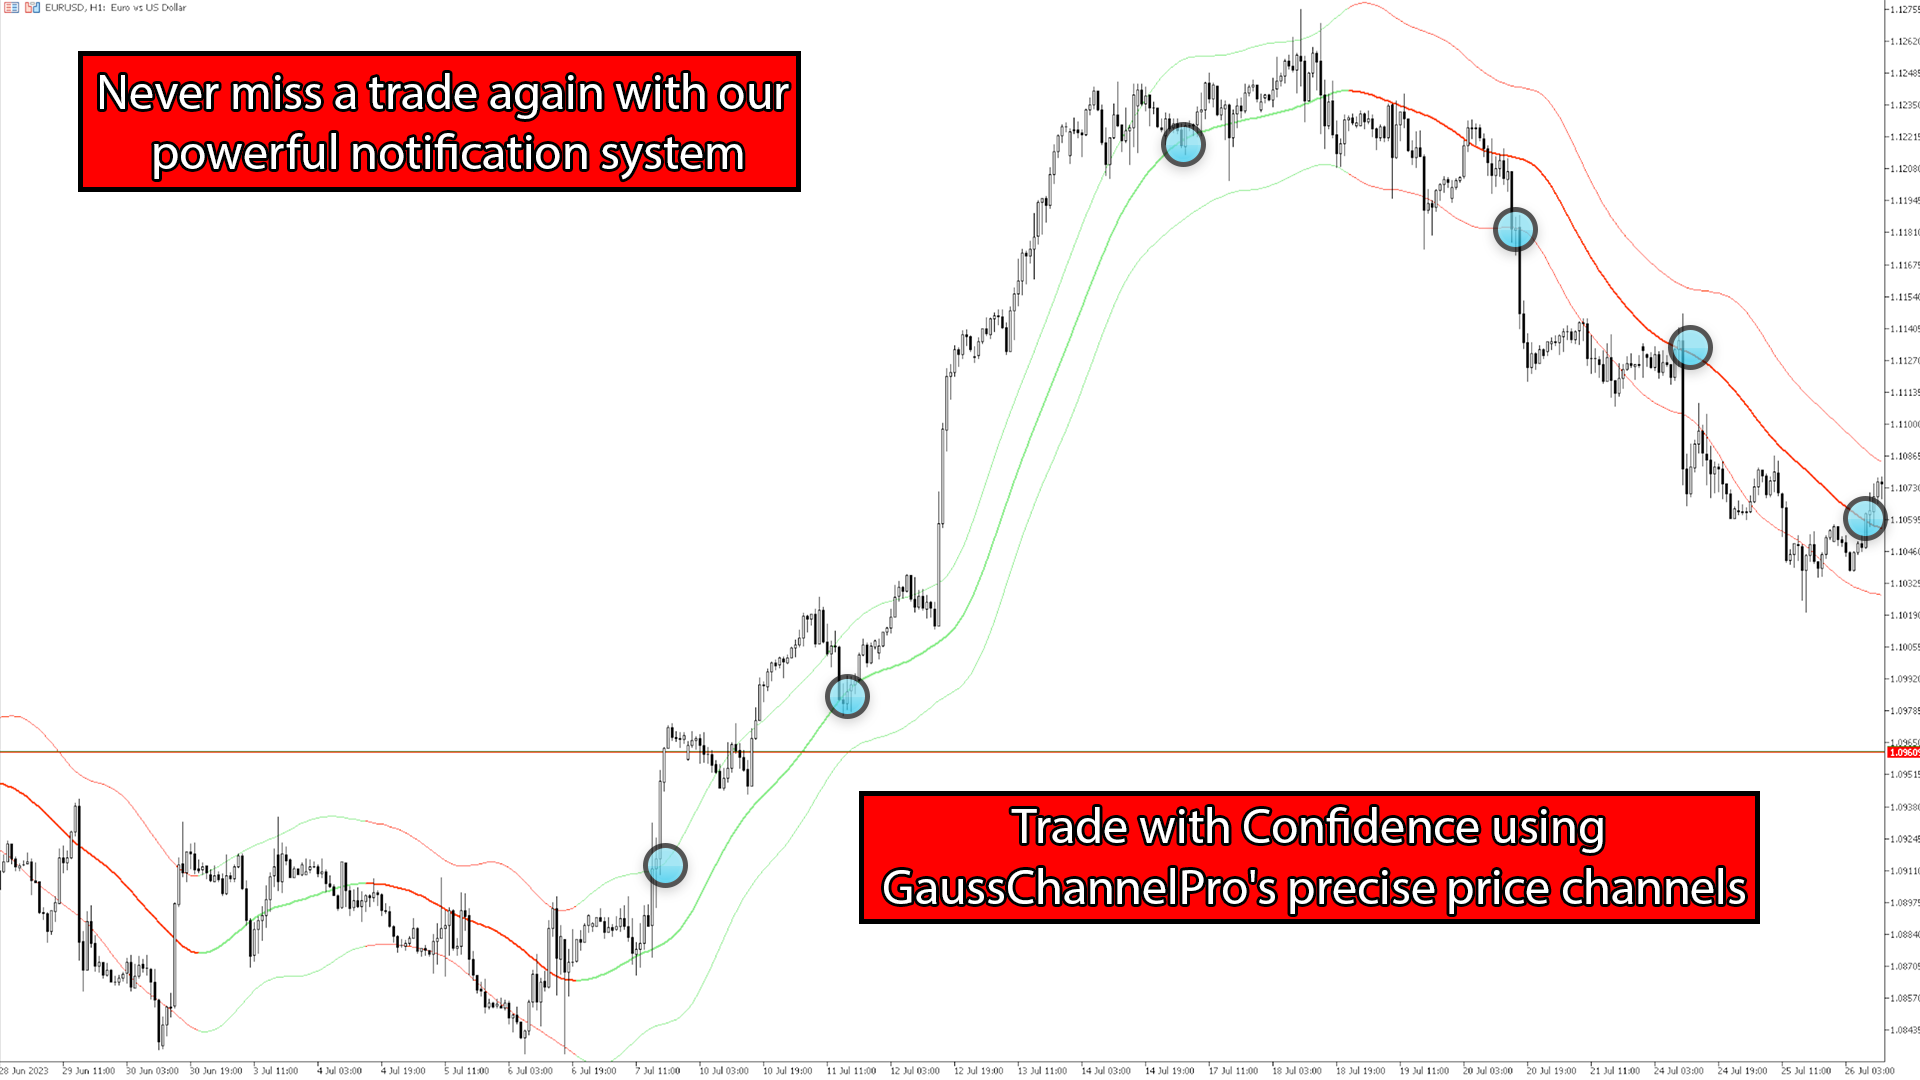
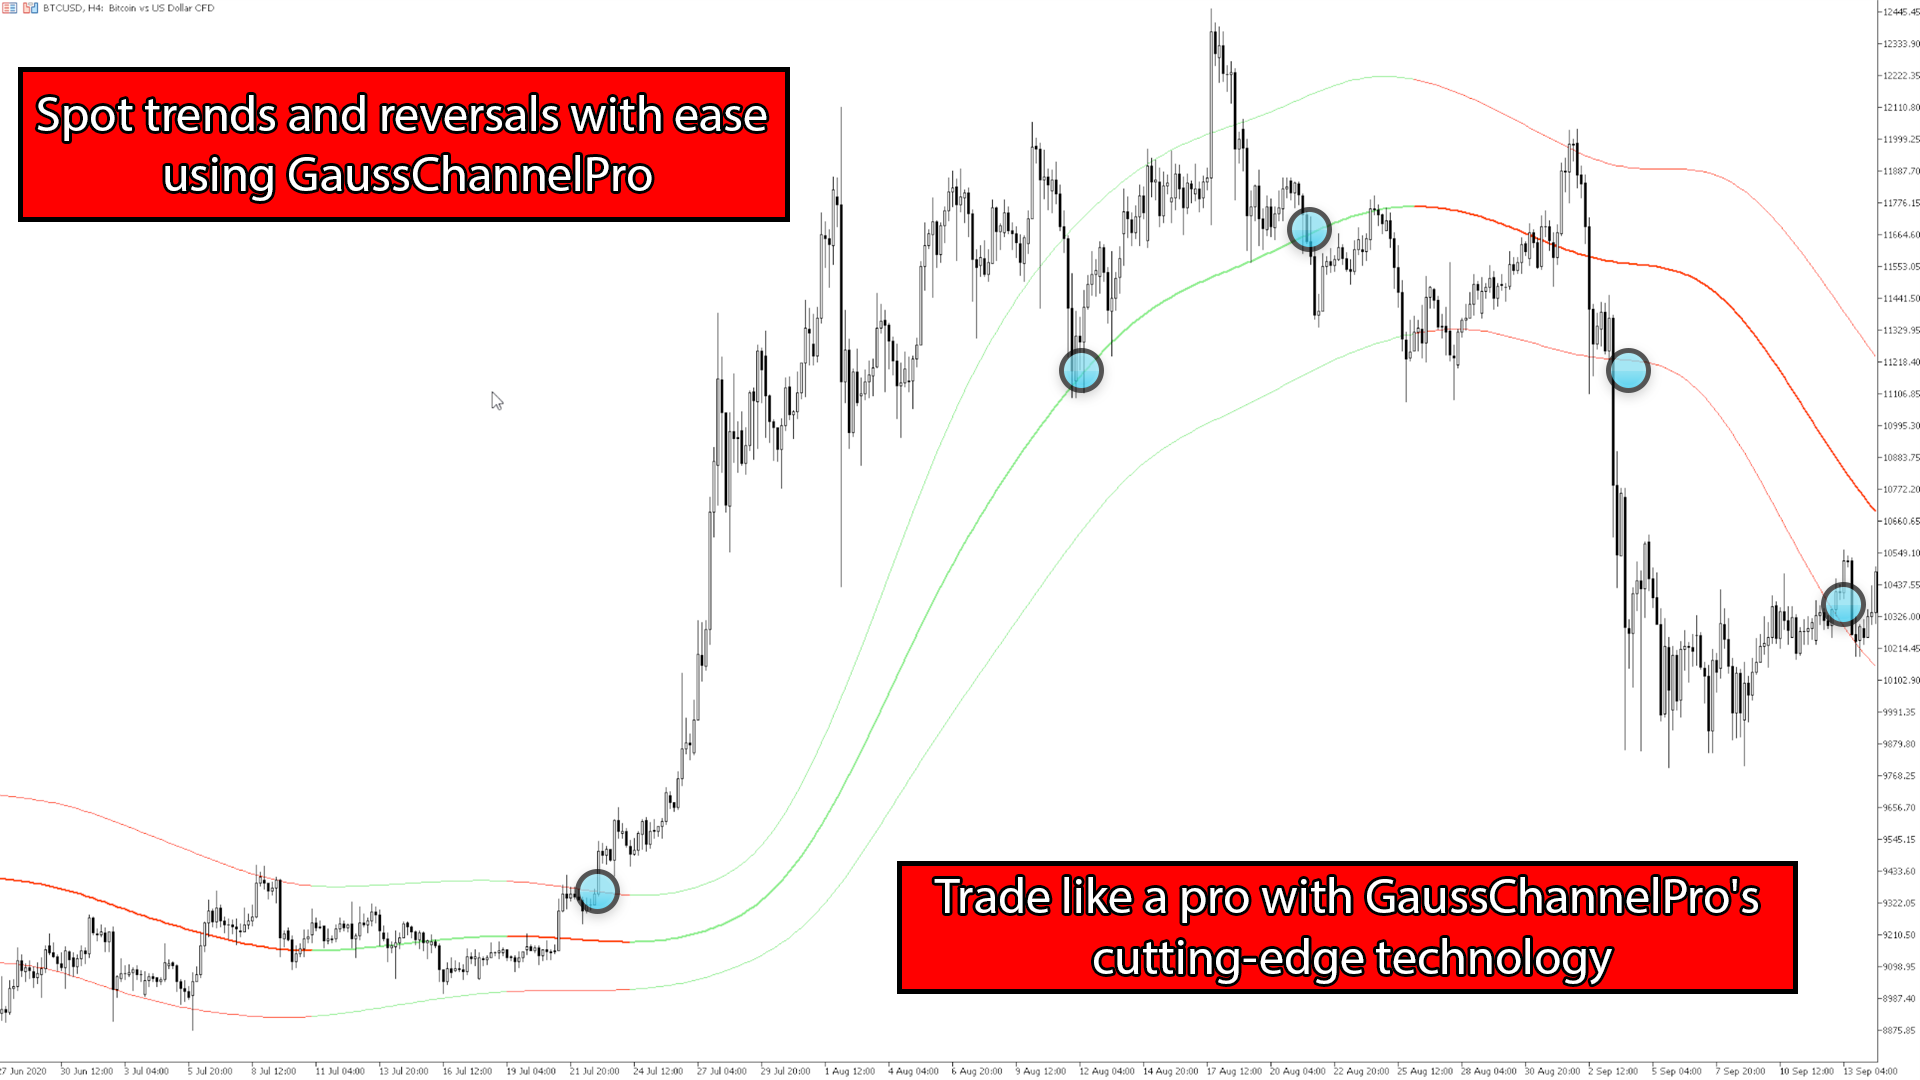
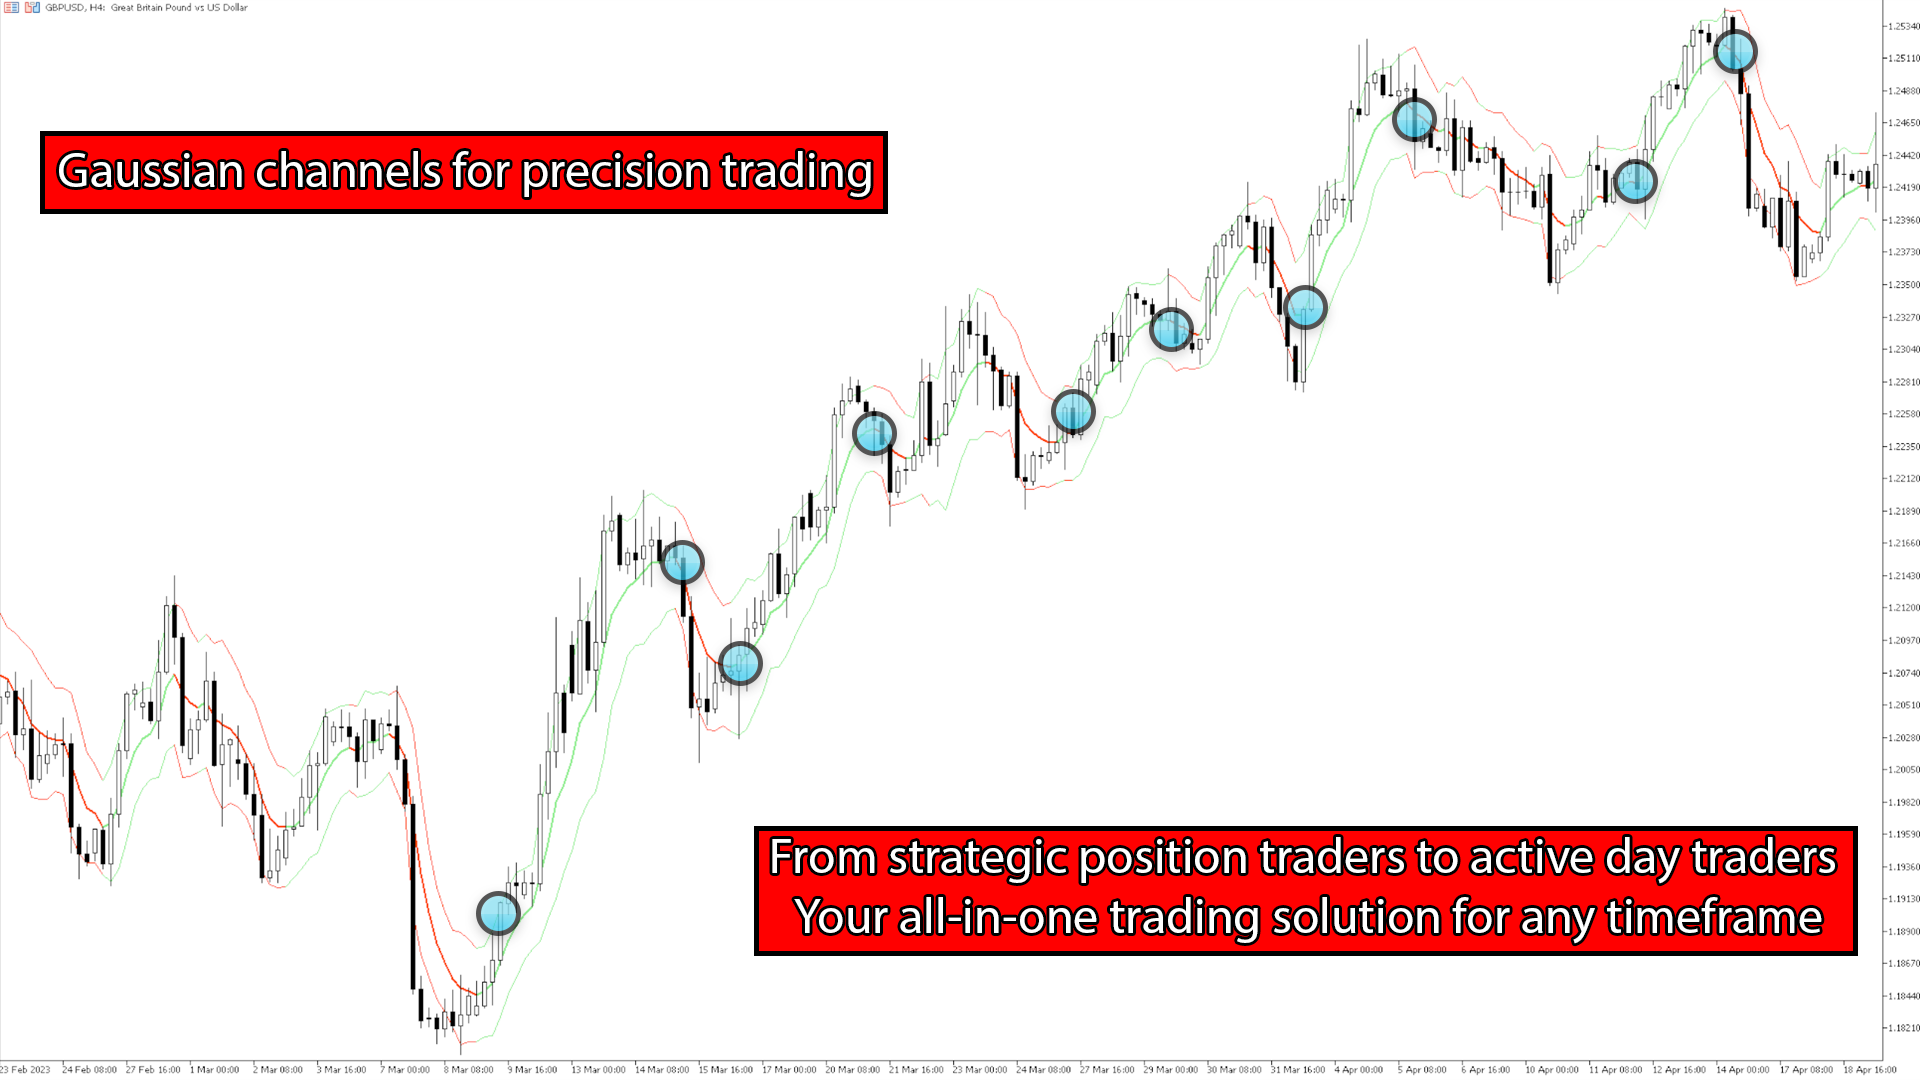
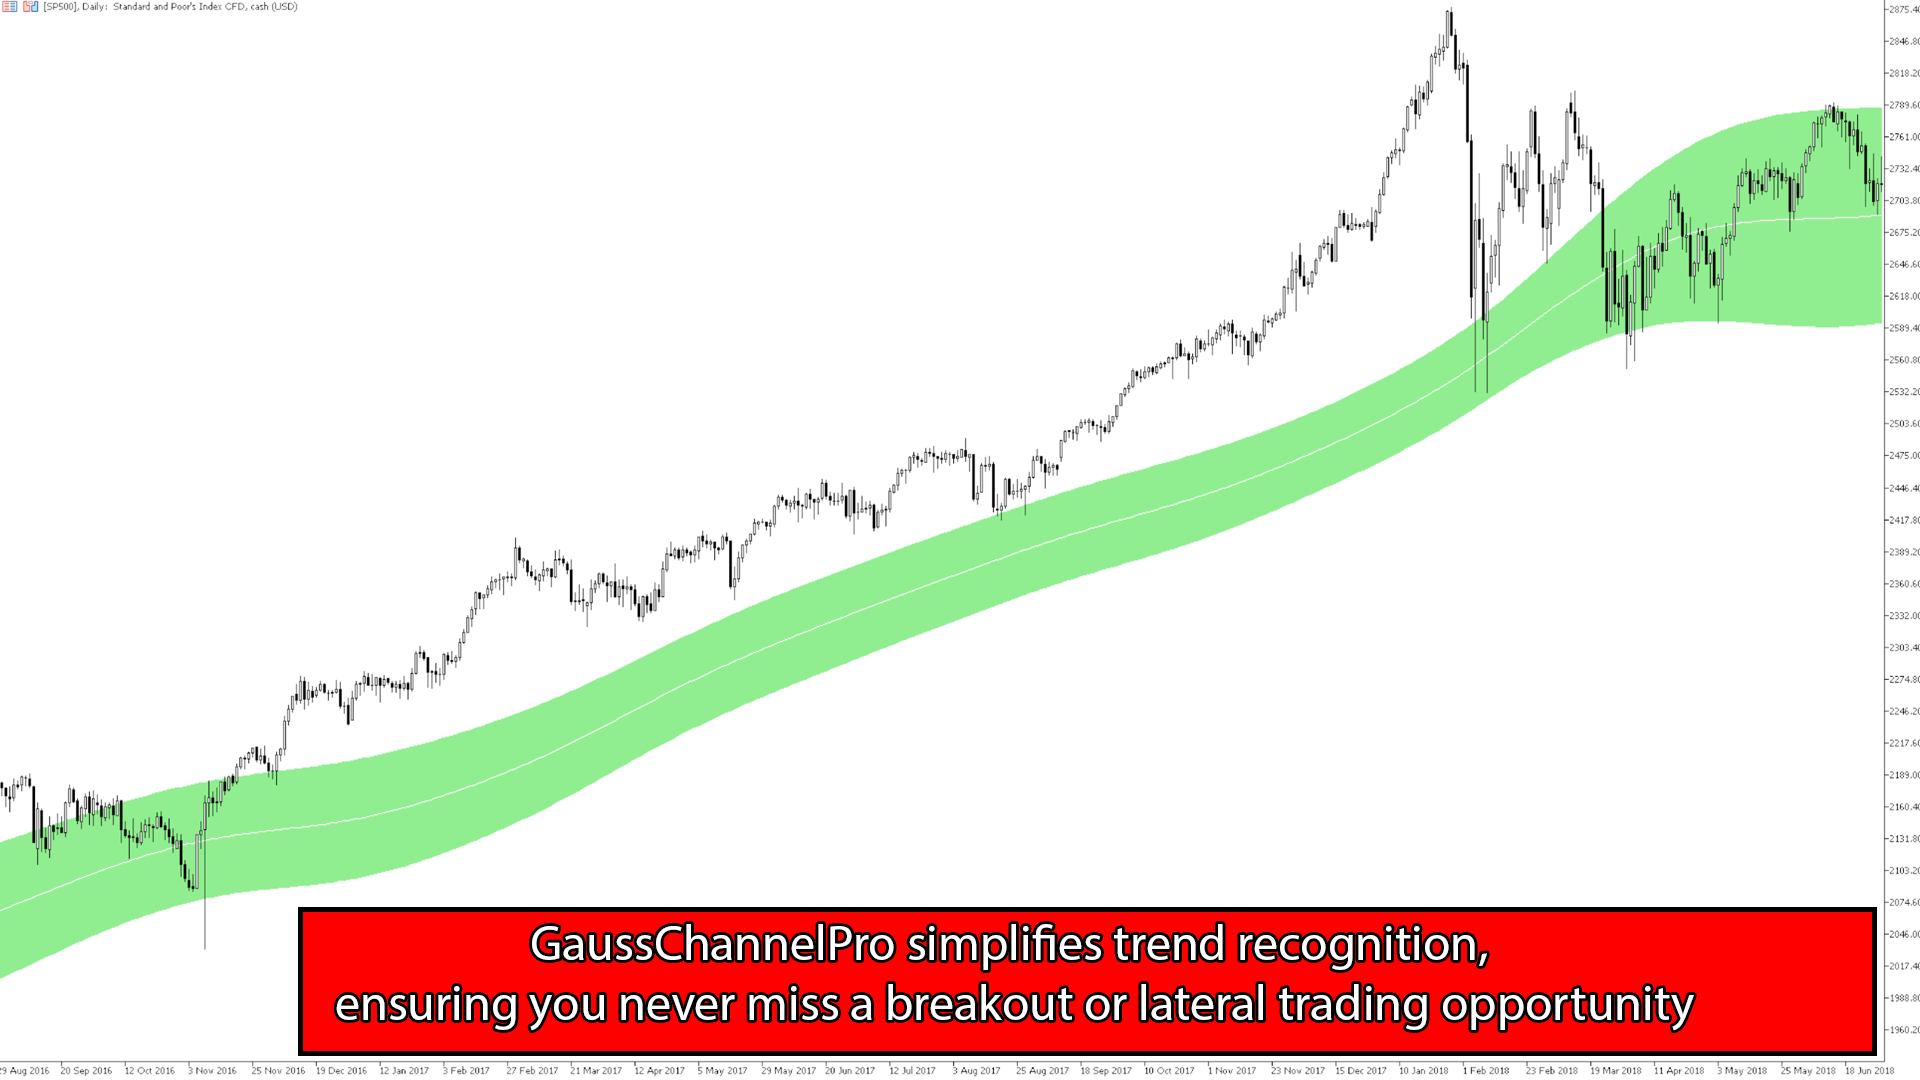
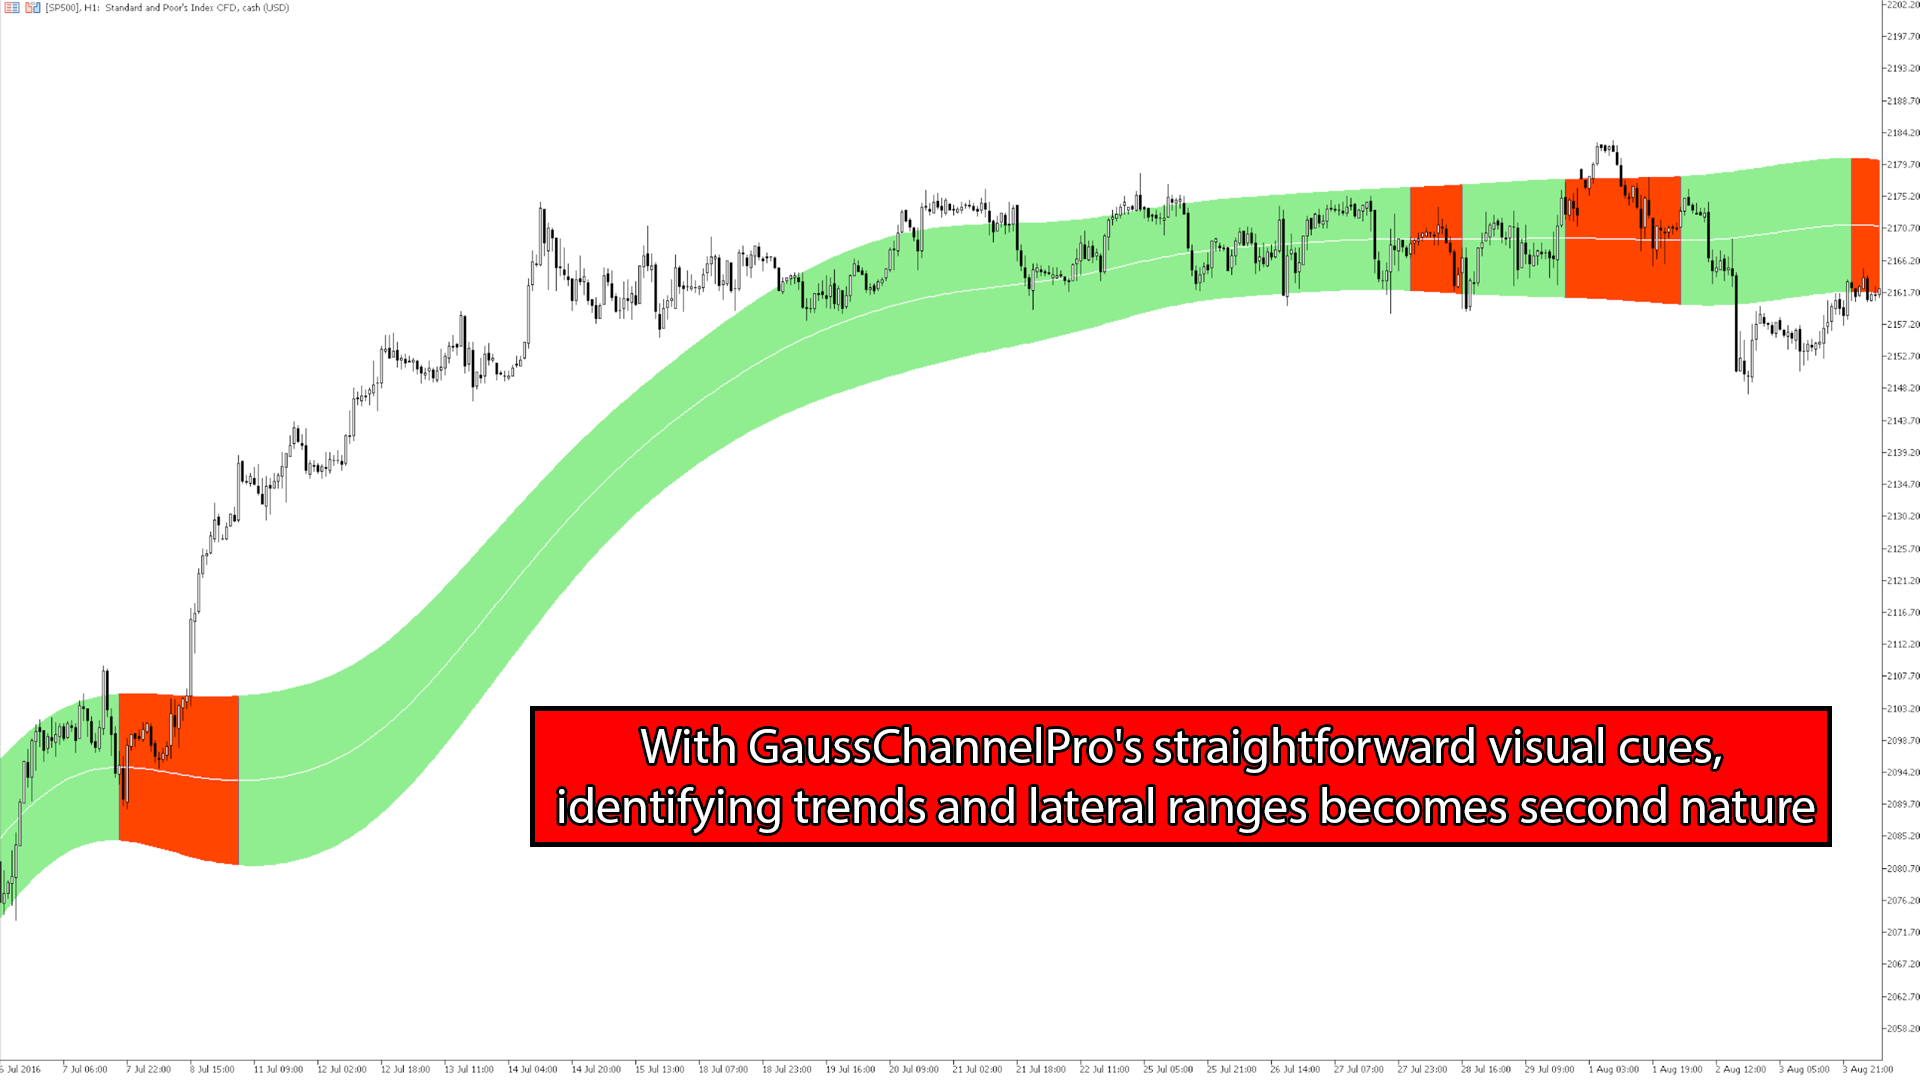
GaussChannelPro is a powerful and innovative trading indicator designed to enhance your trading strategy with the precision of Gaussian-based channels. Leveraging the principles of Gaussian (normal) distribution, this indicator creates a unique channel on your price chart, offering valuable insights into market trends and potential turning points.
Utilizing advanced statistical analysis, GaussChannelPro calculates the optimal channel boundaries based on historical price data, presenting you with clear upper and lower limits that encapsulate the price movements within a chosen timeframe. This channel's dynamic nature allows you to visualize and analyze price volatility and potential breakouts with ease.
The GaussChannelPro indicator is accessible to traders of all levels, from novices to seasoned professionals. Whether you are a trend follower, swing trader, or looking for breakout opportunities, GaussChannelPro caters to a diverse range of trading styles.
Benefits of using the GaussChannelPro Indicator:
- Gaussian Precision
Benefit from the accuracy of Gaussian distribution statistics to identify potential market trends and reversals. - Dynamic Channe
The channel adapts to changing market conditions, providing real-time insights into price volatility. - Versatility
Seamlessly integrate GaussChannelPro into your existing trading strategy or use it as a standalone tool for market analysis. - Customizable Parameters
Tailor the indicator's settings to align with your specific trading preferences and timeframes. - Clear Trading Signals
Receive clear buy and sell signals when price action breaches the channel boundaries, empowering you to make informed decisions. - Comprehensive Support
Access detailed documentation and expert support to maximize your trading experience with GaussChannelPro.