Easy ICT Price Action For MT5
- インディケータ
- Han Qin Lin
- バージョン: 7.8
- アップデート済み: 9 3月 2024
- アクティベーション: 10
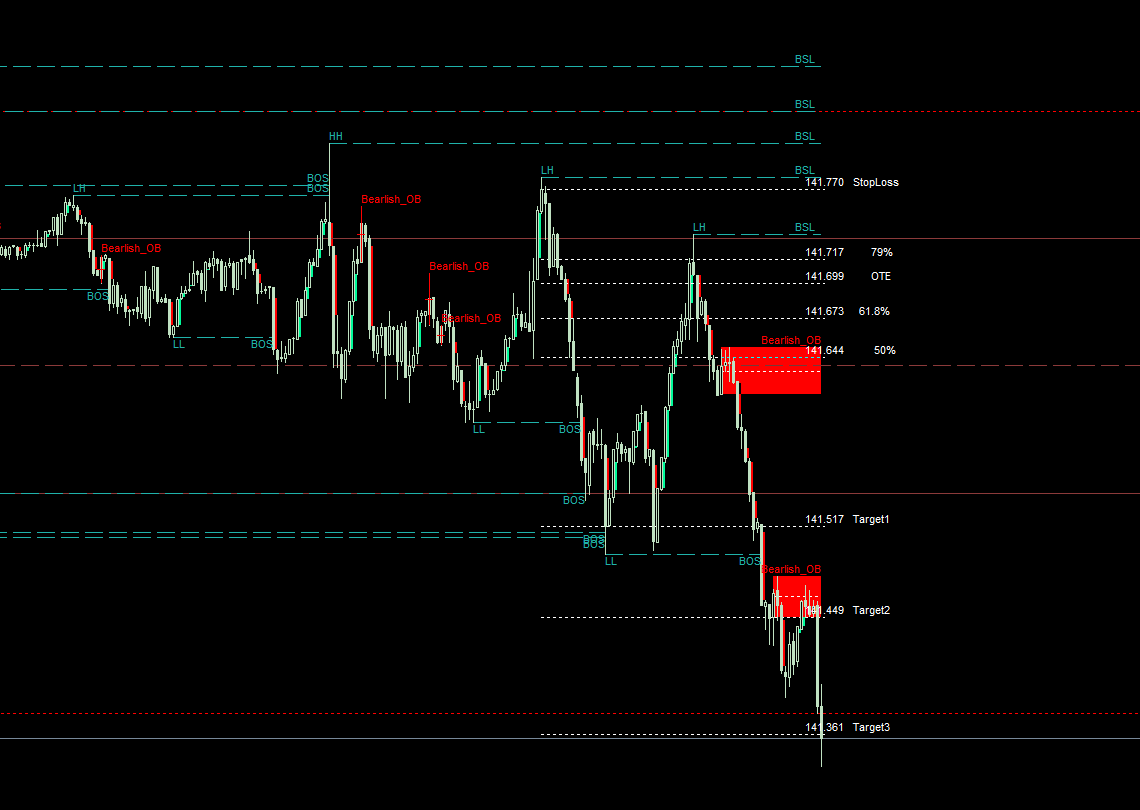
ICT(情報通信技術)、SMC(スマートマネーコンセプト)、サポートとレジスタンス、トレンド分析、価格アクション、市場構造、オーダーブロック、ブレーカーブロック、モメンタムシフト、強い不均衡、HH/LL/HL/LH、公正な価値ギャップ、FVG、プレミアム&ディスカウントゾーン、フィボナッチリトレースメント、OTE、バイサイド流動性、セルサイド流動性、流動性の空白、市場セッション、NDOG、NWOG、シルバーバレット、ICTテンプレート
金融市場では、正確な市場分析は投資家にとって重要です。市場のトレンドや流動性をより良く理解するために、高度な市場分析のためのユーザーマニュアルを提供しています。以下は、いくつかの機能とその実装方法の簡単な紹介です:
1. 高時間枠の市場構造の表示:
パラメータを設定することで、チャート上に高時間枠の市場構造を表示することができます。これにより、全体的な市場のトレンドと構造をより良く理解することができます。必要に応じて時間枠をカスタマイズし、市場構造をチャート上に表示することができます。
2. 流動性の表示:
流動性は市場で重要な指標の一つです。パラメータを設定することで、買い手と売り手の流動性をチャート上に表示することができます。テキストや色をカスタマイズして、異なるレベルの流動性をより良く識別することができます。また、ロンドンAMセッションとニューヨークランチタイムに流動性を表示するかどうかを選択することもできます。
3. フェアバリューギャップの表示:
フェアバリューギャップとは、市場価格と公正価値の差を指します。パラメータを設定することで、チャート上にフェアバリューギャップを表示し、上昇または下降しているかを異なる色で示すことができます。これにより、市場の供給と需要の関係をより良く理解することができます。
4. ロンドンAMセッションの表示:
ロンドンAMセッションは外国為替市場で重要な時間帯です。パラメータを設定することで、チャート上にロンドンAMセッションの時間範囲を表示し、背景色や線のスタイルをカスタマイズすることができます。これにより、ロンドン市場の特徴とトレンドをより良く把握することができます。
5. ニューヨークオープニングタイムの表示:
ニューヨークオープニングタイムは外国為替市場でのもう一つの重要な時間ポイントです。パラメータを設定することで、チャート上にニューヨークオープニングタイムを表示し、色や線のスタイルをカスタマイズすることができます。これにより、ニューヨーク市場のオープニング状況をより良く理解することができます。
6. オープニングレンジギャップの表示:
オープニングレンジギャップとは、市場のオープニング価格と前日の終値との差を指します。パラメータを設定することで、チャート上にオープニングレンジギャップを表示し、識別のために色をカスタマイズすることができます。これにより、市場のオープニング状況をより良く理解することができます。
7. シルバーバレットタイムの表示:
シルバーバレットタイムは市場の特別な時間ポイントを指します。パラメータを設定することで、チャート上にシルバーバレットタイムを表示し、識別のために色をカスタマイズすることができます。これにより、市場の重要な機会をより良く把握することができます。
8. ニューヨークAMセッションの表示:
ニューヨークAMセッションは外国為替市場でのもう一つの重要な時間帯です。パラメータを設定することで、チャート上にニューヨークAMセッションの時間範囲を表示し、背景色や線のスタイルをカスタマイズすることができます。これにより、ニューヨーク市場の特徴とトレンドをより良く把握することができます。
9. ニューヨークPMセッションの表示:
ニューヨークPMセッションは外国為替市場でのもう一つの重要な時間帯です。パラメータを設定することで、チャート上にニューヨークPMセッションの時間範囲を表示し、背景色や線のスタイルをカスタマイズすることができます。これにより、ニューヨーク市場の特徴とトレンドをより良く把握することができます。
10. 前日/週/月の高値/安値レベルの表示:
パラメータを設定することで、チャート上に前日、週、月の高値と安値レベルを表示することができます。これにより、市場の価格トレンドと重要なレベルをより良く理解することができます。
これらは、当社の高度な市場分析の一部の機能と実装方法です。パラメータを調整し、コードスニペットをコードに追加して、必要な機能を実現することができます。このユーザーマニュアルが市場の分析と意思決定に役立つことを願っています。投資に成功をお祈りします!


Super Bien