Polynom Moving and Channel
- インディケータ
- BeeXXI Corporation
- バージョン: 1.6
- アップデート済み: 29 3月 2023
- アクティベーション: 5
The use of a polynomial expansion of data opens up new possibilities for analysis and decision making. But the problem of all existing algorithms is a very slow computation.
The main feature of this indicator is its fast algorithm. The speed of calculation of the polynomial algorithm and its standard deviation values is several thousand times faster than conventional algorithms. So this is a convenient algorithm for use without the need to apply supercomputers.
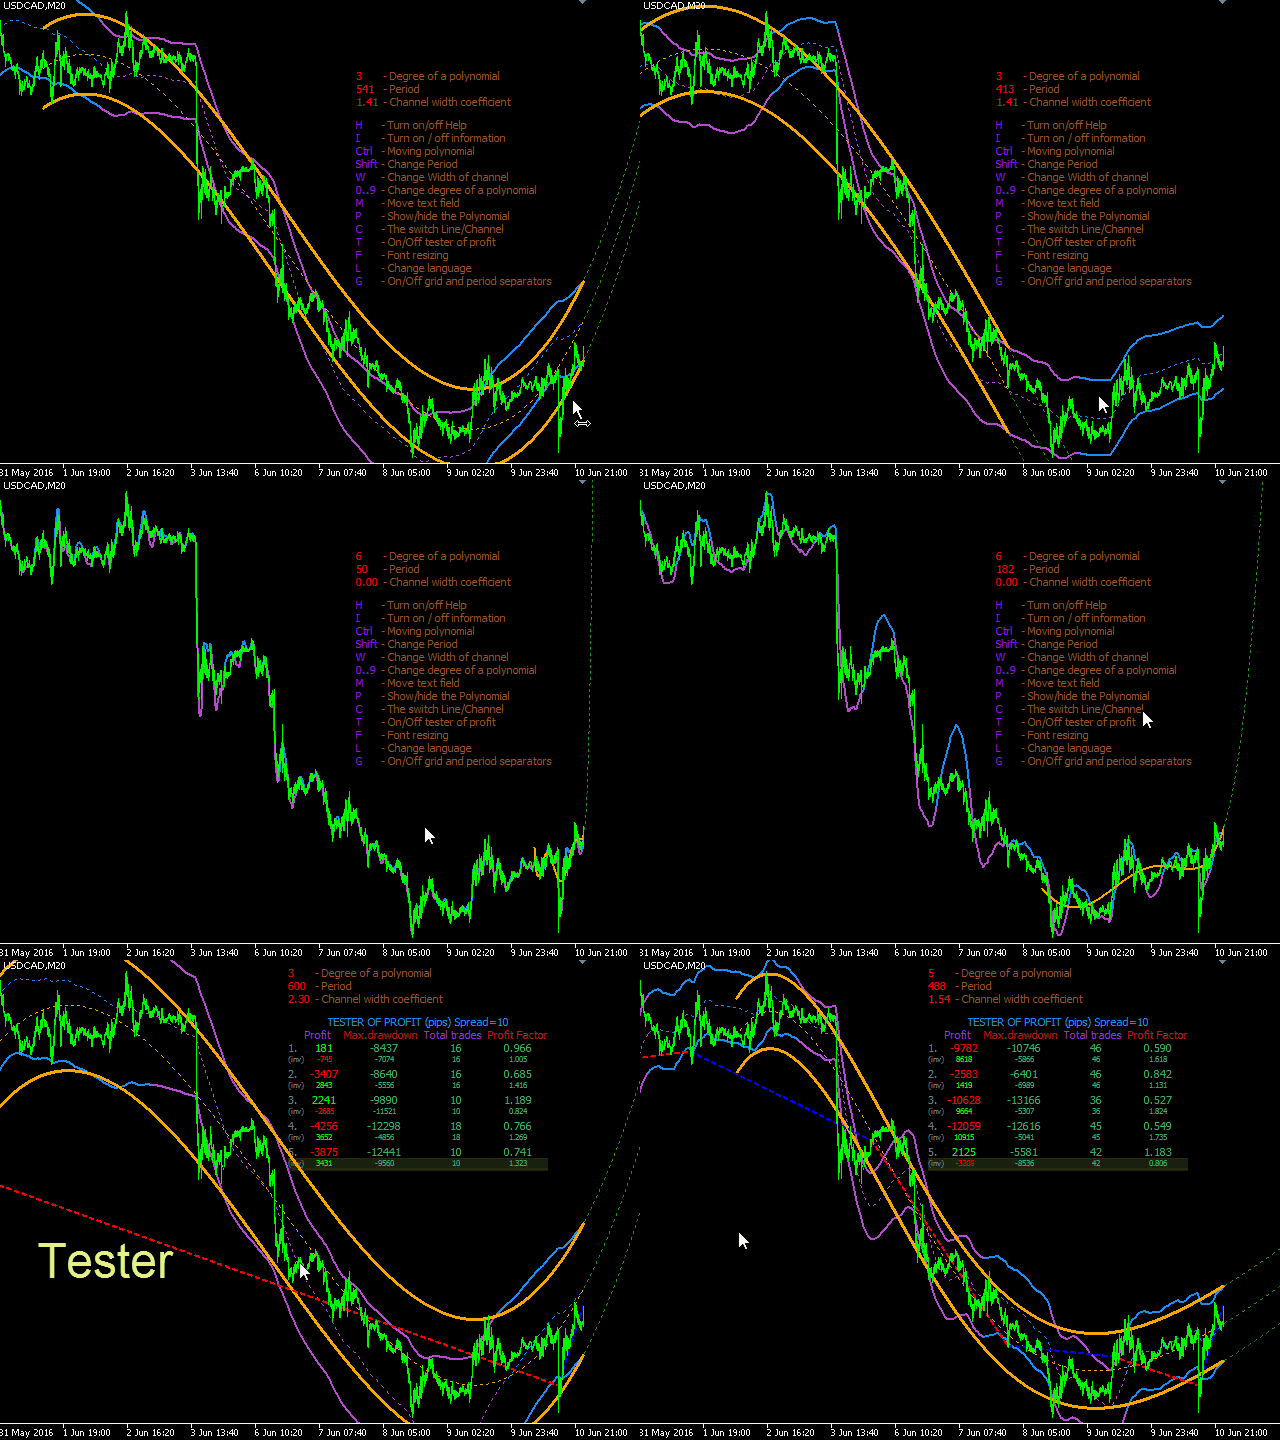
Also, starting from version 1.4 the indicator provides a built-in strategy tester with trade visualization and simultaneous calculation of profit (in pips), of maximal drawdown (in pips), of the total number of trades and the Profit Factor (total profit/total loss), and display of this data as a table. 10 strategy examples are available: 5 channel and 5 non-channel, as well as their inverse strategies (Sell and Buy are reversed). The Tester features can be further expanded by applying the indicator to another indicator, e.g. RSI. In order to access the tester, press "T" (Tester). In order to select a strategy, hover the mouse pointer on the strategy information line. A brief description of the strategy is displayed in the popup menu. You can switch between channel and non-channel strategies by pressing on "C" (Channel). Further we plan to add a simple visual strategy constructor, which allows to create custom strategies straight from the indicator window.
Another notable feature is the ability to configure parameters from the indicator window using the key and the mouse. This method is more intuitive, fast and easy. Press "H" (Help) for hot key tips, as well as watch the attached video.
Language support has been added (8 languages), to be improved and expanded further. You can select a language from the properties window or by pressing "L" (Language).
Indicator lines
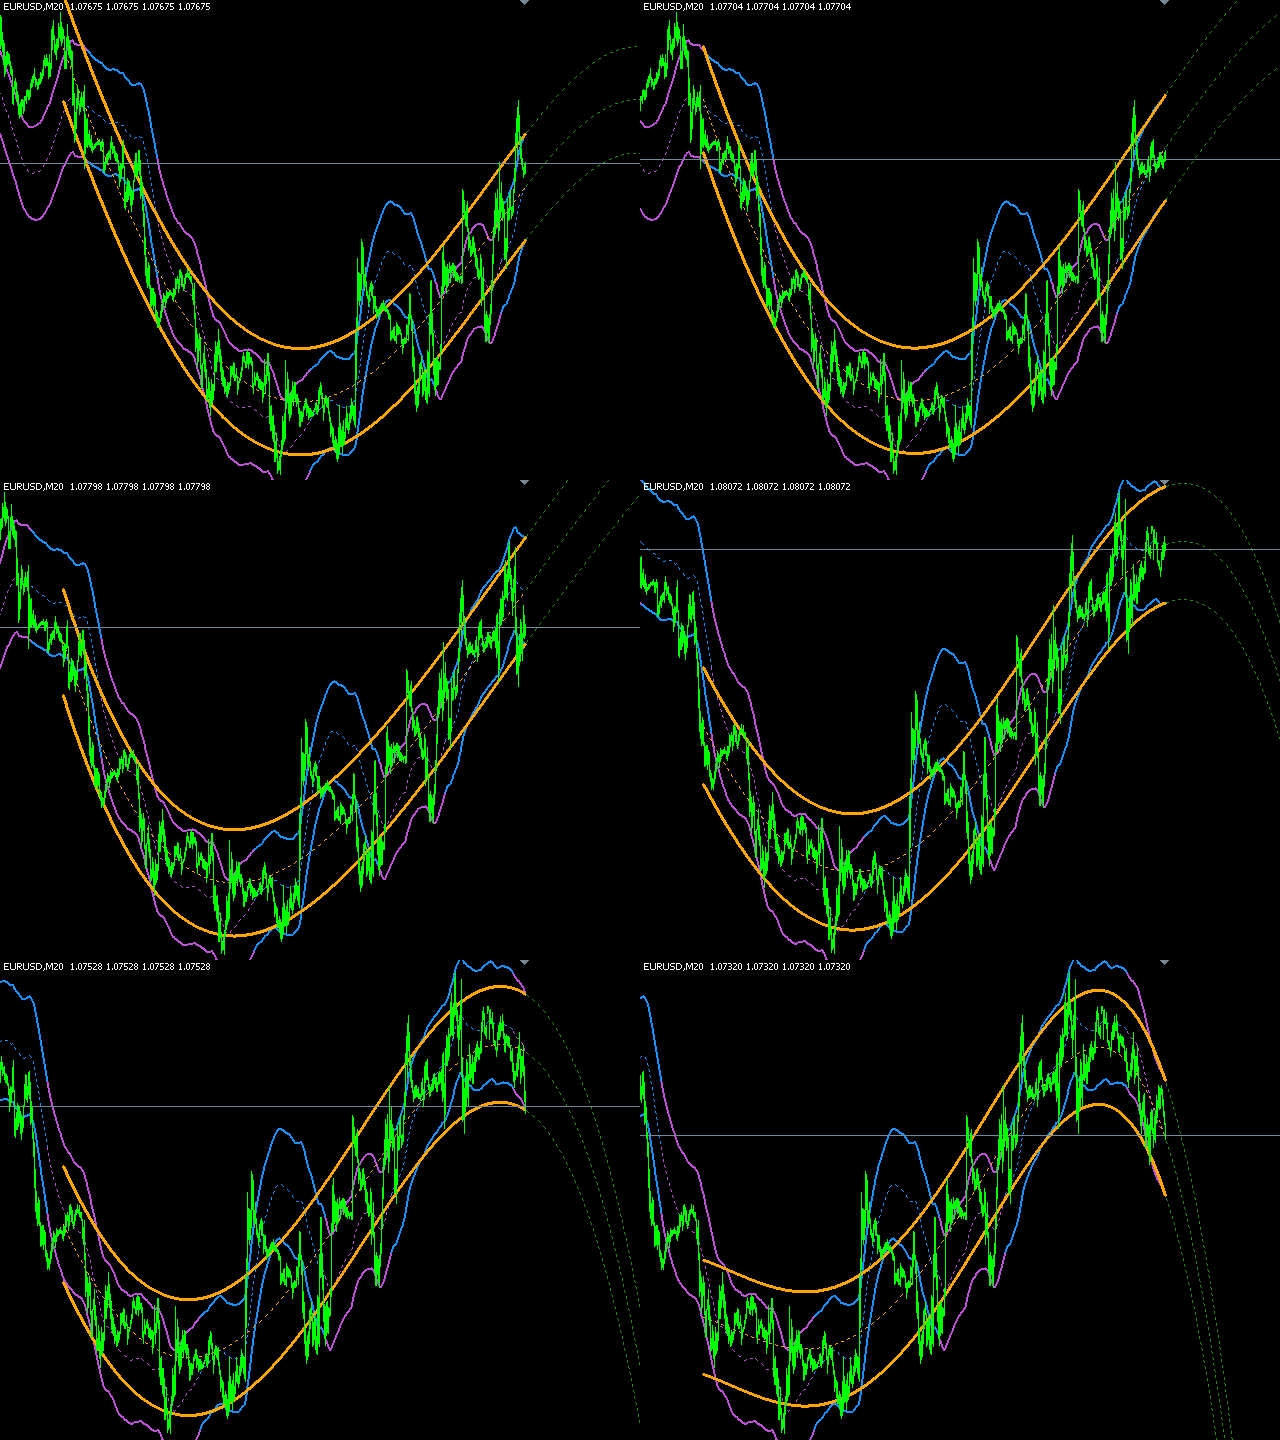
- Yellow lines - redrawn with every tick of the polynomial channel. Green dashed lines - the polynomial extrapolation into the future.
- Two-color lines - non-redrawing channel, traces of a yellow polynomial Yellow. The line is blue when the polynomial lines are directed upwards, purple - when downwards.
- Red line - Sell, blue line - Buy. Displayed when the Tester is switched on.
Indicator Parameters
- Select Language - language selection
- Degree of a polynomial - 0 to 20.
- 0 - simple МА (Bollinger Bands channel)
- 1 - linear regression
- 2 - non-linear regression without inflection points (arc)
- 3 - non-linear regression with one inflection point (wave)
- etc.
- Number of bars for the calculation (period) .
- Width of the channel, 0-no channel, 1-width=standard deviation:
- 0 - not to draw a channel
- 1 - the channel width is equal to the standard deviation of the polynomial
- Bars to extrapolate in the future
- Show Polynom? - show/hide polynomial.
- Spread for Tester. - choose spread value to test.
The degree of a polynomial is limited to 20. as increase in their number causes the problem of lower precision and overflow of the maximum value of type double, inasmuch as its maximum value is 1.7976931348623158e+308, and accuracy is 15 meaningful digits after the decimal point. The higher the Degree of polynomial and its Period, the higher the probability of overflow and the indicator will fail to perform calculations or its data will be incorrect. This problem can be easily solved through the use of special highly precise libraries with dll. But that's another story, and I'm not sure if you need this. To my mind it will be enough to use the indicator with the polynomial degree below 10. I recommend not to exceed this value, because its may significantly reduce the indicator performance speed.
PS: This indicator was initially developed for MQL5, and its exact copy for MetaTrader 5 is available in the Market. The attached video has been made on the basis of the MetaTrader 5 platform. It operates the same way on MetaTrader 4. The only differences are that, unfortunately, the MetaTrader 4 does not allow to plot the indicator on the basis of other indicators as it is shown in the video on the example of RSI. Also, the MetaTrader 5 implements saving of parameters changed in the window when switching timeframes. Also, the same code runs significantly faster on MetaTrader 5. But I have not retaken the video for MetaTrader 4, as I suppose it to be useful to know features of MetaTrader 5. So I recommend everyone to start working on MetaTrader 5.


I really like this! It's very useful. I will eventually get the Fast Polynomial because the update looks like it allows the settings to be kept when you change time frames. It's a pain changing them every time. I still love it. I have a version made by someone else on my phone and computer but it's not as good as this one even though it has buy and sell signals. It's exactly what I was looking for. Thanks!