Trend Sensor MT5
- インディケータ
- Yuriy Lyachshenko
- バージョン: 1.30
- アップデート済み: 20 11月 2023
- アクティベーション: 5
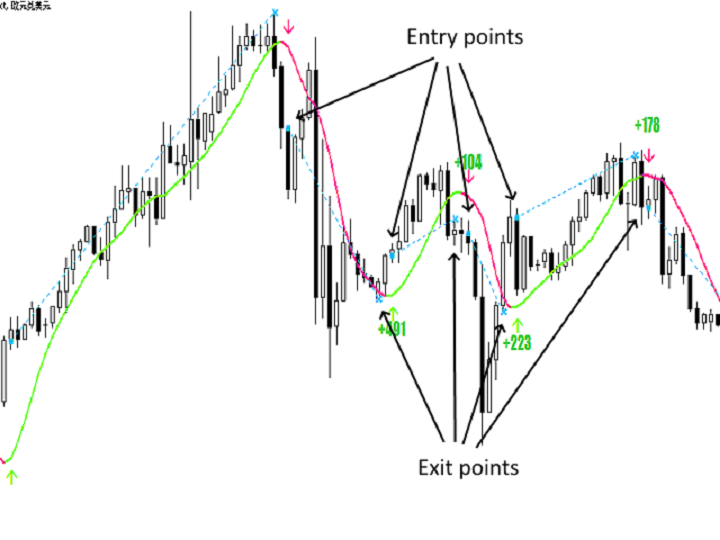
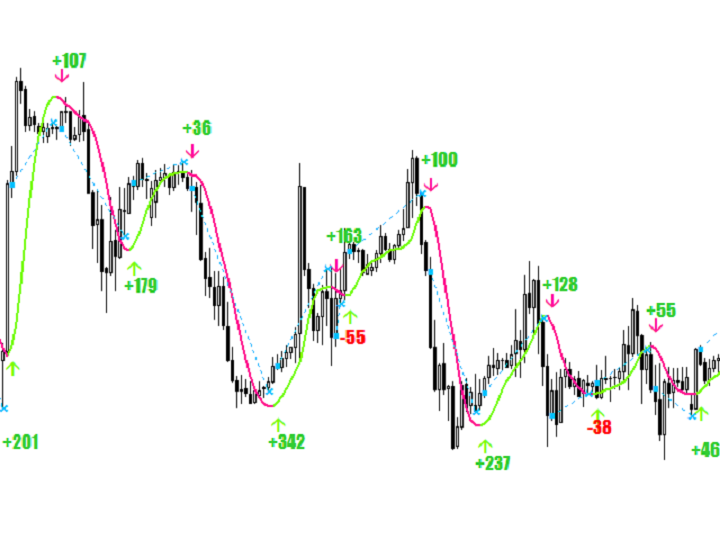
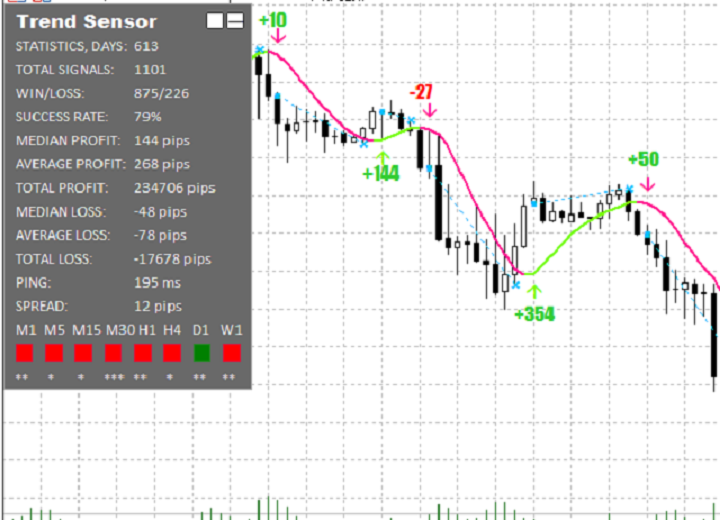
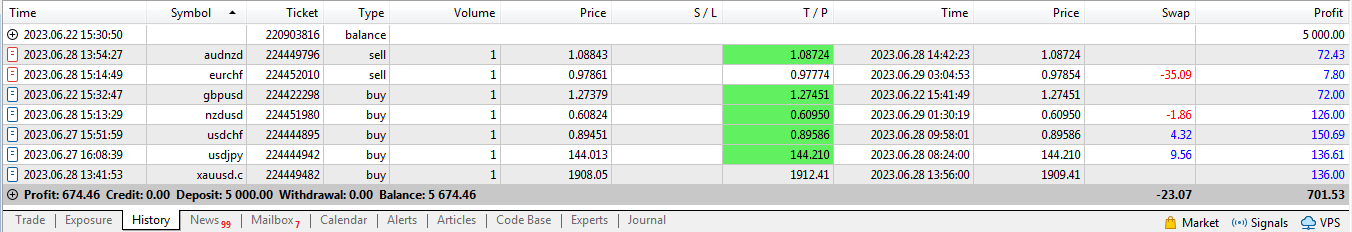
このインジケーターは、最も適切なエントリーとエグジットポイントを表示します。また、取引をよりよく分析するために、すべてのシグナルの統計データを表示します。
このインジケーターを使うことで、市場をより深く理解することができるようになります。
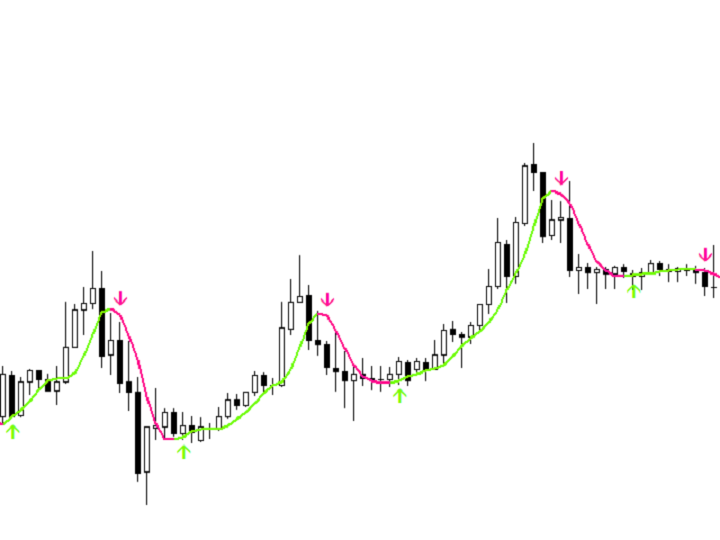
トレンドの力が弱まり始めると(パネルに表示されます)、トレンドラインは水平位置に引き寄せられ、これは取引を終了するシグナルです。または、平均/中央の利益水準に達したときに終了することもできます。
このインジケーターは、2010年からの私の取引経験の結果です。
特徴
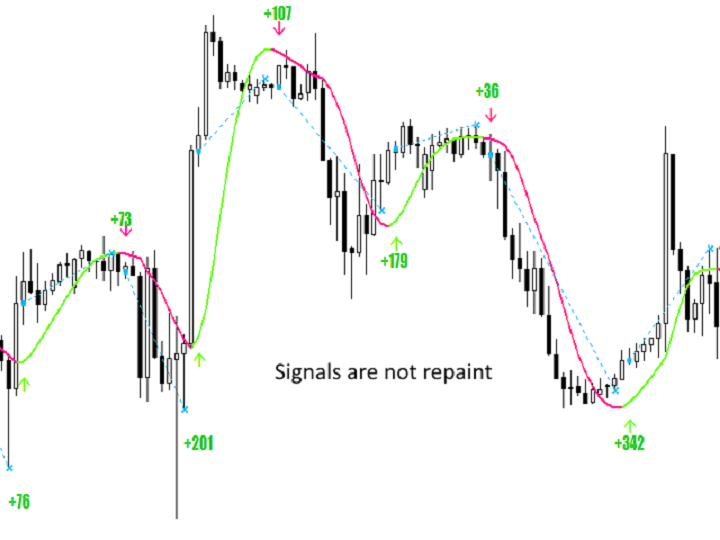
- このインジケーターは再描画しません。ヒストリカルチャートに表示されているものは、リアルタイムでも表示されます。
- 暗号通貨、株式、金属、指数、商品、通貨など、あらゆる資産の取引に使用できる。
- すべてのタイムフレームで動作します。
- エントリーするためのシグナルは、新しいローソク足のオープニングで表示されます。
- 取引終了のシグナルは暫定的に表示され、より大きな利益で取引を終了できることが多いからです。
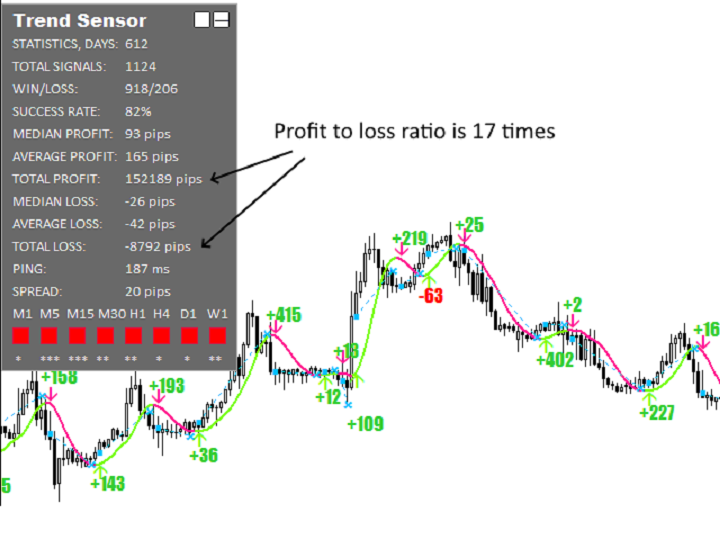
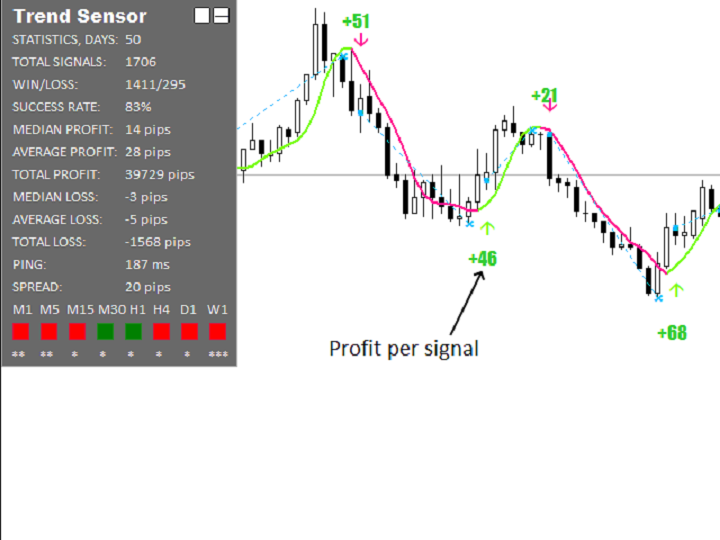
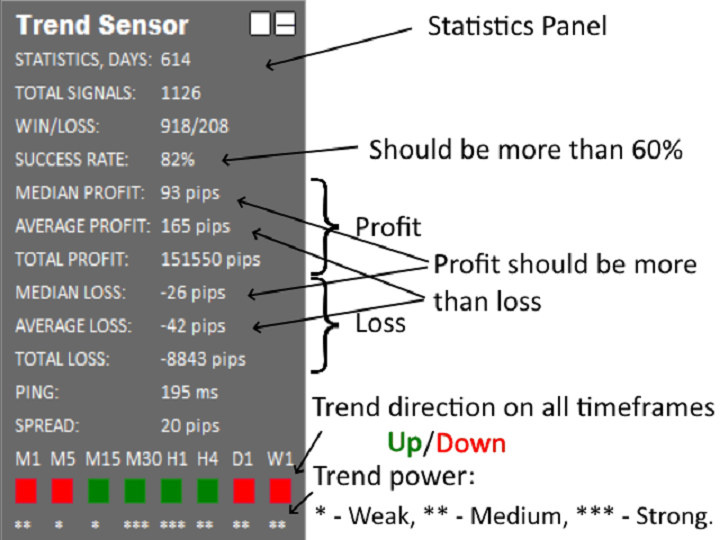
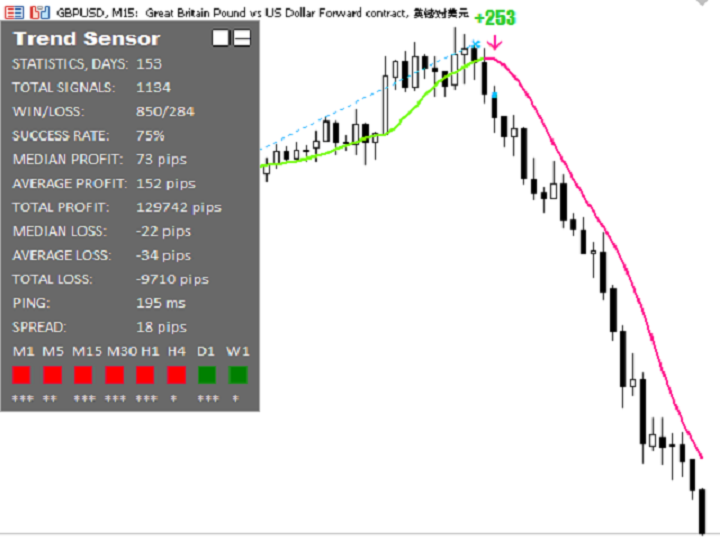
- 左上には、取引統計の詳細パネルがあり、最小化することができます。
- M1からW1までのタイムフレームで、トレンドの方向とそのパワーを一度に表示します。
- 軽量なコードを使用しているため、読み込みがなく、端末を遅くすることはありません。
- トレンドの方向を決定する移動平均線の計算には、特別な計算式を使用しています。
- 取引開始のシグナルを見逃さないために、アラートウィンドウとプッシュ通知で通知を受け取ることができます。
- 初心者から上級者まで、あらゆるレベルのユーザー向けです。
統計パネル
- シグナル履歴の取得日数。
- 統計の対象となるシグナルの総数。
- 利益シグナルと損失シグナルの数の比率。
- 収益性の高いシグナルの総量に占める割合。
- 1シグナルあたりの利益の中央値。
- 信号ごとの平均利益。
- すべてのシグナルの利益の合計。
- 1シグナルあたりの損失額の中央値
- 1シグナルあたりの平均損失額
- 全シグナルの合計損失額
- ブローカーのサーバーへの最後のping。
- 現在のスプレッド
- M1からW1までのタイムフレームにおけるトレンドの方向性。
- トレンドの強さを測定します: * 弱い ** 中規模 *** 強い。
パラメータ
| Trading style | アグレッシブ 中程度 安全 (インジケーターの感度、感度が高いほど多くのシグナルが出る) |
| Working hours | 市場に参入するためのシグナルが表示される時間帯を指定します。 (時間形式は xx:xx-xx:xx とする。例:00:00-23:59) |
| Show statistics | オン/オフ チャートの左上隅にシグナルの統計パネルを表示する。 |
| Show line | オン/オフ トレンドラインを表示する |
| Show arrows | オン/オフ トレンドが変化したときに矢印を表示する |
| Show entry/exit | オン/オフ エントリーポイント、エグジットポイントを表示 |
| Use alert notification | オン/オフ ポップアップウィンドウで通知、サウンドで通知 |
| Use push notification | オン/オフ プッシュ通知 |