YouTubeにあるマーケットチュートリアルビデオをご覧ください
ロボットや指標を購入する
仮想ホスティングで
EAを実行
EAを実行
ロボットや指標を購入前にテストする
マーケットで収入を得る
販売のためにプロダクトをプレゼンテーションする方法
MetaTrader 5版新取引ユーティリティ - 14

Introducing Mini Orders Executor , your powerful and efficient trading companion designed to seamlessly execute orders directly from a user-specified text file . This innovative trading tool streamlines your trading process, providing a convenient and automated solution for executing trades with precision and speed.
Key Features :
**Text File Integration:** Mini Orders Executor is designed to effortlessly read and interpret orders from a plain text file, eliminating the need
FREE

Discover a New Wave Trading Strategy - Suitable for Currency Pairs like AUDUSD.s Strategy Highlights : Specially Designed Trend Indicator Graphics : Our strategy offers a unique graphical interface to help traders identify and capitalize on market fluctuations. Backtesting Validation : Traders are encouraged to backtest currency pairs like AUDUSD.s to validate the effectiveness of our strategy. Flexible Time Frames : Default recommendation is to trade in the 15-minute (M15) time frame,
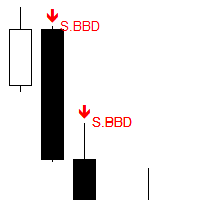
Works on live charts and strategy tester. Scans the charts for the following candlestick patterns
SINGLE Hammer formation PB Doji BB Doji Black Crow : Displacement/Momentum DOUBLE Engulfing: This formation completely engulfs the high/low of the previous candlestick. Ws Hidden :This reversal formation would appear as a double top/bottom on the lower timeframe. Ws Regular TRIPLE Morning/Evening Star
FREE

The program is use to copy trading from MT5 to MT4 and MT5 on local PC or copy over the Internet . Now you can easy copy trades to any where or share to friends. Only run one Flash Server on VPS, also need allow the apps if you turn on Windows Firewall. Can not add more than 20 account copier to server at same time, include both MT4 and MT5 Get free Copier EA for MT4 and MT5 (only receive signal), download here Instants copy, speed smaller 0.1 seconds, easy to setup How to setup and guide

The EA supports closing orders based on the preset amount. It can close all orders on all pairs, or it can close orders based on Magic ID. Button "Close All" manual Input - Magic Number: Magic Number = 0: Close All pairs Magic Number diffrent 0: Close All with Magic - Money TP: Profitable in money. the EA will close all orders - Money SL: Loss in money. the EA will close all orders Contact: t.me/nguyenvanbo128
FREE
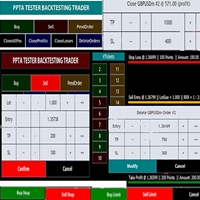
TESTER BACK TESTING AND TRADING MANAGER THE ONLY MT5 TOOL YOU CAN USE FOR BOTH LIVE TRADING AND BACKTESTING All functions can be used in both live trading and backtesting in MT5 Strategy Tester. This is one tool with many functionalities. Your ONLY tool for both trade management (live trading) and Backtesting in MQL5 Strategy Tester. The Tester Backtesting and Trading Manager can help you: 1. Trade Orders: a. Open Market Execution Orders (Buy or Sell)
b. Open Pending Orders (Buy Limit, Buy Stop

KopierMaschine - локальный копировщик сделок между различными счетами MetaTrader 4 и MetaTrader 5 в любом направлении расположенных на одном компьютере с интуитивно понятным интерфейсом.
Направления копирования: MT4 --> MT5 MT4 --> MT4 MT5 --> MT5 MT5 --> MT4 для копирования между терминалами MetaTrader 4 и MetaTrader 5 необходимо приобрести версию продукта KopierMaschine для MetaTrader 4 Особенности
Программа работает в двух режимах Master и Slave На один подчиненный счет можно копир

注意 :このエキスパートアドバイザーはストラテジーテスターでは動作しません。試用版をご希望の方は、私のプロフィールをご覧ください。
取扱説明書 自動ジャーナルをダウンロードするには、私のプロフィールをご覧ください RiskGuard Management – プロフェッショナルトレーディング、妥協なし RiskGuard Management は、利益を最大化し損失を最小限に抑えるために高度なリスク管理を活用したいすべてのトレーダーにとって、究極のパートナーです。ただのツールではなく、トレーディングプランの遵守、感情的なミスの回避、最大限の効率での運用をサポートする インテリジェントなシステム です。 資金を完全に保護 ロットサイズを動的に計算する高度なリスク管理 毎日のトレードプランに従って自動でポジションをクローズ 各取引のリスクを最適化するQuantumテクノロジー データのエクスポートと自動ジャーナル機能付きのプロフェッショナルな分析とレポート Quantum:トレーディングの常識を変える革新機能 Quantumはあなたのトレーディング統計と現在のドローダウンを分析し、各トレ

MT5用バイナンス取引ツール
1. この製品には、WebSocket からのライブ チャート、履歴チャート、
mt5ターミナルの再起動時に自動更新され、手動介入なしでスムーズに動作し、バイナンスをスムーズに取引できるようになります。
スポットと先物で利用可能な取引、ライブチャート、履歴データ
使い方 :
1. このユーティリティの入力フィールドに API キーとシークレットを追加する必要があります。 API を作成するときは、必ず先物取引を有効にしてください。
3. [ツール] > [オプション] > [URL からの Web リクエストを許可] タブで説明されているように Binance API URL を追加し、Web リクエストを許可するチェックボックスにチェックを入れる必要があります。
バイナンススポット
URL 1: api.binance.com
URL 2: stream.binance.com
バイナンス先物
URL 1: fapi.binance.com
URL 2: fstream.binance.com
これらの情報をMT5のUtiltiyとWebr

マルチ通貨の前のキャンドルまたは前のバースキャナーは、インジケーター設定から選択したカスタム時間枠でマルチシンボルチャートをスキャンするのに役立ちます。
製品に基づく: https://www.mql5.com/en/market/product/78657
前日の高値安値、前週の高値安値、前月の高値安値、または任意のカスタム時間枠の複数のシンボルをスキャンするために使用できます。 過去4時間チャートの高値安値
ノイズをフィルターし、価格が高値ラインまたは安値ラインに接触したときに方向性のある警告を発します。
戦略はシンプルで、前日、週または月の高値安値に触れると、価格が5分などの短い時間枠で拒否されると見なされます。
さまざまなアラートの種類を選択するオプションがあります
スキャン頻度をミリ秒単位で選択および設定できます
1000 は、相場監視のすべてのシンボルを毎秒スキャンすることを意味します
製品の特徴
1. ターミナルアラート
2.電子メールアラート
3. プッシュ通知
ピボット ポイント マルチ シンボル スキャナーは、フロア、ウッディ、カマリラ、デマーク、またはフィボナッチ ピボット ポイントのマーケットウォッチで利用可能なすべてのシンボルをスキャンします。
任意の時間枠を選択してピボットポイントを計算し、価格がこれらのレベルのサポートとレジスタンスに達したときにアラートを受け取ることができます。
視覚的なピボット ポイントについて この製品に興味があるかもしれません: https://www.mql5.com/en/market/product/110072
さまざまなアラートの種類を選択するオプションがあります
スキャン頻度をミリ秒単位で選択および設定できます
1000 は、相場監視のすべてのシンボルを毎秒スキャンすることを意味します
製品の特徴
1. ターミナルアラート
2.電子メールアラート
3. プッシュ通知

Introducing Orders Executor , your powerful and efficient trading companion designed to seamlessly execute orders directly from a user-specified text file . This innovative trading tool streamlines your trading process, providing a convenient and automated solution for executing trades with precision and speed.
Key Features :
**Text File Integration:** Orders Executor is designed to effortlessly read and interpret orders from a plain text file, eliminating the need for manual input. Simpl

Multi-currency trading on one chart!
Creation and management of positions with trailing and breakeven, risk management and other useful functions. To fix profits, the Target profit parameter is provided; if it is greater than zero, all positions will be closed if the set value is exceeded. All positions and orders have set Stop Loss and Take profit. For multi-currency trading, taking into account the impact of news and switching symbols on the chart, it is useful to use the News impact indicato
The FVG scanner scans the Daily timeframe, the 4-Hour Timeframe and the 1-Hour Timeframe for FVGs and iFVGs in real time and on the strategy Tester. FVG stands for Fair value Gaps, This are said to be areas of market ineffieciency where price would have to return to in the near future Different colors are available for different FVGs. It highlights both the FVG and iFVG
FREE

The Wall Street Player (Master version). This EA tailored as a Discipline, Money and Risk Management tool is a powerful Trade Station utility designed for Forex, Cryptos, Commodities, Shares, Deriv synthetic pairs and any CFDs Market. It is designed to fit your strategy as a winner, and take your Edge of the market to the NEXT-LEVEL. The only thing to do is to get It on your chart and appreciate the possibilities and chart management abilities it has to offer for realizing that discipline and a

The Wall Street Player (Ultimatum version). This EA tailored as a Discipline, Money and Risk Management tool is a powerful Trade Station utility designed for Forex, Cryptos, Commodities, Shares, Deriv synthetic pairs and any CFDs Market. It is designed to fit your strategy as a winner, and take your Edge of the market to the NEXT-LEVEL. The only thing to do is to get It on your chart and appreciate the possibilities and chart management abilities it has to offer for realizing that discipline and

White label available. contact us for more info. dushshantharajkumar@gmail.com
Slides by Chart Walker "Slides" is a MetaTrader 5 (MT5) utility designed to streamline chart navigation by facilitating automatic chart switching. With "Slides," users can preset specific time intervals for chart rotation, enabling automatic transitions between different financial instruments or timeframes. This utility proves invaluable for traders who monitor multiple charts simultaneously, as it optimizes wor
FREE
Free until the end of the year.
Customer support : https://t.me/MeToolTrading
The free version will be published at the end of 2024.
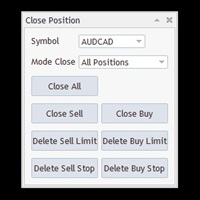
Close All With Just One Click MT4: https://www.mql5.com/en/market/product/110795 Close orders with just one click, quickly and neatly. Supported order types: Market order, limit order, stop order .
Note: This software is very fast, there is no warning every time you press the button, please use caution when using, or use it proficiently in a demo account firs
FREE

Revolutionize Your Trading Experience with Our Advanced Management Panel Maximize efficiency and control with our cutting-edge Management Trades Panel, exclusively designed for discerning traders. Our innovative panel is a game-changer in the realm of financial trading, offering unparalleled functionality and user-friendly features. Key Features: Automated Daily Profit/Loss Closure : Set your desired profit or loss thresholds, and let our panel automatically close all current trades when these
FREE

Just a panel for drawing levels. Minimal but very useful thing. This is a further development of the free version. This is the version that I use myself and it has many behavior adjustments. ---- 12 types of customized levels. Support for rectangle and line levels. If you need to prevent a level from extending, add "noext" to the end of the name level object. For any update idea please contact me here. ---- This is not an indicator, don't download the demo, it doesn't work For test see free ver

バージョンMT 4: https://www.mql5.com/zh/market/product/109262 バージョンMT 5: https://www.mql5.com/zh/market/product/109258 使用方法: https://www.mql5.com/zh/blogs/post/755183 EAの概要: このEAは、2人のブローカーAとBを用いてヘッジ取引を行う。ブローカーAのASKがブローカーBのASKより小さい場合、ブローカーAは購入し、ブローカーBは売却し、2つの口座の損益を観察する。総利益が目標に達すると、口座Aと口座Bは同時に平倉になる。 シーンを適用するには: 1.価格差ヘッジ:異なるブローカーの見積もりが異なり、Aブローカーの見積もりがBブローカーの見積もりより高い場合もあり、Aトレーダーの見積もりがBトレーダーの見積もりより低い場合もある。これはヘッジにお金を稼ぐ機会を提供している。 2.リベートを稼ぐ:手数料の返金サービスを提供する代理店を探して、AB口座が利益がなくても、リベートを稼ぐことができます。 3.プラットフォーム奨励金の使

[Description] Panel Anywhere is a groundbreaking EA panel, being the first in the market to support browser operations. It addresses a pain point for all MT5 traders, offering a solution that has been lacking in the past. Additionally, the EA itself provides a comprehensive interface to meet all regular operational needs.
[Features] Browser Support: - View EA panel information from the browser, allowing you to manage your account anywhere, unrestricted by a computer or RDP. - WebEA URL: ht
FREE

A utility for automatically detecting the GMT offset of your broker To use the utility, place it in the Scripts folder of the terminal data directory, enable WebRequest in the terminal settings and add the address https://www.worldtimeserver.com/ to the list of allowed ones. Run the Check GMT script on the chart with any currency pair There is only one setting in the script: site = https://www.worldtimeserver.com/ just for your convenience. Copy this address from the sc
FREE
Supercharge Your Trading with HF TradeCopier !
Are you tired of manual trade execution and missed opportunities? Take your trading efficiency to new heights with the HF TradeCopier ! This cutting-edge solution empowers traders like you to effortlessly copy transactions between different MetaTrader 4 and MetaTrader 5 accounts, saving you time and maximizing your profit potential . With lightning-fast copying speeds of under 0.5 seconds , you can seize market opportunities instantly and s
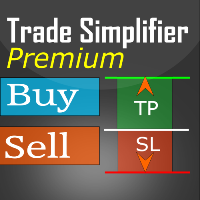
Trade simplifier premium is a trade panel that simplifies trade opening. It is simple and easy to understand, with key features to ease trading. Features include:
Order type selection Fixed lot entry from the chart user interface Easy Take profit entry field on the chart user interface Visual take profit selection and adjustment via the line that appears when you click the Take Profit button Easy Stop loss entry field in points on the chart user interface Visual Stop Loss selection and adjustm

Just a panel for drawing levels. Minimal but very useful thing. This is a reimagining of Color Levels Pro. ---- 4 types of customized levels. support for rectangle and line levels. The indicator parameters are very simple and are divided into blocks. For any update idea please contact me here. ---- Extension version " Levels tool pro " ---- don't suffer don't suffer ---- Enjoy your work!!!!!!!! ----
FREE

This script deletes all objects attached to all open charts. It's a bulk operation that can save a lot of time, avoiding the need to open the Objects List (Ctrl+B), pressing "List all", then manually selecting the objects and hitting "Delete" (for each single chart)... If you've tried "Delete all objects from chart", this script does the same thing, but to all open charts . So beware! You'll have to add all those Fibonacci retracements, trendlines, etc. back to your charts if you run this script
FREE

Baby Shark Pro EA works using a series of indicators, mainly the RSI. This is an EA that uses martingale, so use with caution. But Baby Shark Pro EA gives you the ability to change the multiplier parameter, which allows it to decrease the martingale level. Thus, you determine the risk level you want. Unlike most of the other martingale, EA’s This doesn’t place random entries, rather it is riding on market movement RSI > 50. If the market moved the opposite direction after the first entry, th

This is a utility panel to assist closing of open Deals. The panel has input filters to assist one select the right trades. The tool displays the number of trades to be closed as well as profits to be realized. One click close, Filter trades to be closed by: symbol, (Filter by a particular symbol in the trade terminal). magic number (If your orders are from particular EA with unique magic numbers). whether in profit, loss or All. (P/L=all trades, profiting = trades in profit, loosing = trades
FREE

Smart Lot-Size Calculator And Trade Assistant for Mobile Trading Overview: This is the tool every trader in the market must have no matter if you are scalper, swing traders, day trader, or long term trader. This On-The-Go trading tool will help you stay disciplined and also stay free from daily trade management chores, Most traders face common problems like 1. Calculation of proper lot-size of a position to take controlled risk 2. Managing every trade and trailing stop-loss if trades goes in
FREE

MT5の仮想通貨チャート – MetaTrader 5での高度な暗号資産分析 スムーズな仮想通貨トレードと分析 Crypto Charting for MT5 は、 WebSocket (wss) を使用した リアルタイムOHLCチャート を提供し、 API制限やIPブロックのリスクなし で高速かつ信頼性の高い市場データを取得できます。プロトレーダーやアルゴリズム戦略に最適です。 主な機能: WebSocket (wss) によるリアルタイムチャート – 超高速データ更新。
自動履歴データ更新 – MT5再起動後もデータを保持。
スケジュール履歴更新 – 一時的なネットワーク切断によるエラーを最小限に。
全タイムフレーム対応 – M1からMN1まで 。
完全なOHLCVデータ – 始値、高値、安値、終値、実際の取引量、ティックボリューム 。
ストラテジーバックテスト対応 – MT5ストラテジーテスター でEAのテストが可能。
自動WebSocket再接続 – 安定したデータ接続を保証。 対応取引所: Binance – スポット、先物 & Coin-M
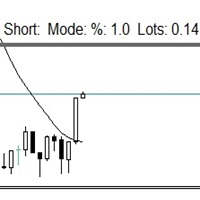
この小さなツールは、チャート上で線をドラッグするだけでリスク管理を定義するのに役立ちます。アカウント%または固定金額に基づいて計算された実際のロットサイズがラインで直接表示されます。
キーボードの「t」キーを押してラインをアクティブにし、ラインをストップロスポイントまでドラッグするだけです。それでおしまい。
設定では、線とテキストの色と幅、行と右側のテキストのスペースを定義でき、リスクを口座または固定金額のパーセントで設定できます。
ご質問やご希望がございましたら、お気軽にお問い合わせください。
この小さなツールは、チャート上で線をドラッグするだけでリスク管理を定義するのに役立ちます。アカウント%または固定金額に基づいて計算された実際のロットサイズがラインで直接表示されます。
キーボードの「t」キーを押してラインをアクティブにし、ラインをストップロスポイントまでドラッグするだけです。それでおしまい。
設定では、線とテキストの色と幅、行と右側のテキストのスペースを定義でき、リスクを口座または固定金額のパーセントで設定できます。
ご質問やご希望がございましたら、お気軽にお問
FREE

Achieve peace of mind with our EA companion! Simply set it and let it roll. Safeguard your trades on sluggish market days and holidays. Get updates on your balance and EA status every Friday evening, for example. Stay in the loop even if your terminal or VPS decides to take a break. Trading made easy – enjoy the tranquility! This EA has several functionalities
Closing of pending or open positions during pre-configured holidays. Automatic closing and reopening of pending positions during the nig
White label available. contact us for more info. dushshantharajkumar@gmail.com Replica Local Trade copier by Chart Walker
Replica, a MetaTrader 5 (MT5) local trade copier, is a powerful tool designed to streamline and automate trading processes for users within the MT5 platform. This innovative software allows traders to replicate trades from one account (master) to another (slave) in real-time, enabling efficient and synchronized trading across multiple accounts. With its user-friendly inte
FREE

Simply deletes all objects from a chart, at once.
Q: Shouldn't I remove the indicator(s) from the chart instead, if I want to get rid of those objects? A: Absolutely. There are rare cases though, when you might end up with residual objects that don't programatically get removed from your chart, due to bugs or some other reason.
Q: Why use this script, when I can press Ctrl+B, list all objects, then manually select and delete each one? A: To save time, really. Maybe you have too many unwanted o
FREE
If you prefer manual trading and open multiple trades then this utility is just made for you. This is a simple utility which will close all your open trades at TP1, TP2 and TP3 by the given input percentage. NOTE: - This utility is helpful for multiple trades only (not for a single trade). You can set three Take Profit levels/targets at three Percentages to close trades partially. Inputs Explained: 1. TP 1 Pips - here you can set the first Take Profit Target in Pips for all trades combined. 2.
Expert for setting stop loss and take profit simultaneously for all orders or positions of a currency pair Once attached to the graph, the expert panel will appear on which there are buttons for setting and a green horizontal line, if you click on the line you can move it on the graph and choose the stop loss or take profit threshold with it, move the cursor over the panel and the value will be set where you have positioned the horizontal green line, press the button for the setting you want t

Cheers, traders! In today's video, dive into the world of advanced trading with our exclusive Trade Panel. This Cyber Monday, we're offering a special deal – get access for only $27 instead of the usual $60!
In this tutorial, we explore a semi-automated trading system that empowers manual traders to seize opportunities effectively. Watch as we demonstrate using real market scenarios, showing you how to set up trades, manage risk, and maximize profits.
Key Features of the Trade Pan

「ローソク足パターン取引パネル」は、ローソク足パターンで取引し、パターンを特定して取引を実行するプロセスを 迅速かつ簡単にしたい トレーダーにとって究極のツールです。さまざまだが重要な入力オプションを備えたこのツールは、ローソク足パターンの手動取引を自動化したい人、手動で以前よりも早く取引できるように支援したい人、または単に見たいパターンを知らせたい人に適しています。
EA を使用したいシンボルで EA をアクティブにすると、チャートの左上隅に表示される 取引パネル を見てみましょう。 ライブ取引では時は金なりであるため、パネルはシンプルになり、トレーダーが必要とする可能性のある主要な機能のみを使用するように思慮深く設計されています。 取引禁止 : 安全上の理由から事前にチェックされています。これは基本的に、ローソク足パターンが表示されたときに EA に Arrow オブジェクトのみを表示し、それ以上は表示しないことを示します。 取引する矢印をクリックします: クリックすると、 矢印オブジェクトをクリックするだけで 、パターンが表示されるたびに半手動で取引できるようになります。 ス

皆さん、こんにちは
人々の目から見ると、投資は難しくてリスクの高いビジネスであると考えられています。 しかし、知識とスキルを身につけて投資を行えば、市場があなたに害を及ぼすことはありません。 資本市場でのフィルター書き込みは、この分野の専門家が生産性を向上させ、時間を節約するために行うアクションの 1 つです。 多数のシンボルが活動するため、保存される情報とデータの量は非常に多くなります。 この市場で活動する人々は、一連の情報を必要とする場合があり、問題の機密性を考慮して、できるだけ早く情報を入手する必要があります。 この情報は通常、市場の将来を予測するのに役立ち、非常に重要です。
コマンドによる Fitler の書き込みにより、要求された条件に一致するシェアが検索されます。 選択した機能をフィルタリングすると、すべての取引可能な株式が検索され、適切な株式が表示されます。 資本市場では各人が取引の戦略を持っており、フィルタリングすることで戦略に沿って取引を進めることが容易であり、 その後、さまざまな時間枠で戦略の結果を確認できます。
フィルタリングの利点 1- 高速: 各株式の

Emulate TradingView drawing experience with magnet snap to the nearest price. A handy precision drawing tool for trading: ICT SMC (Smart Money Concept) Demand & Supply FVG (Fair Value Gap) Breakout Trend Following Reversal MTF (Multiple Timeframe) Price Action Support & Resistance Elliott Wave Supported drawing tools: Vertical Line Horizontal Line Trend Line Horizontal Ray (Angle Trend Line) Fibonacci Retracement Rectangle
Input: Threshold (px) : The distance in pixel unit to snap the cro
FREE
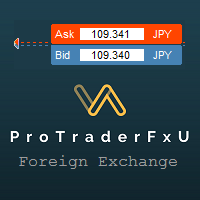
Description: - BidAskLine Indicator is very simple and easy, but each utility can be important in the probability that we will win in our trade. This utility Indicator shows lines and prices of the Bid, Ask and Spread. Input Parameters: - Visual Aspect Options : Select between 2 options with Box or Simple Style. - Parameters Bid Price : Select between show or hide line or box objects, change color, style or width line. - Parameters Ask Price : Select between show
FREE

Introducing the BlackWing Signal Provider—an advanced EA designed to enhance your trading experience by facilitating seamless communication between your MetaTrader 5 platform and Telegram channels, groups, or individual users.
Key Features:
1. Real-Time Event Notifications: Receive instant alerts on new trades, modified orders, closed positions, and deleted orders. Stay informed and make well-timed decisions.
2. Interactive Chart Snapshots: Share chart snapshots along with new trades and ord
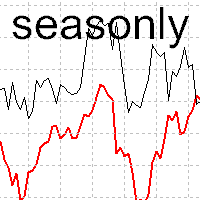
The tool for exploring seasonal patterns. It compares the chart with charts of other years and compares with the average for other years. Allows you to shift charts if necessary. Explore any year by specifying the zero point. Up to 10 charts in one tool. Works only on the daily chart ! The best for you! Enjoy your work! (It's not indicator - do not download demo it not work) for mt4 Seasonly MT4

A very usefull EA helps you control Trailing Stop and Break even point for single order
it works seperately for Buy side and Sell side
the EA displays some information useful when you load to your chart
all you need to do is to change the name of the pair you want to control TP and BEP
it works with all pairs and all types of accounts
if you have any questions you can always write to us at info@auranos.me

EquitySafe V1.0 is a powerful risk management tool designed for MetaTrader 5 . It enables traders to effectively manage their risk by setting maximum loss limits based on custom time frames. With this tool, you have the flexibility to define your own time intervals and allocate specific risk thresholds accordingly. This helps you maintain control over your trading account and minimize potential losses. By utilizing EquitySafe, you can ensure that your trading strategy aligns with your risk tole
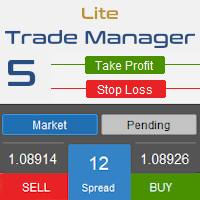
Trade Manager 5 Lite is trading panel developed with a goal to make manual trading in some (routine) task easier.
Version for Meta Trader 4 is here: Trade Manager 4 Lite . (MT4 version also works in Strategy Tester)
Main features of Trade Manager 5 Lite Trading for Forex and CFDs Support for 4 and 5 digit brokers 65 combinations to set order Set Take Profit, Stop Loss and entry level for Pending Order with lines positioned on the chart Break Even Trailing Stop Loss Multiple Orders at one c
皆さん、こんにちは
人々の目から見ると、投資は難しくてリスクの高いビジネスであると考えられています。 しかし、知識とスキルを身につけて投資を行えば、市場があなたに害を及ぼすことはありません。 資本市場でのフィルター書き込みは、この分野の専門家が生産性を向上させ、時間を節約するために行うアクションの 1 つです。 多数のシンボルが活動するため、保存される情報とデータの量は非常に多くなります。 この市場で活動する人々は、一連の情報を必要とする場合があり、問題の機密性を考慮して、できるだけ早く情報を入手する必要があります。 この情報は通常、市場の将来を予測するのに役立ち、非常に重要です。
コマンドによる Fitler の書き込みにより、要求された条件に一致するシェアが検索されます。 選択した機能をフィルタリングすると、すべての取引可能な株式が検索され、適切な株式が表示されます。 資本市場では各人が取引の戦略を持っており、フィルタリングすることで戦略に沿って取引を進めることが容易であり、 その後、さまざまな時間枠で戦略の結果を確認できます。
フィルタリングの利点 1- 高速: 各株式の

With this free tool, you can easily visualize your trades on the chart, view take profit and stop loss values in points and percentages, and enter trades based on percentage of your account balance or specific amounts of money, among many other features. How does it work? Simply fill out the Start Price, TP (Take Profit), SL (Stop Loss), and Volume parameters, and click on the "Open Trade" button to immediately place the order/trade. The "Long" button allows you to select whether you want to Buy
FREE

News Filter EA: Advanced Algo Trading Assistant The News Filter EA is an advanced algo trading assistant designed to enhance your trading experience. By using the News Filter EA , you can integrate a Forex economic news filter into your existing expert advisor, even if you do not have access to its source code. In addition to the news filter, you can also specify trading days and hours for your expert. The News Filter EA also includes risk management and equity protection features. MT4 Version
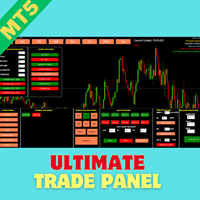
Introducing the Ultimate Trade Panel MT5 - Your All-in-One Trade Manager for MQL5 Trading Are you a trader looking to streamline your trading activities and gain a competitive edge in the market? Look no further! The Ultimate Trade Panel MT5 is here to revolutionize your trading experience on the MQL5 platform. With a plethora of unique and time-saving features, this expert advisor is designed to be your reliable companion for day-to-day trading activities. Key Features: Indicator Manager: Say g
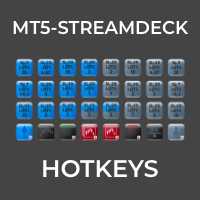
MT5-StreamDeck offers the possibility to use a certain number of pre-programmed Hot-keys with a clearly defined role. So by the push of a button you can open a trade with a pre-defined lot size, stoploss and take profit. Close all your trades, close the ones in profit, or in loss, set Break-even or set a trailing stop. All this with a Hot key button. See the feature list for all the actions that can take place at the push of a button. Ideal for Quick Scalping or day trading with set risk managem
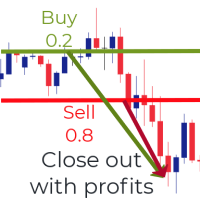
Introducing the Zone Recovery EA, a powerful tool for traders who seek precise control over their Zone Recovery strategies. This manual version operates similarly to the Zone Recovery mode in ManHedger but some distinctive features – the Stop Loss (SL) cannot be modified during the strategy execution, and no pending orders are opened, when the StartPrice is reached. There are no input parameters. Zone Recovery strategies can only be executed on accounts that allow hedging. Key Features: Hedging
FREE

"Twitter API v2 OAuth 2.0 with PKCE"に対応した「TweetHelper for MT5」の環境設定を行うスクリプトです。
Client ID : ${CLIENT_ID} Auth Basic base64 : β string(Base64) Response Code : auth_code to be obtained in step 2 of "Connection Procedure Using OAuth2.0" Callback URI : the value set in User authentication settings "Callback URI / Redirect URL"
TweetHelper trial for MT5 https://www.mql5.com/ja/market/product/54832
TweetHelper for MT5
https://www.mql5.com/ja/market/product/54836
MetaTrader settin
FREE

Hey Trader!
Boring with the Meta chart? Do you want to move it as you do in Profit?
Your problems are over! Now available Chart Panoramic or ChartPan for closer friends, a utility that allows you to move the chart to better visualize the most relevant points for your trade.
Recommend you to add a keyboard shortcut for quick access (Ctrl + Q - for example), because you will need to run ChartPan after symbol changing to "release" the chart again.
To add a hotkey: after downloading
FREE

Close Manager EA for MetaTrader 5 Introduction: Welcome to the Close Manager EA, an essential tool designed exclusively for MetaTrader 5. This expert advisor has been meticulously crafted to streamline and enhance the trade closure process. Whether trades are initiated manually or by other EAs, this tool offers a diverse range of customizable criteria, empowering traders with enhanced control over their trade exits. You can find the MT4 version here Key Features: Logs Capture (SHOW_LOGS): Enable
FREE

Position Closer is advisor used to close all orders when the profit will cross specified value either above or below. You can close all orders with one button click.
On panel on chart you have options: Deactivate after close - If Deactivate after close is checked the advisor will disable Close above profit and Close below profit options after orders are closed either on crossing the profit or on hitting the CLOSE ALL button. Close above profit - If Close above profit is checked, the advisor wil
FREE

这款专为MetaTrader 5设计的EA(Expert Advisor),能够在加载后自动关闭所有图表,并立即从当前图表中自行移除。它适合那些希望快速清理所有图表,并避免手动关闭每个图表的用户。 功能特点: 一次性清理: 加载后立即关闭所有打开的图表。 自动移除: 执行完毕后,EA自动从当前图表中移除,无需手动操作。 快速高效: 适用于快速清理交易环境,特别适合在需要快速重置或结束交易日的情境。 使用说明: 只需将此EA添加到任何一个图表上,它将自动执行关闭所有图表的操作并自行移除。使用前,请确保已保存所有重要的图表数据和设置。 风险提示: 请谨慎使用此EA,以防不小心关闭重要图表。 适用于MetaTrader 5平台。 技术支持: 如有任何技术问题或需求,请联系我以获得帮助。
FREE

Introducing BoTutor - Simplify Candlestick Data Collection and Export! Are you tired of the hassle of manually collecting and exporting candlestick data from your charts? Look no further, because BoTutor is here to revolutionize your data mining experience . BoTutor offers a user-friendly graphical interface that is intuitive, clean, and easy to navigate. Say goodbye to complex data extraction procedures, and effortlessly gather candlestick data with just a few clicks. BoTutor lets you expo
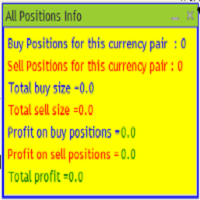
The provided MQL5 expert creates a custom information panel in the MetaTrader 5 (MT5) trading platform This panel displays information about the trading positions for the current symbol (currency pair) on the chart. It shows the number of buy and sell positions, their sizes, and profits. Provide traders with a quick overview of their trading positions for the current symbol It is very useful when you open several positions of several sizes and you want to know the exact situation of the number

「スキャルピング スケールイン」は、スキャルピングでは 1 秒を争うため、S/L および T/P の配置を気にせず、固定距離の初期位置でスケーリングしたいスキャルパー向けに設計されたユーティリティ ツールです。
仕組み:
EA の入力タブで希望の値を設定します。具体的には、T/P に配置するリスク対報酬、S/L の幅 (ピップ単位) を設定します。また、次の次のストップ注文までの距離 (位置のスケール) です。 MT5 で [買い/売り] を手動でクリックすると、EA が自動的に SL と TP を設定し、同時に新しい逆指値注文を SL と等しい距離 (ピップ単位) で同じ方向に設定します (つまり、買う場合は S/L が 5 ピップス)。 、次の買いストップ注文は、最初のエントリー価格より 5 ピップス上に配置されます)。保留中のストップ注文が約定されると、前のポジションは損益分岐点まで追跡され、S/L が前の取引のエントリーレベルで新しいストップ注文が発注されます。 基本的に、このツールは、積極的な動きを捕捉する均等に分散されたスケールインを利用します。 入力パラメータの説

The spread in trading is the difference between the purchase price and the sale price of a financial instrument on the market. The spread is a commission fee that traders pay brokers for the opportunity to trade.
It's no secret that each broker offers its own terms for trading. The size of the spread is important. There are a lot of advisors (especially scalpers) who show different results at different brokers. We have repeatedly encountered this. Therefore, using this utility, find out what s
FREE
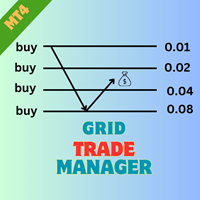
Product Name: Grid Trade Manager MT5 Description: The Grid Trade Manager EA for MetaTrader 5 is meticulously crafted to oversee trades employing a grid trading strategy. It strategically places a sequence of pending buy and sell orders at predefined intervals, forming a grid pattern. This EA vigilantly monitors market fluctuations, dynamically adjusting the grid to optimize potential profits. Additionally, it incorporates robust risk management features to control grid size and curtail potential
FREE

A Fibonacci Panel tool to facilitate your trading with Fibonacci indicator. Simple and easy to use! Magnificent Design (Adjustable) Sound Effects (This will make trading much more fun) Five Fibonacci Levels (freehand movable) Acoustic and graphic signals (adjustable for each level) Integrated narrow trading panel also with risk and money management If you need silence while trading, you can deactivate the sounds in the settings.
Parameter
Language English Magic number Commentary (for all posi
FREE
This EA help trader to manage his pending orders, when you place many Pending Orders this utility monitor them and when of them get filed (executed) the EA cancel and delete all rest of pending orders, to avoid opening of all of pending orders at the same time , and lose your risk management. this utility is very useful for trader when he /she is not available on the desk.
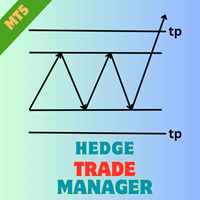
Product Name: Hedge Trade Manager MT5 Description: The "Hedge Trade Manager" EA for MetaTrader 5 is a sophisticated solution designed to adeptly manage trades through a hedge trading strategy. With a range of configurable settings, this EA provides comprehensive control over hedge trades. The documentation below outlines the various inputs and parameters to assist you in customizing the EA to suit your trading preferences. Overall Settings/Input Guide Name Setting Description General Settings Ma
FREE
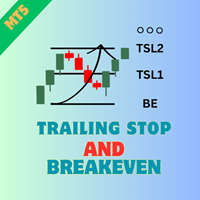
Product Name: Trailing Stop and Breakeven Management EA Description:
This EA (Expert Advisor) is designed to set trailing stops and breakeven levels for trades based on input parameters and a magic number in MT5. It can be used to manage trades placed manually or by any other EA. The EA allows customization of various settings to suit your trading strategy. General Settings: Enable Magic Number (ENABLE_MAGIC_NUMBER): Enable to use a magic number for trades. Set to false for manual trades. Magic
FREE
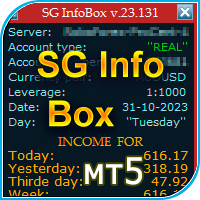
The "InfoBox" utility is designed to display the presence of open orders, the number of lots, current profit and much more in one window. The version for the MT4 platform is here . You've probably encountered a situation where you have an advisor that works on a currency pair, but information about its operation: - orders and their number, the size of the spread for the instrument, the volume of lots on the market, drawdown and much more - are scattered in different places of the terminal an
FREE

Having a chart window that has multiple pairs (symbols), timeframes, and indicators displayed simultaneously can be quite advantageous. This indicator will allow traders to place multiple chart objects in a sub window of the main chart window. The indicator is capable of adding all available MT5 indicators and custom indicators to the existing chart. The list and parameters of the indicators are for reference at: https://www.mql5.com/en/docs/indicators
Input parameters Name
Example
Indicator
FREE

This Tool Is A Comprehensive And User-Friendly Solution That Covers Every Aspect Of The Trading Process. From Risk Management To Advanced Order Execution And Monitoring, It Provides Traders With A Powerful Set Of Features To Enhance Their Decision-Making And Execution Capabilities In The Forex Market . Alert : This tool not work in strategy tester!
MT4 Version
Features:
Risk Management: Provides tools to set and manage risk levels for each trade, ensuring that traders can control and limit po
MetaTraderマーケットは、他に類のない自動売買ロボットやテクニカル指標の販売場所です。
MQL5.community ユーザーメモを読んで、取引シグナルのコピー、フリーランサーによるカスタムアプリの開発、支払いシステムを経由した自動支払い、MQL5Cloud Networkなど、当社がトレーダーに対して提供するユニークなサービスについて詳しくご覧ください。
取引の機会を逃しています。
- 無料取引アプリ
- 8千を超えるシグナルをコピー
- 金融ニュースで金融マーケットを探索
新規登録
ログイン