YouTubeにあるマーケットチュートリアルビデオをご覧ください
ロボットや指標を購入する
仮想ホスティングで
EAを実行
EAを実行
ロボットや指標を購入前にテストする
マーケットで収入を得る
販売のためにプロダクトをプレゼンテーションする方法
MetaTrader 5のための有料のエキスパートアドバイザーとインディケータ - 92

Description
The base of this indicator is an ZigZag algorithm based on ATR and Fibo retracement. The ZigZag can be drawn like a classic ZigZag or like Arrows or needn't be drawn at all. This indicator is not redrawing in sense that the ZigZag's last shoulder is formed right after the appropriate conditions occur on the market. The shoulder doesn't change its direction afterwards (can only continue). There are some other possibilities to show advanced information in this indicator: Auto Fibo on
Automatic stops monitors your account and automatically sets the values you enter in the EA for stop loss, take profit and also trailing stop. As long as the EA is attached on a chart it will set stops and offer automatic trailing to any new trades for that currency pair so you wont have to manually enter them every time you open a trade. Features include: Ability to select which trades should be monitored via magic number. You can leave the value to 0 to only monitor manual trades or to any one
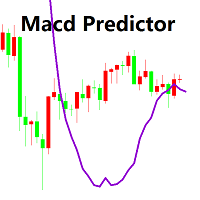
Macdのメインチャートインジケータ
1. MACDが買いから売りに変わる価格を決定することができます。逆も同様です。 これはオシレータの予測子のいとこです。 当時のポジションを知っていれば、正確な価格、現在および次の(将来の)列はMACDクロスオーバに到達する必要があります。 あなたは、現在のポジションが次のMACDクロスオーバーフォースによって助けられたりブロックされたりする前に、市場がどのくらい離れていなければならないかを見ることもできます。 プレディクタはリアルタイムで更新されるため、すべての時間枠でこれを行うことができます。
2. MACD予測変数の履歴を使って価格行動を明確に観察し、棒グラフに直接重ねることで、市場の「動圧」を決定できます。 ダイナミックな圧力とは、信号を売買する市場の反応を指します。 MACDで30分間販売していて、市場が平坦であれば、次の購入信号が簡単に大きな勝者になることがわかります! これは私がよく標準MACDで行うことですが、今は見やすいです! input: Fast EMA - period of the fast Moving Av
The expert allows you to build a trading system based on an arbitrary set of technical indicators MT5. The EA uses the following signals: - OpenBuy / OpenSell - opening positions;
- StopBuy / StopSell - closing positions;
- TakeProfitBuy / TakeProfitSell - get TP levels;
- StopLossBuy / StopLossSell - getting SL levels;
- NoLossBuy / NoLossSell - transfer to the breakeven state;
- MinProfitBuy / MinProfitSell - closing part of a position;
- CancelBuy / CancelSell - allow a repeated signal
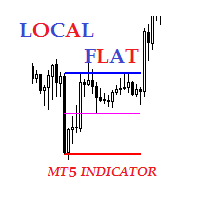
Description The indicator of local flat. The indicator allows to find local flats in the following options: Width of channels that is not more than certain number of points Width of channels that is not less than certain number of points Width of channels that is not more and not less than certain number of points The indicator displays the middle and boundaries of the channel. Attaching multiple instances of the indicator to the chart with different ranges leads to displaying a system of chann
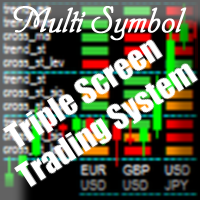
Purpose The indicator is intended for manual multi-currency trading based on the Triple Screen Strategy. It works with any symbols located in the Market Watch window of the MT5: currencies, metals, indexes, etc. The number of instruments can be limited by capacity of the МТ5's parameters. But if desired, you can create several windows with various set of instruments and parameters.
Operation Principle The indicator uses the modified Triple Screen Strategy for determining trend direction in the

The Expert Advisor is a great tool that allows you to control your trade with ease and precision. The tool can be moved in the graphs and offers the following characteristics:
Instant order entry with a single click. Entry of pending orders using price tags and trend lines. Instant order closure with a single click. Instant order closure using trend lines as output levels that the broker can not see. We can modify the way to enter and exit the market, allowing us to choose the way to do it. Fo

Average True Range. Calculates last candle high and low for finding trends. Strong results with british pound in daily charts. Uses Atr modificable periods, trailing stop and take profit. Tested in real accounts. Is a great expert advisor with great results. You can choose the risk you want to take. Can calculate automaticaly the total amount of risk for new trades.

The EA uses economic news trading using low, medium and high news. The EA is set for each piece of news separately. Trading is conducted on 26 currency pairs and 3 timeframes from M5-M30. The EA uses trading on such indicators as CCI, Standard Deviation, Moving Average, Relative Strength Index, Momentum and MACD . The EA looks for small price deviations by indicators and uses 3 types of economic news to confirm the position opening. Adaptive breakeven, trailing stop , and partial position clo
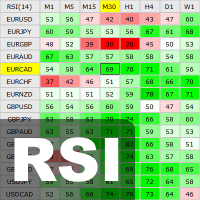
This indicator shows the current RSI values for multiple symbols and multiple timeframes and allows you to switch between timeframes and symbols with one click directly from the matrix. With this indicator, you can analyze large number of symbols across multiple timeframes and detect the strongest trends in just a few seconds.
Features Shows RSI values for multiple symbols and timeframes simultaneously. Colored cells with progressive color intensity depending on the RSI values. Ability to chan

The utility refers to probabilistic analysis tools, in particular the Monte Carlo method. The Monte Carlo method is defined as the simulation of processes in purpose to evaluate their probabilistic characteristics and apply them to the solvable task.
Operation features The simulation uses a tick model with the subsequent transformation to the candles form, as a model as close as possible to the real market process. The utility generates a stream of a random tick sequence until a result with t

This indicator shows the remaining time for the candle to close, even if the price does not change in value, the clock keeps counting backward. You can also program price alert levels using trend lines.
It can be used together with Expert Advisors and other panels, such as Controller without limit MT5
MT4 version
Instructions To set a price alert level, you must draw a trend line. Once the object has been drawn, it must be named so that the indicator recognizes the object. In the

This is a complete and customizable Trading HUD (Head-Up Display) combining all important tools and information for professional trading in one window. Features:
1. Display key indicators that most professionals consider for their trading decisions Current daily, weekly and/or monthly Pivot Points with 7 Levels (PP, S1, S2, S3, R1, R2, R3) Complete history of daily, weekly and/or monthly Pivot Points Current level of exponential moving averages (EMAs) from different timeframes. The User can de
The Expert Advisor allows you to build a trading system based on a custom indicator. It performs automated opening/closing of trades based on the signals of arrow indicators (which buffer values other than 0 and EMPTY_VALUE) or color lines. The EA polls the values of the specified indicator buffers, opens/closes and accompanies trades according to the specified parameters.
The Expert Advisor implements the following trade support functions:
-installation of SL and TP; -calculation of th

MultiTimeframe (MTF) Support and Resistance Indicator is use to measure last 320 bar (user input) of support and resistance of the dedicated timeframe.
User can attached this indicator to any desire timeframe. Features: User input desire timeframe (default Period H4) User input numbers of last bars (default 320 bars) User input measurement of last HH and LL (default 10 bars) Line styling and colors. MT4 Version : https://www.mql5.com/en/market/product/31984

Market profile was developed by Peter Steidlmayer in the second half of last century. This is a very effective tool if you understand the nature and usage. It's not like common tools like EMA, RSI, MACD or Bollinger Bands. It operates independently of price, not based on price but its core is volume. The volume is normal, as the instrument is sung everywhere. But the special thing here is that the Market Profile represents the volume at each price level.
1. Price Histogram
The Price Histogram

Price action is among the most popular trading concepts. A trader who knows how to use price action the right way can often improve his performance and his way of looking at charts significantly. However, there are still a lot of misunderstandings and half-truths circulating that confuse traders and set them up for failure. Using PA Trend Reversal will be possible to identify high probability exhaustion moves of a trend. Features The indicator gives alerts in real-time when the conditions are me

Renko Graph 練行足グラフ 現在の価格の場所にあるメインチャートウィンドウの練行足インジケーター。 インディケータは、通常の相場チャートの背景に対して、長方形(「ブリック」)の形で価格変動を表示します。設定で指定されたポイント数による価格の上昇は、前の次の長方形の上に追加することによってマークされ、下向きの動きは前の長方形の下に追加されます。 インジケーターは、主なトレンドを視覚的に識別するように設計されています。根底にあるトレンドを平均化する際に、主要なサポートとレジスタンスのレベルを特定するために使用されます。このビューでは、小さな価格変動(「ノイズ」)は考慮されていないため、非常に重要な動きに集中できます。 価格変動が指定されたしきい値レベルを超えた場合にのみ、上または下の新しい指標値がプロットされます。サイズは設定で設定され、常に同じです。たとえば、基本サイズが10ポイントで、価格が20上昇した場合、2つのインジケーター値が作成されます。 インジケーターの利点は、どのレンガでもその形成時間の長さを示すことができることです。価格が範囲内で変動し、成長せず、しきい値の
マスターキットは、既製のEAであなたの戦略が含まれてい
スキャルピング/トレンド/カウンタートレンド/フラット=一つにすべて、唯一の気分!
フォーツと外国為替
EAの可能性は巨大です。 設定の組み合わ
簡単なセットアップでボリュームを増やす複雑で信頼性の高いメインシステムを使用
可能な設定:
方向-購入のみ、販売のみ、またはRSIインジケータによる自動選択の方向 最初の巻 最大取引ロット ボリューム多重度-取引を失うのシリーズの後にボリュームを増加させる回数。 ストップロス Profit factor-数値として設定します。 それが4の場合、SL=100、TP=400です。 増加する取引を失う-SLによって行のどのように多くの取引 損失なしで取引をスキップ-"はい"または"いいえ"の選択。 "はい"オプションが有効になっている場合、トレーリングストップが取引を損益分岐に移動した場合、取引はSLシリーズでは考慮されず、ボリュームを増加 "いいえ"が選択されている場合、いずれの場合でも、SL取引はシリーズでカウントされ、ボリュームが増加します 末

The script opens a separate window and displays information about the current open positions in it.
The informer will be useful to those who operate with a large number of positions open on different instruments in different directions.
It allows you to quickly decompose the loading of the deposit by instruments, visually identify the most tense places in the aggregate position. For the exposed stop orders, it calculates the total risks and goals.

Slick 指標は、取引決定を行うためのアラート信号を備えた二重アイロン相対力指数(RSI)です。インジケーターは価格に従い、その値は0〜100の範囲です。インジケーターの範囲は通常のRSIインジケーターの範囲と同じです。 インジケーター設定の説明: Period_1-インデックスを計算するための期間 Period_2-インジケーターの平滑化の主要な期間 Period_3-インジケータースムージングの2次期間 MAMethod-アンチエイリアシングメソッド AppliedPrice-価格定数 MAX_bound-上位信号ゾーンのレベル MIN_bound-下位信号ゾーンのレベル アラート-カスタムデータを含むダイアログボックスを有効にします Text_BUY-買いシグナルのカスタムテキスト Text_SELL-売りシグナルのカスタムテキスト Send_Mail- [メール]タブの設定ウィンドウで指定されたアドレスにメールを送信します 件名-メールヘッダー Send_Notification- [通知]タブの設定ウィンドウでMetaQuotesIDが指定されているモバイル端末に通知を

WavesTrends このオシレーターは、価格が一定の範囲内で変動する場合に使用される市場指標の1つです。オシレーターには独自の境界(上限と下限)があり、近づくと、市場参加者は売られ過ぎまたは買われ過ぎの市場に関する情報を受け取ります。インディケータは、特定のボラティリティの範囲内で価格変動を登録します。 オシレーターシグナルが価格チャートで確認されると、取引の可能性が高まります。この方向は、オシレーターのいわゆる上部ゾーンと下部ゾーンに反映されます。楽器は買われ過ぎと売られ過ぎの状態に基づいています。これらのパラメータを決定するために、特別なレベルが設定されます。 発振器は本質的に二次的です。これは、主要なツールとしてではなく、分析のための補助的なツールと見なす必要があります。主なパラメータは常に実際の価格変動です。 インジケーター設定の説明: Waves_Period-インジケーターを計算するための主要な期間 Trends_Period-インジケーターを計算するための2次期間 Width_Period-線の間の幅を計算するための期間 ARROW_SHIFT-信号ポイントの垂直

BinaryPinMt5 is an indicator developed and adapted specifically for trading short-term binary options. The indicator's algorithm, before issuing the signal, analyzes many factors, such as market volatility, searches for the PinBar pattern, calculates the probability of success when making a deal. The indicator is set in the usual way. The indicator itself consists of an information window where the name of the trading instrument is displayed, the probability of making a successful transaction,

The EA uses two strategies, the first trend strategy the second reverse strategy can be enabled or disabled through the settings. The EA has been optimized for the last 10 years. The adviser uses a variety of indicators such as Bollinger Bands , Moving Average , Momentum with different settings for the most accurate signals. To close positions, stop loss and take profit are used, as well as additional methods of order modifications. Very easy to set up, does not require special knowledge. You c

Delta EMA is a momentum indicator based on the changes of closing price from one bar to the next. It displays a histogram of the exponential moving average of those changes, showing magnitude and direction of trend. Positive delta values are displayed as green bars, and negative delta values are displayed as red bars. The transition from negative to positive delta, or from positive to negative delta, indicates trend reversal. Transition bars that exceed a user specified value are displayed in br

Tarzan この指標は、相対力指数の読み取りに基づいています。
速い線は、シニア期間からのインデックスの読み取り値です。たとえば、H4期間からのインジケーターの読み取り値が設定され、インジケーターがM15に設定されている場合、シニア期間の1つのバーに収まるバーの数だけ再描画されます。 、再描画はM15期間で16小節になります。
スローラインは、平滑化された移動平均インデックスです。
インディケータは、設定に応じて、さまざまなタイプのシグナルを使用して取引の決定を行います。 インジケーター設定の説明: TimeFrame-インジケーターが計算されるチャート期間。 RSI_period-インデックスを計算するための平均期間。 RSI_applied-中古価格。 MA_period-インデックス平滑化期間。 iMA_method-アンチエイリアシングメソッド アラート-カスタムデータを含むダイアログボックスを有効にします Text_BUY-買いシグナルのカスタムテキスト Text_SELL-売りシグナルのカスタムテキスト Send_Mail- [メール]タブの設定ウィンドウで指定

Панель предназначена для быстрого визуального нахождения и отображения внутренних баров по всем периодам и на любых выбранных валютных парах одновременно. Цвет сигнальных кнопок, указывает на направление паттерна. По клику на сигнальную кнопку, осуществляется открытие графика с данным паттерном. Отключить не используемые периоды, можно кликом по его заголовку. Имеется поиск в истории (по предыдущим барам). Прокрутка (scrolling) панели, осуществляется клавишами "UP" "DOWN" на клавиатуре. Имеется

Rush Point System
It is a detector indicator of breakage of support and resistance with continuity force.
Operation:
The Rush Point System detects in real time when a buying or buying force exceeds the spread limits in order to consume large quantities of lots placed in the book, which made price barriers - also called support / resistance.
At the very moment of the break, the indicator will show in the current candle which force is acting, plotting in the green color to signal purchasin

Rush Point Histogram Continuity force indicator. Operation: After a breach of support or resistance of an asset, the trader can understand by reading the histogram if such a move tends to continue, thus filtering false breaks or short breaks without trend formation. Through a simple, level-based reading, the trader can make a decision based on the histogram, where: Below 21: No trend formation 21 to 34: Weak trend 34 to 55: Strong Trend 55 to 89: Strong tendency Suggested Reading: Observed disru

Мультитаймфреймовый индикатор показывает спрос и предложение, вырожденный через тиковый объем. Индикатор разделен на 3 зоны. Зона снизу показывает спрос и предложение текущего временного периода. Выше нее располагается значения показывающий таймфрейм старшего периода. В верхней зоне располагается отображение таймфрейма на 2 больше текущего. Пример: основной временной период 1 минута - будет отображаться в нижней зоне индикатора. Выше нее расположится 5 минутный период. В 3 зоне расположится 1

MMM Commodity Channel Index Mapped Timeframe Strategy: The Expert Advisors uses its two built-in CCI indicators in 12 different timeframes to determine the prices trends and calculates the signal to decide to open buy or sell positions; You can define the time period of each day of the week the EA should not trade (the bad time to trade). Usually the period of day when the impact news are published. This way the EA will trade only on good hours. General Inputs Closes orders with any profit of va
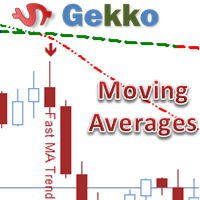
his is Gekko's Moving Averages indicator. It extends the use of the famous moving averages and calculates strong entry and exit signals using Price versus a Fast Moving Average versus a Slow Moving Average. You can set it up in many different ways, eg: price crossing, moving averages crossing, moving averages trend, among others.
Inputs Number of Bars to Plot Indicator: number of historical bars to plot the indicator, keep it low for better performance; FAST Moving Average Details: settings f

The indicator Universal Separate Window MT5 works according to your rules. It is sufficient to introduce a formula, along which the line of the indicator will be drawn.
This indicator is intended for use in the separate chart window.
All indicators of the series Universal :
Main window Separate window Free MT4 Universal Main Window Free MT5 Universal Main Window Free MT5 MT4 Universal Separate Window Free MT5 Universal Separate Window Free MT5 Full MT4 Universal Main Window MT5 Universal Ma

The indicator Universal Main Window MT5 works according to your rules. It is sufficient to introduce a formula, along which the line of the indicator will be drawn.
This indicator is intended for use in the main chart window.
All indicators of the series Universal :
Main window Separate window Free MT4 Universal Main Window Free MT5 Universal Main Window Free MT5 MT4 Universal Separate Window Free MT5 Universal Separate Window Free MT5 Full MT4 Universal Main Window MT5 Universal Main Windo

Советник FX Ilan Plus -это аналог советника, с добавлением множества дополнительных логик и возможностей для торговли, с оставленными настройками советника . Советник торгует по системе Мартингейл с увеличением последующих лотов в серии ордеров, с целью их усреднения. Первый ордер робот выставляет по сигналам встроенного индикатора. Так же советник имеет возможность прекращать торговлю в зависимости от новостей. FX Ilan Plus можно использовать либо на одном графике, либо на двух графиках в проти

The indicator identifies divergences between chart and RSI, with the possibility of confirmation by stochastics or MACD. A divergence line with an arrow appears on the chart when divergence is detected after the current candle has expired. There are various filter parameters that increase the accuracy of the signals. To identify a divergence, point A must be set in the RSI, then point B Value must be edited, which sets the difference between point A and point B. The indicator can be used for tim

This is a multi-currency paired trading system.I won't go into the details of how it works, but what the user needs to care about is how it actually works. It is highly recommended that you download the product and test it thoroughly, including back testing with the historical data and foward testing in the simulated account. As this EA trades multiple currency pairs, relevant historical data will be automatically downloaded at the first time of its historical review, with data volume around 6GB

"Just copier" is designed to copy trading without any complicated settings. The copy can be done in one PC. One EA can be set as master (provider) or slave (receiver). The receiver lot can be set to multiple providers lots. Please also check this product at fxina.hostingerapp.com. Any type of copy is available. MT4 -> MT5 MT4 -> MT4 MT5 -> MT5 MT5 -> MT4 If you want to copy MT4 -> MT5 or MT5 -> MT4, please purchase "Just copier" for MT4 and "Just copier" for MT5 separately. Just Copier can copy

The indicator measures and displays the difference in the number of "Bid" and "Ask" prices changes in the form of digital, analog and graphic indicators. Designed for market research and for determine the moments of position closing during scalping trade with H1 or less timeframe. Use with bigger timeframe is not prohibited, but it is not informative because of a large number of accumulated values. Theory
"Bid" and "Ask" prices do not change simultaneously for most symbols. Often you can see h

This QuickClose help you to close all orders having profit immediately with only ONE CLICK, its work is very fast. You can choose which symbol you want or close all symbols so it will helpful for you in your trading to manage trading faster. This EA can quick close all Buy and Sell Orders by a selected symbol or total, And delete all pending orders. This SymbolButton is designed for closing orders. There is available Manual and Automatic closing functions. Automatic closing function will close t

Exit based Indicator - What is it? Exit your open positions based on up to 10 indicators. Even those you buy in Market !!! Use any indicator that provides buffer values (most of them output buffers). You can use any available buffers and even compare various indicator values. Selectors for exiting Buy Positions and Sell Positions are separate. The EA works in AND or OR mode. You can combine multiple instances to create elaborate rules. NO BROKER SIDE STOP LOSS IS USED.
Usage Ideas / Examples -

This version of the AshiMomentum multicurrency Expert Advisor works based on short-term changes in the trend, creating the price "corridor" set in the parameters. Trading is carried out at the external borders of this corridor by opening positions in different directions with different lot sizes. This achieves a very high probability of closing positions in profit.
AshiMomentum is intended for trading any currency pair on the M1 timeframe or higher.
No martingale, no arbitrage.

The indicator shows supply and demand degenerated through tick volume.
The red line is the supply line.
The blue line is the demand line.
The green line is the total volume line.
Typical situations of indicator readings:
red is higher than blue - supply is higher than demand - the price is falling. blue is higher than red - demand is higher than supply - the price is growing. the red and blue lines tend to go down, but the blue is above the red - demand prevails, the price rises, but
Probability Indicator displays volatility bands on the price chart and calculates probabilities of price exceeding specified levels for the next bar, taking trend into account. It does that by performing a statistical analysis of the completed bars in the chart's history, which may include years of data. The volatility bands differ from Bollinger bands in the calculation of standard deviation from the simple moving average, resulting in bands that envelop the range of price swings in a channel t

Панель предназначена для быстрого визуального нахождения и отображения пин-баров по всем периодам и на любых выбранных валютных парах одновременно. Цвет сигнальных кнопок, указывает на направление пин-бара. По клику на сигнальную кнопку, осуществляется открытие графика с данным паттерном. Отключить не используемые периоды, можно кликом по его заголовку. Имеется поиск в истории (по предыдущим барам). Прокрутка (scrolling) панели, осуществляется клавишами "UP" "DOWN" на клавиатуре. Имеется Push-ув

Main: Not martingale, not a grid, working on all symbols; a good rational algorithm; Work of two indicators: RSI (from older timeframe - it works as a signal filter) and RSI (from junior timeframe - it works as a signal) ; There is a good money management system (there are several type for trailing stop loss); EA can work on closed candles, and on current candles; Quickly optimized (the work is maximally accelerated). Current sets after optimization are in comments.
If you want to do optimizat
Advanced MA Crossover Alert System The FX AlgoTrader Advanced Moving Average Crossover Alert System is a highly configurable MT5 indicator which incorporates a fully automated alert system for monitoring two trader defined moving averages. The indicator is designed to alert traders when two moving averages crossover. The trader has a wide range of control over how the MA Crossover alerts are generated which is detailed below. Key Features Automatic display of trader defined fast and slow movin

Velox indicator
Velox is a indicator that shows the tendency, force and direction of price based on the fractal 5-3.
Negotiation strategy Composed of 6 lines that oscillate above and below axis 0. Each line represents a fractal that is calibrated by Phi³. To identify a bullish trend, all rows must be above zero. Already a downtrend, all rows should be below zero.
Indicator Parameters: Period - Number of bars for indicator calculations. The user can select the shortest, medium and longest p

MathScalperPro FORTS
MathScalperPro FORTS this is an automatic trend trading system based on unique mathematical calculations. The Advisor calculates the trading levels of price corrections and enters the transaction in the direction of the trend. Inputs on levels are possible in two ways. The first way is to enter the candlestick pattern 1-2-3, and the second way is to enter the change of direction of trade in the younger period.
Terms for trade: Does not use hedging, martingale, grid or o

Main: Not martingale, not a grid, working on all symbols; a good rational algorithm; Work of two indicators: Parabolic Sar and Moving Average (you can set a separate Timeframe for each indicator); There is a good money management system (there are several type for trailing stop loss); EA can work on closed candles, and on current candles; Quickly optimized (the work is maximally accelerated). Very well optimized for EURUSD . Current sets after optimization are in comments. Version MT4: https://

The words powerful, unique and game changing are ones that are often over used when applied to trading indicators, but for the MT5 Quantum Camarilla levels indicator, they truly describe this new and exciting indicator completely.
Why? Because the indicator has something to offer every trader, from the systematic to the discretionary and from swing trading to breakout trading. And it’s not an indicator which is simply used for entries. The Camarilla indicator delivers in all areas, from gettin

Trading the currency markets is a complex business, not least since we are dealing with pairs of currencies, and by inference, pairs of economies. All economies around the world are interlinked, and reflected in the constant ebb and flow of currency strength and weakness. The problem for us as traders is monitoring so many pairs simultaneously, since every pair does not move independently, but reflects the interrelated nature of this market.
The Quantum Currency Heatmap delivers the informatio

The US dollar sits at the heart of all the financial markets. It is the currency of first reserve. It is the ultimate safe haven currency, and it is the currency in which all commodities are priced. It is the currency which every Forex trader should consider – first! Having a view of the US dollar is paramount in gauging market sentiment, attitude to risk, and money flows into related markets and instruments. If you know which way the USD is headed – the rest is easy. The Quantum DXY indicator g

Many Forex traders assume there is no volume in the foreign exchange market. And they would be correct. There is no central exchange, not yet anyway. And even if there were, what would it report? What there is however is activity, and this is captured as tick volume. After all, volume is simply displaying activity, the buyers and sellers in the market. So for volume read activity, and for activity read volume – simple. The MT5 platform delivers tick data which the Quantum Tick Volumes indicator

For aspiring price action traders, reading a candle chart at speed can be learnt, but is a skill which takes years to perfect. For lesser mortals, help is required, and this is where the Quantum Dynamic Price Pivots indicator steps in to help. As a leading indicator based purely on price action, the indicator delivers simple clear signals in abundance, highlighting potential reversals with clinical efficiency. Just like volume and price, pivots are another ‘predictive’ indicator, and a leading i

Many Forex traders have either been told, or have learnt from painful experience, that the Yen currency pairs can be both dangerous and volatile to trade. The GBP/JPY is perhaps the most infamous and volatile of all. No wonder then, that many Forex traders simply stay away from the Yen currency pairs. But then they probably don’t have a very clear idea of where the Yen itself is heading. If they did, then trading the Yen pairs would be much more straightforward. And this is where the Quantum JPY

We don’t want to become boring, but the US dollar is the most important currency for all traders, and not just in Forex. Trading without a clear view of the US dollar is like driving in fog. Sooner or later you are going to crash – it’s just a question of when. That’s why at Quantum we have developed two US dollar indices. The first is the Quantum DXY, and the second is the Quantum USDX. So what’s the difference? Well, the reason we created the Quantum USDX is that many Forex traders believe tha

Have you ever wondered why so many Forex traders get trapped in weak positions on the wrong side of the market? One of the easiest ways the market makers do this, is by using volatility. A currency pair moves suddenly, often on a news release or economic data. Traders jump in, expecting some quick and easy profits, but the move suddenly moves in the opposite direction. This happens in all timeframes, and in all currency pairs. The candle or bar closes, with a wide spread, but then reverses sharp

The Euro Currency Index or EURX , quantifies and displays strength and weakness of the single currency. As the index rises it signals strength in the single currency against a basket of currencies. As the index falls this signals weakness in the euro.
The Quantum EURX is calculated from a basket of four currencies with each currency having an equal weighting of 25%. US Dollar Japanese Yen British Pound Australian Dollar The indicator can be used in one of three ways: First, to identify and con

The Night Lottery EA is a fully automated Expert Advisor that trades at night and relies on price reversion. The EA trades using market orders and uses time averaging to improve performance. This EA works best on EURUSD using the M5 timeframe. A VPS is advisable when trading this system. Check the comments for back test results and optimized settings. View More Products - https://www.mql5.com/en/users/robots4forex/seller#!category=1
Monitoring Signals - https://www.mql5.com/en/signals/author/r

The EA RSI Hill Pro trades on signals from the indicator RSI and moving averages. To determine a more accurate experience, the Stochastic indicator is used.
EA parameters RSI timeframe - Timeframe indicator RSI. Suitable value: M15 M30 H1 Period RSI - The period of the RSI indicator. Recommended value 14. Stoch timeframe - Timeframe indicator Stochastic. Suitable value: M15 M30 H1 % K period - K period of the Stochastic indicator. Recommended value 14. % D period - D period of the Stochastic

The EA strategy This EA has a built-in combined Bollinger Bands Trend indicator, checks the prices trends everytime and opens and closes new orders at the right time; It protects your profit because it is provided with Trailing Stop Loss, Minimum Equity Percentage to allow any trade, Maximum Spread alowed and you can also define the bad time to trade where you define the hours you don't want the EA to trade.
Parameters General Inputs Closes orders with any profit of value (currency): this para
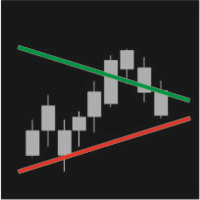
IntradayTrack displays on the price chart daily support and resistance lines based on average volatility instruments for a certain period. In the indicator, it is possible to tilt the line to a certain angle both at the beginning of the trading day and at the end of the trading period.
Parameters Track period - the period of drawing lines (day, week, month) Avg price range - number of days the average volatility is considered for Start value (Avg%) - distance between the lines at the beginning

TurboSystems - новая разработка бота на основе индикатора Parabolic SAR (Parabolic Stop and Reverse system) и автоматического масштабирования всех стопов.
Использование индикатора Входной сигнал формируется при изменении направления индикатора. Когда точки над ценой закончились, и появилась первая точка под ценой – это сигнал на покупку. Если точки под ценой закончились, и появилась первая точка над ценой – это сигнал на продажу (есть на рисунке).
Автоматическое масштабирование Уровни стоп-л

Simple indicator designed to send alerts to email and/or mobile (push notifications) if the RSI exceeds the overbought/oversold limits configured. Explore a series of timeframes and preset FOREX symbols, take note on those crosses where limits are exceeded, and send grouped notifications with the following customizable look: RSI Alert Notification Oversoldl! EURUSD PERIOD_M15 14.71 Overbought! EURTRY PERIOD_MN1 84.71 Overbought! USDTRY PERIOD_MN1 82.09 Works for the following periods : M15, M30
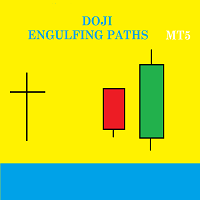
Doji Engulfing Paths enables to get signals and data about the doji and the engulfing patterns on charts. It makes it possible to get opportunities from trends, and to follow the directional moves to get some profits on the forex and stocks markets. It is a good advantage to take all the appearing opportunities with reversal signals and direct signals in order to obtain some profits on the forex market.
System features With fast execution, it allows to register directly the information about t

Открытый интерес (количество открытых позиций) – это количество активных контрактов по фьючерсу. Обычно анализируют не сам открытый интерес, а его изменение. Часто используется трейдерами в дополнение к объему для более полного понимания рыночной ситуации. MetaTrader транслирует открытый интерес со срочного рынка, но не сохраняет его в истории. Поэтому пока единственный вариант, на котором строится большинство подобных индикаторов – это сохранение истории в файл с его последующим воспроизведение
Sato - smart automatic trading robot, which makes trend transactions using up to 15 trend indicators. The robot is developed on the basis of a real trading strategy. Very easy to configure, does not require special knowledge. You can quickly start trading using the default settings. The robot is optimized for 26 currency pairs and does not need optimization. Stop-loss and take-profit are established for each order, and also various methods of order modifications are used. Monitoring : https://
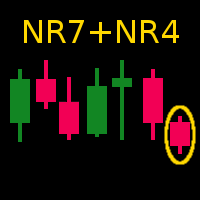
This indicator shows the narrowest bar within the past seven bars, which is known as NR7 in the literature. It will also show the NR4 bar.
The range is variable; thus, you can show any two ranges, e.g. NR7/NR4, NR11/NR6, etc. For the description of this indicator, I will continue to use the default of seven (7) and four (4). If an NR7 bar also happens to be an Inside Bar, it gives a stronger signal. Thus NR7IB are denoted in another color. Sometimes this is known as NR7ID (for Inside Day). I ke
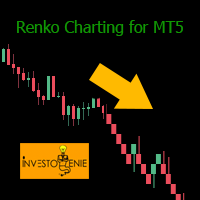
Renko indicator helps develop Renko charts on different symbols.
Advantages Drag and drop the indicator on M1 timeframe of the symbol chart Realtime updates Indicator can be used for Expert Advisors and technical analysis Backtest your strategy using Renko indicator
Parameters BOX SIZE: Input the number of box size. The box size reflects the difference of the symbol price. So, a 50 box size would reflect a 5 pip value difference in a currency pair symbol Show Wicks: If true , high or low of
MetaTraderマーケットは、履歴データを使ったテストと最適化のための無料のデモ自動売買ロボットをダウンロードできる唯一のストアです。
アプリ概要と他のカスタマーからのレビューをご覧になり、ターミナルにダウンロードし、購入する前に自動売買ロボットをテストしてください。完全に無料でアプリをテストできるのはMetaTraderマーケットだけです。
取引の機会を逃しています。
- 無料取引アプリ
- 8千を超えるシグナルをコピー
- 金融ニュースで金融マーケットを探索
新規登録
ログイン