YouTubeにあるマーケットチュートリアルビデオをご覧ください
ロボットや指標を購入する
仮想ホスティングで
EAを実行
EAを実行
ロボットや指標を購入前にテストする
マーケットで収入を得る
販売のためにプロダクトをプレゼンテーションする方法
MetaTrader 5のための有料のエキスパートアドバイザーとインディケータ - 65
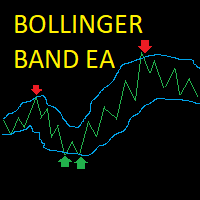
Bollinger Band Scalper EA This EA opens trades when the price hits and bounces off the Bollinger Bands, it closes the trade when it reaches the opposite Bollinger band or if the price reverses into the trailing stoploss. Posisitions are sized dynamically depending on the user's account balance. The EA waits for the price to cross the Bollinger Band and then opens a market order at a set percentage of the bandwidth from the band chosen by the user. The position is sized a percentage of the user's
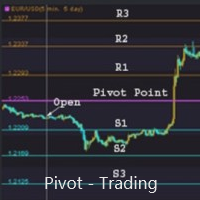
支点交易 : 1.pp 支点 2. r1 r2 r3 , s1 s2 s3 交易实用必备工具指标 波浪自动计算指标,通道趋势交易 完美的趋势-波浪自动计算通道计算 , MT4版本 完美的趋势-波浪自动计算通道计算 , MT5版本 本地跟单复制交易 Easy And Fast Copy , MT4版本 Easy And Fast Copy , MT5版本 本地跟单复制交易 模拟试用 Easy And Fast Copy , MT4 模拟账号运行 Easy And Fast Copy , MT5 模拟账号运行
支点( pivot points) 作为一种交易策略已经很长时间了,最初是场内交易员使用这种方法。使用这种方法通过几个简单的计算就可以了解市场在一天中的去向。 支点法中的支点是一天中市场方向的转向点,通过简单地计算前日的高点、低点和收盘价,可以得到一系列点位。这些点位可能形成关键的支撑和阻力线。支点位,支撑和阻力位被统称为支点水位。 你所看到的市场每天都有开盘价、高价、低价及收盘价(有一些市场是 24 小时开盘,比如外汇市场,通常用 5pm EST 作为开盘和收盘时间)。这些信

Open Risk Profit shows your current risk or possible profit of all open positions. Total open risk is your loss if all positions run into the stop loss.
Total open profit is your profit if all positions reach your take profit.
Total float is your current profit or loss of all positions. The program also breaks down the information into the individual symbols. For example, you can monitor how much is your current profit and your potential risk in EURUSD, no matter how many individual positio

GRat Clusters is an indicator that shows various data in the form of clusters on a price chart: volume, delta, ratio of sales and purchases, etc. It allows you to visually see the market profile in real time and on history at a given depth. Capabilities 1.8 types of cluster data: volume, delta, purchases and sales , volume and delta, imbalance between sales and purchases , volume profile, delta profile, buy and sell profile. 2. A cluster period can be either any available in MT5 timeframe or

Adapted from the award winning international best seller (Short Term Strategies That Work) by Larry Connors and Cesar Alverez in 2008, this concept was retested 10 years after the book published and that will give you an idea of the concept if it still works. Take the last 10 years as walk forward and this strategy is added with a twist to risk management with arbitrary 5% stop loss and exit day counted as calender days instead of trading day. This EA works on dual mode, Long and Short. Origin

Killer Market MT5 is an advisor with a system for "Resolving" a basket of unprofitable orders, a news filter, a filter for open positions on other trading instruments and the function of sending trading signals to your Telegram channel.
The Expert Advisor can be used to restore unprofitable positions on the account as a utility to bring trades to breakeven that you opened with your hands or other Expert Advisors.
Works inside a linear regression channel, input on several conditions. The s

ブリックダイアグラム-別の取引方法 数え切れないほどのチャートのローソク足で混乱しているトレーダー、または線の描き方や支持線と抵抗線の描き方がわからない場合は、現時点で自分に合った別の取引方法を見つける必要があります。NS。ドライバーが繰り返し問題に遭遇した後、完全なオーバーホールのために停止するのと同じように、同じことがトランザクションにも当てはまります。 レンガチャートは、日中のトレーダーに簡単な取引方法を提供します。実際、この方法は川崎汽船と同じ歴史があり、日本でも始まりました。 ブリックチャートを定義するために、それらはセットポイントまたはベーシスポイントの価格トレンドのみを記述します。たとえば、10ポイントのブリックチャートは、価格変動の10ポイントの上昇傾向または10ポイントの下降傾向のみを表すことができます。 ブリックダイアグラムには、価格が時間に関係しないという独自の利点があります。つまり、価格の変化が設定値に達したときにのみ、新しいブリックダイアグラムが表示され、ブリックダイアグラムによって価格のバリが削除されるため、感覚から非常に快適です。

Ing (inguz,ingwar) - the 23rd rune of the elder Futhark ᛝ, Unicode+16DD. Add some runic magic to your trading strategies. The correct marking of the daily chart will indicate to you the successful moments for counter-trend trading. Simple to use, has high efficiency in volatile areas. Be careful in lateral movements.
Signals ᛝ are generated when the main lines of construction intersect.
Red arrow down - recommended sales
Blue up arrow - recommended purchases
rare purple arrows indicate

An indicator of patterns #45 and #46 (Three Falling Peaks and Three Rising Valleys) from Encyclopedia of Chart Patterns by Thomas N. Bulkowski. Parameters: Alerts - show alert when an arrow appears Push - send a push notification when an arrow appears (requires configuration in the terminal) PeriodBars - indicator period K - an additional parameter that influences the accuracy of pattern shape recognition. The smaller the value is, the smoother the row of peaks/valleys should be, so fewer patt
An indicator of patterns #50 and #51 ("Triple Bottoms", "Triple Tops") from Encyclopedia of Chart Patterns by Thomas N. Bulkowski.
Parameters: Alerts - show alert when an arrow appears Push - send a push notification when an arrow appears (requires configuration in the terminal) PeriodBars - indicator period K - an additional parameter that influences the accuracy of pattern shape recognition. The smaller the value is, the smoother the row of peaks/valleys should be, so fewer patterns will

Moving average, moving average (English Moving average, MA) is a general name for a family of functions, the values of which at each point of determining the level of some average value of the original function for the previous period.
CalcPipsOn - In order to add rozruhunok on the chart, you must activate this field.
The previous development of a variant of this indicator differed in that it had an extended functionality for calculating averaging in the set, as well as advanced possibili

An anchored Vwap With Arrows is an indicator that includes a moving average weighted by volume that allows you to plot on a bottom or a top. Usually banks and institutions measure an average price, this average price is a price range where they agree to make a trade. Using the logic of anchored vwap with arrows it is possible to understand that if the price breaks the vwap it means that someone with enough buying and selling power has lost control. You can use vwap anchored with arrows in any ti

Market structures, Market balance, Range breakouts This tools helps to identify areas of market ranges, structures and plots colored boxes on breakout of those areas. User is given the option to receive alerts and notifications on the formation of the blocks. The tool has the ability to become an essential part of a technical trading system or even pure price action trading. Usage:- An essential tool for price action or technical traders. More information in the blog

Horizontal volume bars, Cluster analysis, Volume profile Volume in Range gets information about the accumulated volume in a specified vertical range and period in bars. The received data is then plotted on the chart as rectangular boxes with the volume quantity inside. Usage:- The tool acts as a support resistance levels but most importantly it should be used to check in which direction the price breaks out of the significant levels formed by this indicator and then actions to be taken on correc

The QRSI indicator is one of the most important and well-known indicators used by traders around the world. By its nature, the QRSI indicator is an oscillator, that is, it fluctuates in a certain zone, limited by the maximum (100) and minimum (0) values. Specifically, this indicator works according to an accelerated algorithm, but this is not its only difference. This indicator implements a more advanced calculation based on the Relative Strength Index algorithm. The peculiarity of the implemen
An indicator of pattern #55 ("Dead cat bounce, inverted") from Encyclopedia of Chart Patterns by Thomas N. Bulkowski.
Parameters: Alerts - show alert when an arrow appears Push - send a push notification when an arrow appears (requires configuration in the terminal) PeriodBars - indicator period ArrowType - a symbol from 1 to 17 ArrowVShift - vertical shift of arrows in pixels. Note. Arrows appear on a forming bar and do not disappear. It cannot be guaranteed that the indicator recognize
An indicator of pattern #54 ("Dead cat bounce") from Encyclopedia of Chart Patterns by Thomas N. Bulkowski.
Parameters: Alerts - show alert when an arrow appears Push - send a push notification when an arrow appears (requires configuration in the terminal) PeriodBars - indicator period ArrowType - a symbol from 1 to 17 ArrowVShift - vertical shift of arrows in pixels. Note. Arrows appear on a forming bar and do not disappear.
It cannot be guaranteed that the indicator recognizes the pat

An indicator of patterns #24, #25, #26 and #27 ("Head and Shoulders", "Complex Head and Shoulders") from Encyclopedia of Chart Patterns by Thomas N. Bulkowski.
Parameters: Alerts - show alert when an arrow appears Push - send a push notification when an arrow appears (requires configuration in the terminal) PeriodBars - indicator period K - an additional parameter that influences the accuracy of pattern shape recognition. The smaller the value is, the smoother the row of peaks/valleys shoul

This indicator is an oscillators that shows the real strength of 8 main currencies in the Forex market. It recreates a basket of the main currencies and applied a True Strength Indicator on each of them. The calculated real currencies are: EUR - USD - GBP - CHF - JPY - AUD - CAD - NZD. It clearly identifies overbought and oversold ares. From reading the oscillator you can choose the right Forex symbol to trade.
Future versions: I am working on adding alarm and a real buy sell signal, choos
An indicator of patterns #9 and #10 ("Cup with handle") from Encyclopedia of Chart Patterns by Thomas N. Bulkowski.
Parameters: Alerts - show alert when an arrow appears Push - send a push notification when an arrow appears (requires configuration in the terminal) PeriodBars - indicator period K1 - an additional parameter that influences the accuracy of recognition and pattern shape (the lower the value, the smoother the cup edge is) K2 - an additional parameter that influences the accuracy o
Bollinger Bands (BB) are similar to Envelopes. The difference between them is that the boundaries of the Trade Bands (Envelopes) are located above and below the moving average curve at a fixed percentage distance, while the Bollinger Bands are plotted at distances equal to a certain number of standard deviations. Since the magnitude of the standard deviation depends on volatility, the bands themselves adjust their width: it increases when the market is unstable, and decreases in more stable per

Implements a channel based on integrated comparison of moving average values with improved functionality. As a result, the chart displays a channel of deltas of moving averages in the center line and an indentation of the channel boundaries over a specified range.
What is the channel? This is the price range (limited), in which all its dynamics (movement) takes place over a certain period of time. This method is very old, the Forex channel strategy dates back to a long time, when the theory

Implements an oscillator based on a simple comparison of the last two moving average values with improved functionality. As a result, the graph displays the delta of the two moving average values. In the case of a single value, the moving delta is calculated relative to the last two candles, which price of comparison will be specified in the Price parameter. The delta of two values is often used to determine the trend, depending on the length of the moving averages, it can be a longer or sh
Moving average, moving average (English Moving average, MA) is a general name for a family of functions, the values of which at each point of determining the level of some average value of the original function for the previous period.
This indicator is suitable for those who are interested in the classic calculation method but with improved functionality. There is a version for both MT4 and MT5.
Moving averages are commonly used in time series data to smooth out short-term fluctuations a

Implements a channel based on the moving average indicator with improved functionality.
Moving average, moving average (English Moving average, MA) is a general name for a family of functions, the values of which at each point of determining the level of some average value of the original function for the previous period. The channel moves up and down relative to the moving average by a specified number of points.
This indicator is suitable for those who are interested in the classic calc
An indicator of patterns #13 - #20 ("Double Tops" and "Double Bottoms", types Adam-Adam, Adam-Eva, Eva-Adam, Eva-Eva) from Encyclopedia of Chart Patterns by Thomas N. Bulkowski. Adam - sharp tops/bottoms, Eva - flat ones. Parameters: Alerts - show alert when an arrow appears Push - send a push notification when an arrow appears (requires configuration in the terminal) PeriodBars - indicator period K - an additional parameter that influences the accuracy of pattern shape recognition. The smalle
An indicator of patterns #2 and #3 ("Broadening formation right-angled and ascending" and "Broadening formation right-angled and descending") from Encyclopedia of Chart Patterns by Thomas N. Bulkowski.
Parameters: Alerts - show alert when an arrow appears Push - send a push notification when an arrow appears (requires configuration in the terminal) PeriodBars - indicator period K - an additional parameter that influences the accuracy of pattern shape recognition. The smaller the value is, t
An indicator of patterns #1 and #4 ("Broadening Tops" and "Broadening Bottoms") from Encyclopedia of Chart Patterns by Thomas N. Bulkowski. Version 1: bottom, top, bottom, top, top breakout. Version 2: top, bottom, top, bottom, top breakout.
Parameters: Alerts - show alert when an arrow appears Push - send a push notification when an arrow appears (requires configuration in the terminal) Variant1 - show version 1 of the pattern Variant2 - show version 2 of the pattern PeriodBars - indicat

MT4バージョン: https://www.mql5.com/en/market/product/72558 この戦略は、最も重要な サポートと レジスタンスのレベルを跳ね返すことに基づいています。 このアルゴリズムは、リスクの高い戦略を使用していません。各取引は、いくつかのレベルの管理によって保護されています。 適応型トランザクション追跡アルゴリズムが使用されます。 この戦略は、100%のシミュレーション品質で、利用可能な履歴全体にわたって正常にテストされています。 実際の市況に近いスリッページとコミッション。 開発会社の公式ウェブサイト、あなたはここで見つけることができます MQL5プロファイル 私たちの公開チャンネルへようこそ MQL5Сhannel その他の製品 Varko Technologies
推奨事項
通貨ペア: GBPUSD、EURUSD 時間枠:M1
ブローカーサーバーには、ネットワーク遅延が最小限のVPSまたはサーバーを使用してください。 スプレッドと手数料が最も低いブローカーを使用してください。 実際のアカウントで使用す

The robot uses one of the most used indicators in Asia:
* ICHIMOKU CLOUD *
There are two trading strategies:
Crossing of Tenkan and Kijun lines and; Kumo lines crossing.
Know our products
Position openings are based on the parameters identified as signals, if you activate all the robot will issue a trading order only if the number of signals is greater than the minimum stipulated by the user.
This Expert Advisor (EA) works on HEDGE (Forex, etc.) and NETTING (Bovespa, etc.) accou
Trading Strategy The Leicester expert advisors uses three exponential moving averages to determine entry positions. Trend Line Slow Moving Average Fast Moving Average Crossovers between the fast moving average and the slow moving average will create sell signals. If prices are below the trend line then only sell positions will be opened. Vice versa for when prices are above the trend line, only buy positions will be opened. Inputs/Features
Candles after cross - Number of candles to wait before
An indicator of patterns #5 and #6 ("Wedges, ascending, broadening" and "Wedges, descending, broadening") from Encyclopedia of Chart Patterns by Thomas N. Bulkowski.
Parameters: Alerts - show alert when an arrow appears Push - send a push notification when an arrow appears (requires configuration in the terminal) PeriodBars - indicator period ArrowType - a symbol from 1 to 17 ArrowVShift - vertical shift of arrows in pixels ShowLevels - show levels ColUp - color of arrow up СolDn - color

Ferramenta derivada do DR Assistant, a versão Lite conta com recursos semelhantes, mas sendo mais específica em sua aplicação, destina-se exclusivamente ao uso para gestão de ordens abertas a partir de suas funções. Deste modo, quaisquer outras negociações ou posições abertas por outras ferramentas ou manuais serão ignoradas pelo Assitant Lite. Os parâmetros e configurações disponíveis, bem como suas principais funções são: - Take Profit e Stop Loss: duas opções de Steps, em pontos, para ambas a

This is MT5 version of ChristMyHedge . It should be referred to as ChristMyHedge-for-MT5.
Like its MT4 counterpart, the EA/signal runs on Daily (D1) time-frame on 12 pairs: GBPUSD, EURUSD, USDCHF, USDCAD, NZDUSD, USDJPY, AUDUSD, GBPEUR, EURJPY, CADJPY, AUDJPY and EURCHF concurrently, with a recommended minimum of 150USD equity per 0.01 lot size.
Default parameters may be OK, and it's best to run on VPS, if you do not have 24/5 Internet and electricity.
However, the newer version of Christ
If you are looking for a safe ea to start trading in index this is your ea
This ea performs a market entry that starts the algorithm at the time of day that the trader decides. We recommend it to be 1 min after the opening of the index.
It also allows you to say close the operation at the close of the session or keep the cycle open.
It only performs a daily cycle that starts at the scheduled time and remains alive until it exits for profit or session close.
This system is designed to

作業ロジック
ダウ戦略エキスパートアドバイザーは、「トレンド保持」のChalseDow理論に基づくエキスパートアドバイザーです。
エキスパートアドバイザーは選択されたTFを使用します。前のバーが上がっていた場合、それは買いを開き、前のろうそくの安値の後ろにストップを置くことを意味します(前のろうそくからのオフセットにフィルターを設定することが可能です)、次に、現在のろうそくが閉じた後、ストップロスは再び安値を超えて移動するため、足でノックアウトされなくなるまで取引は市場で保持されます。
中長期のトレンド商品の取引に最適です。取引を開始する前に、トレンドの存在について商品の独立した分析が必要です。 m1-MNからのすべての時間枠で、バーによるトレーリングポジションに最適です。
取引には、株式、通貨、金属、指数が適しています-一般的に言えば-中期的な傾向がある金融資産のほとんど。
推奨される時間枠はD1です。
ポジションは、前のバーの高値/安値を価格の方向に突破した後に開かれます。
ストップロスは、ローソク足の前のピークの後に設定されます。
トレーディング

パネルには、すべての初心者が処理できる最も直感的なインターフェイスがあります。
SLp列で-SLサイズをピップで指定する必要があります。値が灰色に変わり、同時にベイ/セルボタンも非アクティブになっている場合は、ブローカーによって設定される前に許可されていた値よりも小さいSL値を指定しています。
[TP%]列で、アカウント残高の%でTPを示します。設定では、この指標の計算内容に基づいて、資本、残高、または自由証拠金を選択できます。
R%列では、取引のリスク値を設定できます。
Insボタン。 -設定値ですぐに注文を開くことができます。無効になっている場合は、取引のパラメータをチャートに直接プリセットできます。 Pro Trading Panel - https://www.mql5.com/en/market/product/72256
上部の左上隅にあるマイナス記号をクリックすると、グラフのパネルを最小化できます。
パネル名の下にある+ボタンと-ボタンを調整することで、パネル自体のサイズを拡大または縮小することもできます。
保留中の注文を開いてBUへ

あなたは小さなstoplossを持つEAをしたいですか? あなたはちょうど市場に出ているEAをしたいですか?
このEAは、dax(ドイツ指数)、またはDow Jonesのブレイクアウトに作用しています。 それは、市場が開いたときにのみ購入し、10分以下のウィンドウで購入しています。
この戦略(はい、それがあります2で使用することができます異なる戦略3異なるチャート)タイトなストップロスと多くの場合、数秒以内に到達するtakeprofitを持
戦略はよく証明されています。 私は良い結果を得て何年も手動でそれらを使用してきました。 設定ファイルは、私が使用する設定のコメントセクションの下に見つけることができます(あなたが時間をかけてより良い何かを見つけた場合は、TP
このEAの特徴 それだけで一日と戦略ごとに一つの貿易を取ります(時には貿易なし) すべての取引でTPとSLを使用します(SLとTPがタイトであるため、EAに組み込まれています) 買いと売りの逆指値注文の使用の可能性 ノー-マーチンゲール ヘッジなし 裁定なし 複数の取引はありません
プロモーション価格:$
戦略ロジック Pump and Dump for mt5 Expert Advisorは、トレーダーがトレーダーのために作成した完全に自動化されたトレーディングアドバイザーです。 戦略は「より安く購入し、より高価に販売する」です。価格が大幅に上昇/下降した後、注文が開始されます。 ポンプアンドダンプ戦略の基本的な意味は、価格が下がると資産を安く購入し、価格が上がると資産を高く売ることです。 市場での急激な価格変動の後、反対方向に大幅な価格ロールバックが発生し、いわゆる「ヘアピン」が描画され、EAが力強い成長または価格の下落の瞬間を捉え、に基づいて市場に参入することにお気づきかもしれません。これらの信号。ビデオとスクリーンショットで詳しく説明します。
アドバイザの戦略は、iPumpインジケーターを使用した%価格変動の分析に基づいて資産の買われ過ぎ/売られ過ぎゾーンを識別するアルゴリズムに基づいています。インジケーターは資産の買われ過ぎ/売られ過ぎレベルを評価し、これに基づいてアドバイザーは取引された商品の最適な売買ゾーン、そして市場に参入します。
利点 アカウントドローダウン

Size Bars – индикатор отображает на графике максимальный, минимальный, текущий и средний размер баров (свечей) за выбранный период.
Отображаемые параметры индикатора Size Bars: 1) Текущий размер бара в писах (по максимум/минимум, тело бара). 2) Максимальный, минимальный и средний размер свечей BUY . 3) Максимальный, минимальный, средний размер свечей SELL . 4) Количество свечей BUY и количество свечей SELL . 5) Среднее количество свечей подряд BUY и SELL . 6)

This DYJ OonClickClose help you to close all orders having profit immediately with only ONE CLICK, its work is very fast. You can choose which symbol you want or close all symbols so it will helpful for you in your trading to manage trading faster. This EA can quick close all Buy and Sell Orders by a selected symbol or total, And delete all pending orders. It includes dynamic target profit tracking function. The software has manual transaction buttons buy and sell. It is a management softw
不採算注文のバスケットを「解決」するためのシステム、ニュースフィルター、他の取引商品のオープンポジションのフィルター、および取引シグナルをテレグラムチャネルに送信する機能を備えたグリッドアドバイザー。
エキスパートアドバイザーは、手または他のエキスパートアドバイザーで開いた取引を損益分岐点にするユーティリティとして、アカウントの不採算ポジションを復元するために使用できます。
線形回帰チャネル内で機能し、いくつかの条件で入力します。信号は、線形回帰チャネルの方向、チャネル幅、指数移動平均の交点、1日の平均ボラティリティ、次数平均を使用します。
主な機能: 戦略に含まれるシグナルの取引 ボタンでの取引 ニュースフィルター 他のトレーディング商品のオープンポジションでフィルタリング アカウントの不採算ポジションの決済 位置平均 ポジションのトレーリングストップ利益 損益分岐点に転送 電報にトレードシグナルを送る 電報にニュースを送る
グリッドステップが構成され、価格が私たちに反する場合、一定数の注文の後、アカウント回復機能(ドローダウン削減)がアクティブになり、最も
Auto set stop loss and take profit and trailing on any open position on chart , Wen you open positions manually it will manage the trade and set the stop loss/take profit and trailing stop based on Average true range calculation with risk reward factor default 1:3 . also you can use normal stop loss take profit and trailing . Inputs Stop Loss (in pips) Take Profit (in pips) Trailing Stop (in pips) Trailing Step (in pips) Use ATR = true ATR period Risk Reward
chart outpu

Auto SL and TP is a program that adds StopLoss and TakeProfit automatically, so you don't need to worry about it anymore. The program checks at any time if StopLoss and TakeProfit are set correctly!!! You can enter your values via the input parameter.
Input-Settings StopLoss: Boolean value, if set to true, will be executed. StopLoss in Points TakeProfit: Boolean value, if set to true, will be executed. TakeProfit in Points

Based on pending orders. You decide what the distance to the pending order is. Very easy to use and optimize. How it works? EA opens orders in accordance with the trend (if the parameter Trend = On) and then builds succeeding trades if the move goes against it. And more specifically ... sets the distance between orders. The distance can be fixed or variable (different for all orders). This will help increase the trading system flexibility.
Designed for major currency pairs. For Expert Adviso

Hi there! Since I am starting commercial and non-commercial product publishing I would highly appreciate: If you like this product, please rate it. That will help to promote not only this product, but indirectly another ones. So, such promotion will help to make some money from commercial products. Thus, I will have opportunity to fund my another directions of trading researches like bot development using mql4 and mql5 programming languages as well as python written products like crypto bots. If

The Spike King Indicator is, as the name suggests, a forex trading tool that recognizes spikes in the market. This is a perfect indicator for reversal traders. A spike often indicates a turn-around moment. The best way to use that gauge is to apply it to your favourite trading system as a filter. ONGOING PROMO!!! The indicator is displayed in a separate window placed just below the main trading chart, as well as a confirmation arrow with shows us in the chart fr every new signal. HAS AN INBUILT
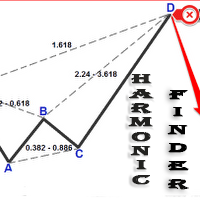
Automatically finding harmonic patterns has been made easy for traders. For those who do not know harmonic patterns : it is a method of technical analysis based on Fibonacci ratios in the markets and patterns made of these. Kind of like patterns such as triangles and double tops, but with precise measurements which makes computerized measuring tools especially appealing for trading these patterns. Some highlights from this Indicator include: Efforts to reduce the amount of screen clutter thro
Robot functions: 1. TP and SL 2. TSL 3. BE 4. Working time selection function 5. Disconnection of the robot's work after obtaining a given profit or loss. A robot designed to trade on all currency pairs, cryptocurrencies and synthetic indices. Works on any time frame. Tests have shown its great effectiveness in action. If you need more information about the robot, visit my YT channel and use the Telegram messenger: @Mati_FX
100 % PER MONTH PROFIT---- MY NEW SIGNAL HERE -------> https://www.mql5.com/en/signals/2162238?source=Site+Signals+My#
What Is the Average True Range (ATR)? The average true range (ATR) is a technical analysis indicator, introduced by market technician J. Welles Wilder Jr. in his book New Concepts in Technical Trading Systems, that measures market volatility by decomposing the entire range of an asset price for that period. The true range indicator is taken as the greatest of the fol
Requirements Hedging account!
EA work with any brokerage conditions
EA should run on a VPS continuously
Information
Working symbol EUR, USD, GBP, GOLD, STEP INDEX, V10 (1s) any pair
STANDARD ACCOUNT
Working Timeframe: H1
Min deposit: $500 (1 Pair)
Min leverage 1:500 CENT ACCOUNT
Working Timeframe: M15/M30
Min deposit: $500 CENT (4 Pair)
Min leverage 1:500 Setfile for currency Here
Setting for DARK MAGIC MT5
MM = TRUE (Automatic lot calculation according to your risk
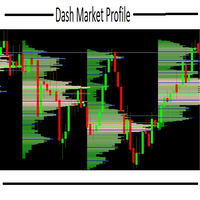
this indicator is essential when it's necessary to identify trade locations on chart. You can initially get an idea of the candlestick's direction with other graphical tools and then identify the best regions with the DMP. The Dash Market Profile is a statistical indicator, that mean it is an indicator that is based on mathematical calculations, identifying the best regions and observing the candles of the best regions to trade. The financial market is not as easy as it seems, it is necessar

A indicator to show saturation in buying or selling With fast and complex mathematical calculations Easily find saturation points for buying or selling Can be used in all symbols and time frames with many signals Can be combined with different indicators and different time frames With simple settings and simple working methods
Features: Can be used on all symbols Can be used in all time frames Can be used in all markets (Forex, stock, etc.) Large number of signals Same performance on all t

High Probability Reversal Arrow Indicator The indicator looks for trend exhaustion areas, and plots Buy/Sell arrow after on confirmation of trend exhaustion. Signals can also be shown as popup alerts, or be sent as e-mail or mobile phone notification. Trades can be taken on breakout of the signal candle. Inputs
Signal Type: Aggressive/Normal History Bars : Can be set to 0 (zero) to show all historical signals, or can be set to a limited number of bars for faster execution. Show Alert : True/F
Modifiable Moving Average Cross Expert Advisor
This Expert Advisor (EA) is based on the cross of two moving averages ; i.e; “ Moving Average 1 ” and “ Moving Average 2 ”.
“Moving Average 1” has to always be greater than “Moving Average 2”. (So that it logically makes sense; unless one is just trying out different stuff). If “Moving Average 2” crosses above “Moving Average 1”, the program will enter a BUY trade . If “Moving Average 2” crosses below “Moving Average 1”, the program will enter

Crypto Mama version 1.10 introduces a significant change. The robot now possesses the capability to execute various types of orders, including Limit, Stop, and Market orders. The "Reverse" option is also integrated but is deactivated by default. However, users can activate it when necessary. By default, the robot initiates Market orders and is configured to trade on the following symbols: BTCUSD/H1 timeframe. When using the robot on the listed symbols, prioritized by quality, users must select a

The small control panel which includes an essential set of tools for major trading styles.
Key advantages: The most important tools for trading in one small app. Do not block your graph with large panels. Trading Essentials (TE) uses minimal design, can be dragged and shows important trading parameters. Quickly change trading parameters by using mouse wheel, keyboard, or +/- buttons on the panel. Did you know that, using 3:1 profit/loss ratio in order to breakeven, you have to be only 25% ri

Real Trend Zigzag shows the real trend of a market, u nlike the default Zigzag indicator. It calculates the trend in real time and shows green lines for upwards trends, red lines for downward trends and blue lines for no trends. Regarding the old slogan "the trend is your friend" it helps you to decide if should open a buy or sell position. If you are looking for a multi timeframe zigzag, take a look at the PRO version: https://www.mql5.com/en/market/product/72071 MT4 version can be found her
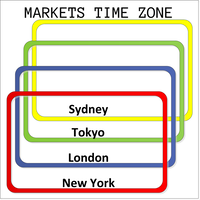
This product displays open and close time zones for four major markets New York, London, Sydney and Tokyo. It spares you the effort to manually check for market hours by conveniently displaying colored zones for different market hours. For serious traders it is essential to understand your preferred currency pair behavior with respect to major markets open and close times. This EA comes in handy when you want to integrate market hours with your other analysis tools all in one visual display. -Th
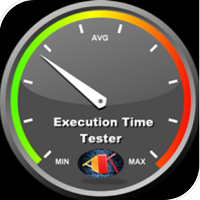
This Expert Advisor measures the broker execution time in milliseconds. Every 10 seconds (Refresh Seconds) , the EA opens a buy stop order far away from current price (1.5 x Ask), then modifies the (price, stop loss and take profit) of the created order by 5 pips then deletes it immediately.
Inputs Refresh Seconds: Number of seconds for each re-test, default 10 seconds.
Display Last: Last Execution time Min: Fastest execution time Max: Slowest Maximum execution time Avg: Average ex

Error EA is designed to be a forex trader, trading currency pairs. The robot is capable of trading across timeframes ranging from M15 to H6. When trading on higher timeframes, from H1 to H6, the robot is characterized by higher precision and lower trading frequency. On the other hand, when trading on lower timeframes, from M15 to M30, the robot has a higher trading frequency. Additionally, the robot achieves excellent results on various currency pairs across different timeframes. This fact clear

Fully featured Pivots and Levels indicator Pivots: Floor (normal), Woody, Camarilla, Fibonacci Levels: ATR, Historical Volatility with standard deviations, Close Price Volatility with standard deviations
Features: - 4 +/- levels
- MTF, pivots/levels based on Daily, Weekly, 4hr or even 15min - Hour and minute time offset
- Texts with prices and pip distances to central pivot/level - Inputs for Camarilla/Fibonacci/ATR/Volatility levels
- Alerts, popup, push, email, sound, live or completed ca

Description:
The Wall of Worry indicator allows you to assess market sentiment and possible reversals. The indicator represents three lines that are displayed in a separate window.
Black line (trend) - the amount of volumes in the candle body.
Red line (bears) - the amount of volumes in the upper shadow of the candlestick.
Blue line (bulls) - the amount of volumes in the lower shadow of the candle.
The idea is based on "Wall of Worry" - this is the periodic tendency of financial marke
An indicator of patterns #52 and #53 ("Falling/rising wedges") from Encyclopedia of Chart Patterns by Thomas N. Bulkowski.
Parameters: Alerts - show alert when an arrow appears Push - send a push notification when an arrow appears (requires configuration in the terminal) PeriodBars - indicator period K - an additional parameter that influences the accuracy of pattern shape recognition ArrowType - a symbol from 1 to 17 ArrowVShift - vertical shift of arrows in pixels ShowLevels - show lines
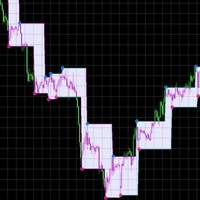
The ZigZag indicator, which has already become common and familiar to any trader, has acquired new forms and received additional reinforcement by including the results of Parabolic SAR analysis in its team. The tandem of these two indicators shows excellent accuracy in determining the direction of the trend and timely receiving a signal about its reversal. The main signals on the chart are red and blue markers (if desired, the colors can be changed). Blue marker - we start selling, red-purchases
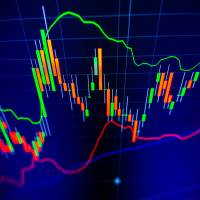
The indicator calculates reversal points based on the past trend and forms a channel (outer) on this basis. This elapsed time span from which the reversal points are determined can be specified in the settings.
An inner channel is also drawn in white. The trend continues in this channel, if there is a sideways trend. Here the upper / lower line form the possible turning point.
The indicator is suitable for all trading areas, whether forex, crypto, metals, indices or futures. All areas trade
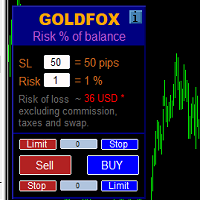
ストップロス(ピップ単位)と口座残高からのリスクのパーセンテージを考慮した取引ロットの自動計算。 Expert Advisorパネルは、左上のチャートにあります。アドバイザのパネルで、ピップ単位のストップロスのサイズとバランスからのリスクのパーセンテージを選択できます。保留中の注文の現在の価格からの偏差をピップで設定できます。赤い色は、ストップロスがトリガーされたときに失う可能性のある預金通貨の金額を示します。この金額には、手数料、スワップ、税金は含まれていません。
主要な外国為替通貨ペア、XAUUSD(ゴールド)、BTCUSD、ETHUSDには、このアドバイザーを使用することをお勧めします。他の機器については、計算の特殊性を考慮すると、エラーが発生する可能性があります。ほとんどの外国為替商品では、ドットの後に5桁のアカウントをお勧めします。
説明
-損失のリスク。預金通貨のリスク額は、アドバイザーの情報パネルに赤で表示されます。この値は、商品の証拠金がこのリスクに対して十分であり、SLフィールドでピップサイズを正しく指定している場合、未決済注文(または

Trade Dragon Pro An expert trade utility perfect for intraday, mid-term and long-term trading. Trade Dragon Pro generates stop-loss and take-profit levels for you based on the previous Tokyo-Sydney session.
In-built risk management Configurable number of entries On-the-fly risk and SL and TP adjustment (TP is based on SL) In-built trade manager for auto break-evens and trailing stop losses Per-day support and resistance levels Pending levels menu 3 MA trend signal Trade projection to show you
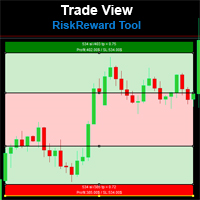
Risk Reward Tool , It is easy to use. With this tool you can see the rates of profit loss profit. You can see your strategy and earnings reward status of your goals.Double calculation can be done with single tool. Move with drag and drop. You can adjust the lot amount for calculations. The calculation results are shown in the comment section. There may sometimes be graphical errors during movements. Calculations works at all currency. Calculations All CFD works. Updates and improvements will co

The EA trades using two MA indicators - Moving Average and ADX - Average Directional Movement.
Buying and selling is possible only when a new bar is formed. Buy: MA is rising and the current closing price is above it. A buy order is placed only if there is a buy signal and there are no open long positions. Sell: MA is falling and the closing price is below it. A sell order is placed only if there is a sell signal and there are no open short positions. ADX will not allow trading if the market
MetaTraderマーケットは、他に類のない自動売買ロボットやテクニカル指標の販売場所です。
MQL5.community ユーザーメモを読んで、取引シグナルのコピー、フリーランサーによるカスタムアプリの開発、支払いシステムを経由した自動支払い、MQL5Cloud Networkなど、当社がトレーダーに対して提供するユニークなサービスについて詳しくご覧ください。
取引の機会を逃しています。
- 無料取引アプリ
- 8千を超えるシグナルをコピー
- 金融ニュースで金融マーケットを探索
新規登録
ログイン