YouTubeにあるマーケットチュートリアルビデオをご覧ください
ロボットや指標を購入する
仮想ホスティングで
EAを実行
EAを実行
ロボットや指標を購入前にテストする
マーケットで収入を得る
販売のためにプロダクトをプレゼンテーションする方法
MetaTrader 5のための有料のエキスパートアドバイザーとインディケータ - 35
ゴールデンキャンドルスティック・トレンド(ベータ版)
シンプルさと明瞭さを重視するトレーダーのために設計された、トレンド追従型のエキスパートアドバイザー(EA)「ゴールデンキャンドルスティック・トレンド」をご紹介します。このベータ版では、平均足(Heikin Ashi)のローソク足パターンを活用してトレードを自動化。今後、さまざまなアップデートや改良を予定しています。 現在の機能: 平均足によるトレンド検出: 純粋な平均足のロジックに基づいてトレンドを識別し、市場ノイズをフィルタリングします。 自動売買機能: トレンドシグナルに基づいて自動的に売買を行うため、放置型トレードに最適です。 パラメータのカスタマイズ: ロットサイズ、ストップロス、テイクプロフィットを自分の戦略に合わせて設定可能。 今後のアップデート予定: コミュニティからのフィードバックに基づいた、ユーザー希望の新機能。 ベータ版に参加するメリット: 先行アクセス: 割引価格でEAを入手し、フィードバックを通じて開発に貢献できます。 無料アップデート: 将来のすべての改良が追加料金なしで提供されます。 カスタム機能の追加

All-in-One Position Controller for Your EA Plug and Play — No need to write trade handling code again Full Source Code | Compatible with any EA Feature Close all positions Close profit on Friday Close profit by amount Close profit by patial Get pivot point Open buy and control risk management Open sell and control risk management Support MT5 platform only Support overload method

Golden Teacher – XAUUSD H1 Trading System The Golden Teacher Trading System is a precision-coded expert advisor engineered for XAUUSD on the H1 timeframe. Designed with adaptability and tactical control at its core, it leverages volatility-sensitive logic, momentum break filters, and high-resolution market structure analysis to navigate the gold market’s dynamic behavior with strategic precision. The system is equipped with advanced risk management tools, allowing users to customize their exposu

SusGhos – WAP level intersection indicator with visual signals, the indicator displays only arrows on the chart in those places where the WAP levels of the younger period intersect with the level of the older period. This helps to identify potential points of price movement direction change and use them to enter the market along the trend or at a reversal.
Visual signals in the form of arrows:
Green arrow up — intersection from bottom to top (bullish signal).
Red arrow down — intersection fr

The Double Reaper bot is a trading robot with multiple strategies, and you can use any single one at a time. However you can also use any two of them together to better refine your entries and add confluence. Its entry conditions are RSI - If you select this strategy, it would only take a buy when your preferred RSI period crosses above the oversold level and closes above. And vice versa for sell. You can also set how many candles should pass after the close above the oversold level incase of a

مؤشر Smart Trend Candles هو أداة فعّالة في منصة MetaTrader 4، تجمع بين عناصر تحليل فني متعددة لتحديد اتجاهات السوق وقياس قوة المشترين والبائعين. يوفر هذا المؤشر متعدد الاستخدامات إشارات مرئية واضحة تُحسّن قرارات التداول الخاصة بك. الميزات الرئيسية 1. تحديد الاتجاه يستخدم شموع Heikin-Ashi المعدلة (اختياري) لتصفية ضوضاء السوق يتضمن متوسطًا متحركًا (فترة قابلة للتكوين) لتأكيد الاتجاه تنفيذ مؤشر القوة النسبية لقياس الزخم 2. قياس القوة تشير الشموع المرمزة بالألوان إلى شدة ضغط الشراء/البيع تحليل الحج

GOLD PRO TRADING SYSTEM Professional Gold Trading Expert Advisor with Verified Performance EGA GOLD PRO corkyxau4s is a sophisticated algorithmic trading system specifically designed for the Gold (XAUUSD) market. This state-of-the-art Expert Advisor uses advanced technical analysis and proprietary entry algorithms to identify high-probability trading opportunities in one of the world's most lucrative markets. PROVEN PERFORMANCE €16.93M profit generated in just 4 months of trading Positiv

Alpha Metascalper is an aggressive scalping bot that performs best on currency pairs with low spreads. Applicable currency pairs in this case include USDJPY, GBPUSD and EURUSD. Applicable filters for the bot include a news filter, moving average filter and an RSI filter. Being an aggressive scalper, all functionalities for optimal performances are achieved for broker offering zero stop level. I wish you the best as you try the bot.

Unlock the potential of automated trading on Gold (XAUUSD) and Euro/USD (EURUSD) with the Gold Euro Edge indicator . This indicator is expertly designed to capitalize on market movements in these key pairs, aiming for consistent performance by displaying buy or sell arrows on chart, audible alerts on laptop and notifications to phone. Experience efficiency and potentially enhance your trading strategy with this specialized solution.

Fuxi Guaxiang AI Intelligent Robot Trading System Instructions: (1) This Fuxi Guaxiang AI Intelligent Robot Trading System is designed based on the Yin-Yang transformation thought of the "Book of Changes" philosophy in ancient Chinese culture, and uses the Fuxi Guaxiang oscillation indicator as a trading signal. (2) Yijing Fuxi Guaxiang Dual-color Oscillator Indicator Trading Strategy: According to the strength of the Yin-Yang of the 64 Guaxiang, the strong Gua in the 100 K-lines is counted as t
「この秘密のトレーディングツールはプロップ会社によって禁止されている(彼らはあなたに知られたくない!)」
EAなしで究極のトレーディング・エッジを発見!(トレーダーのために、トレーダーによって作られました。 ロボットではなく、純粋なトレーディング・パワーです。)
偽のブレイクアウト、突然の反転、市場操作に苦戦していませんか?この強力なトレーディングツールは、マーケットが速く動くときでも、レーザー精度のシグナルを提供します!
UZFX-Alpha Strike Signals-MT5インジケータは、プロップファームの制限によりEAを使用できないトレーダーのために設計された、強力で多機能なトレーディングツールです。
このインジケータは、カスタマイズ可能な距離、サイズ、色で売買矢印をプロットし、柔軟なリスクリワード比率に基づいた取引レベル(エントリー、ストップロス、複数の利益確定)を表示します。
このインディケータは、スキャルパー、デイトレーダー、スイングト レーダー、ポジショントレーダーなど、あらゆる時間軸で使用できま す。このインディケータには、リアルタイムのポイント移動追

FastCloser - Simple Profit-Taking Utility Description: FastCloser is a lightweight tool that automatically closes all open positions when total profit reaches a predefined target (in USD). Ideal for profit-taking without manual market monitoring. How It Works: Calculates the combined profit of all active trades. If profit ≥ TargetProfit (e.g., $100), it instantly closes all positions . Works as a one-click script (manual execution) or continuously as an Expert Advisor (auto-trading). Key Featur

MACD Scalper Zero Lag is a fast, accurate, and reliable indicator designed to give traders the real-time edge they need. By eliminating the lag found in traditional MACD indicators, it delivers instantaneous divergence alerts on both forex and cryptocurrency markets. With its robust algorithm and user-friendly interface, this tool not only detects early trend reversals but also provides clear and actionable signals. The indicator offers customizable settings so that you can adjust sensitivity a

プロモーション:100ドルから開始。2つ販売ごとに価格が100ドルずつ上昇します。最終価格は2,500ドルです。お見逃しなく! An naは、複雑なアルゴリズムと独自の価格行動分析を組み合わせたスキャルピングトレーディングEAです。厳密な市場構造の識別と高度な取引意思決定メカニズムを通じて、市場の微細な変動を捉えて正確なスキャルピング取引を実現します。An naは価格行動に焦点を当て、従来の指標や遅延した市場信号に依存することなく、独自の分析フレームワークを利用して迅速かつ効果的な注文の実行を保証します。
主な特徴:
1. 複雑な価格行動モデル: An naは、最適化された独自の価格行動戦略を採用し、市場の変動の微細構造を深く分析します。価格の重要な転換点、サポートとレジスタンスレベル、および市場の供給と需要の変化を捉えることで、潜在的なスキャルピングの機会を正確に特定します。
2. 自適応市場ダイナミクス: 従来のEAの固定された取引モデルとは異なり、An naは市場のボラティリティに応じて自動的に取引パラメータを調整します。市場が強いトレンド、レンジ相場

Functional Overview Momentum Scalping Engine: Purpose:
The EA is designed for rapid, short-term trades—scalping the market by capturing small, quick gains from significant momentum shifts. Core Functionality:
It monitors market data in real time to identify brief but strong momentum bursts. When conditions meet preset thresholds, the scalper quickly enters and exits trades, ensuring swift profit realization while limiting exposure. Image Recognition Integration: Purpose:
Beyond traditional n

SPACE JAM – GBPUSD H1 Trading System SPACE JAM is a precision-engineered algorithmic trading system designed specifically for the GBPUSD pair on the H1 timeframe. This system integrates real-time volatility analytics, adaptive momentum tracking, and breakout confirmation logic to identify high-probability directional moves within intraday cycles. Utilizing a dynamic pattern recognition engine, SPACE JAM scans for volatility expansions, candlestick acceleration shifts, and market microstructure t


This scanner is based on the Bill Williams Awesome Oscillator (AO) indicator and is designed for faster analysis of financial instruments. The chart shows five vertical columns, which includes a financial instrument that meets certain criteria. The first column shows financial instruments with a strong trend, namely when the AO indicator is above the zero line on three time frames. If there is a strong downward trend in the market, then such instruments will fall into the fifth column. The seco

このエキスパートアドバイザー(EA)は、AUDUSD、NZDUSD、AUDNZDの3通貨ペア間の小さな価格差を探し、通常のスプレッドよりも大きな差を見つけた時に取引を行います。
タイミングとスプレッドの確認 また、各価格の最新性も確認し、古いデータに基づいて取引が行われていないことを確認します。EAは、差がユーザー定義のスプレッドしきい値(ポイント単位)よりも大きい場合にのみ取引を検討します。これにより、小さく意味のない差での取引を回避できます。
取引の実行
差がプラススプレッドを上回っている場合、EAはそのペアで買い取引を開始します。
差がマイナススプレッドを下回っている場合、EAは売り取引を開始します。
新しい取引を開始する前に、既に利益が出ている既存の反対取引を決済します。
リスク管理 EAは、口座に十分な余剰証拠金(現在のレバレッジで残高の1%以上)がある場合にのみ取引を行い、口座のレバレッジを過剰にかけないようにします。また、一度に1つの通貨ペアにつき1つの買いポジションまたは売りポジションのみを確保します。
つまり、このEAはAUDUSD、NZDUSD、AU

Chat Ai assistant
a versatile and intelligent AI assistant
Talk to the AI, get advice from it, give it orders
Can be used in all charts, time frames, symbols, markets and...
With a very simple interface
This tool is an artificial intelligence assistant that you can chat with.
You can give him different commands. for example:
Tell him to open a buy order for you.
Or tell him to close your sales deals
Or tell it to change the color of the chart
Tell him to predict the future of the market
and do

The Quasimodo Pattern Indicator is no more difficult than the Head and Shoulders. Still, only a few traders know about it, and some even confuse one with the other. However, this is not a reason to avoid this tool in your forex trading strategy. Features: Automatic Detection: The indicator automatically scans for valid QM patterns across any timeframe, reducing the need for manual chart analysis. Visual Highlights: Clear and customizable on-chart drawing of shoulders, heads, and breakout zones

MT4 Version Here : https://www.mql5.com/en/market/product/136465
XAU Marti
The Smart Choice for Gold & Forex Traders - Profit Potential! Why This EA Stands Out: RSI-POWERED ENTRIES - Combines the reliability of RSI indicators with advanced money management for high-probability trades. BUILT-IN SAFETY PROTOCOLS - Automatic margin checks, lot size validation. FLEXIBLE FOR ALL TRADERS - Works perfectly on XAU/USD (Gold) and major Forex pairs like EUR/USD. Key Features
Advan
FxS Triangular Arbitrage EA – 高度な三角裁定取引システム
実績のある三角裁定戦略を用いて、外国為替市場と暗号通貨市場の非効率性を突くように設計された、強力で高精度なエキスパートアドバイザーをご紹介します。 このEAを購入する理由
FxS Triangular Arbitrage EAは、単なるトレーディングボットではありません。複数の通貨ペアや資産にわたる裁定取引の機会を特定し、それを活用するように設計された、高度に専門化されたツールです。プロのトレーダーでも、テクニカル分析に精通した投資家でも、このEAは以下の点で競争優位性をもたらします。
- 市場の価格差を自動的にスキャン - 事前定義されたアービトラージの組み合わせとユーザー定義のアービトラージの組み合わせの両方をサポート - 取引とリスク管理のパラメータを完全にカスタマイズ可能 - FX、貴金属、さらには暗号通貨市場でも運用可能
FxS Triangular Arbitrage EAは、効率的なエンジンと適応型ロジックにより、機関投資家レベルの戦略を個人向け取

SL$TPauto Expert Advisor SL$TPauto automatically manages Stop Loss (SL) and Take Profit (TP) levels for all trades on a specific symbol. This Expert Advisor scans whatever chart it's placed on and works based on that chart's symbol, functioning independently across multiple charts simultaneously. Key Features: Automatically places Stop Loss (SL) and Take Profit (TP) for all open trades on the current chart symbol Applies the same Stop Loss (SL) and Take Profit (TP) settings to any new trades as

THIS EA WILL BE PERMANENTLY TAKEN OFF MQL5 ONCE IT HAS REACHED 9 BUYERS IN ORDER TO PREVENT OVERSATURATING THE MARKET SO GET IT WHILE YOU STILL CAN!!!
!!!ATTENTION TRADERS!!! Buy APEX 9 and get ALL of my other EAs for ABSOLUTELY FREE!!! LIMITED OFFER!!! Description: Are you sick and tired of losing money in the FX market? How often have you painfully lost money and felt like you’re just gambling away your valuable, hard earned money by using EAs and strategies that don’t work in the long

The Orange wizard is a powerful automated trading solution designed to capitalize on market range movements. Specifically crafted for traders who leverage high-low range strategies, this bot identifies optimal trading opportunities within defined price boundaries and executes precise trades for maximum profitability. Because this strategy is so unique, I only want to sell a limited number of licenses. Therefore, the price will steadily increase to limit sales.

The Midnight Thottle Expert Advisor: Automated Trading Based on Alignment of Percentages
The Midnight Throttle EA is an expert advisor that trades automatically based on the alignment of four key timeframes' percentage changes. It trades what Midnight Watch visualizes."
It uses the Midnight Watch indicator’s data to analyze market conditions and enter trades when the market shows significant alignment across different timeframes.
How Midnight Throttle Works:
Alignment Criteria:
The Expert
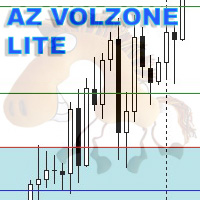
Information: I have developed two versions of the indicator: AZ_Azazavr and AZ_volzone_SYSTEM. The only difference between the AZ_Azazavr version and the AZ_volzone_SYSTEM version is the presence of automatic calculation in the AZ_volzone_SYSTEM version of the indicator and the presence of calculation of a slightly larger number of levels. Otherwise, you are purchasing not just an indicator, but a ready-made trading system.
Friends, many have been looking for a simple and effective system for

BTC Terminator 1.0 – The Smart Profit Machine for BTC ️ Backtest Results (Initial Deposit $100)
Net Profit: $1,725.02
Profit Factor: 4.50
Max Drawdown: 21.79%
Total Gross Profit: $2,218.27 | Total Loss: $493.25
Sharpe Ratio: 5.47
Consecutive Wins: 16 trades
Margin Level: 4,463% What Makes BTC Terminator 1.0 Unique? BTC Terminator is an Expert Advisor developed to trade BTCUSD trends , using a powerful mix of technical indicators. It analyzes momentum, breakouts, tre

The Swing High Low and Fibonacci Retracement Indicator is a powerful technical analysis tool designed to identify key price levels and potential reversal zones in the market. It automatically detects recent swing highs and swing lows on the chart and overlays Fibonacci retracement levels based on these points. This indicator helps traders: Visualize market structure by highlighting recent swing points. Identify support and resistance zones using Fibonacci ratios (e.g., 38.2%, 50%, 61.8%). Adapt

LIMITED OFFER 1000$ FOR 10 FIRST BUYERS
LIVE SIGNALS -> https://www.mql5.com/en/signals/2302759 NO MARTINGALE NO GRID only PURE SCALPING EA which identifies high-quality entry and exit signals Goldzilla is an advanced trading EA utilizing state-of-the-art artificial intelligence technology, which analyzes comprehensive indicator data to determine optimal trading opportunities. What distinguishes Goldzilla I is its superior capability to manage Risk:Reward effectively, ensuring maximum profi

Gold PrimeEA (MT5) ゴールド(XAU/USD)向け高精度トレンドフォロー型エキスパートアドバイザー
Gold PrimeEAは、MetaTrader 5向けに開発された、強力で完全自動化されたエキスパートアドバイザーです。短期的なゴールドトレンドを高精度に活用できるように設計されています。5分足に特化して最適化されており、高度なトレンドフォローロジックとスマートフィルタリングを組み合わせることで、XAU/USDにおける優良なトレードセットアップを特定します。
主な機能:
トレンドベース戦略:スマートアルゴリズムを用いて強いトレンドを検知し、その方向にトレードすることで、ドローダウンを最小限に抑え、利益を最大化します。
5分足に最適化:5分足チャートで最高のパフォーマンスを発揮し、日中の動きの中で高頻度かつ高確率のエントリーを捉えます。
ゴールド(XAU/USD)に特化:ゴールドのボラティリティと構造に特化して設計され、その動きに適応する洗練されたロジックを備えています。
マルチタイムフレームフィルタリング:取引実行前に、より長いタ
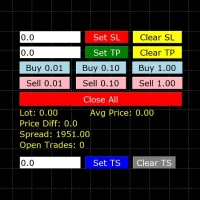
Super Scalper Tool V1.0: Turbocharge Your Trading Efficiency Introducing the Super Scalper Tool V1.0. A simple tool designed for rapid entry and exit strategies. Maximize your trading potential with optimized performance, robust risk management, and seamless market execution tailored for high-frequency scalp trading. Key Features: Quick SL/TP set for all current open trades - single click only. Clear SL/TP position for all open trades - single click only. Three customizable buttons each for BUY
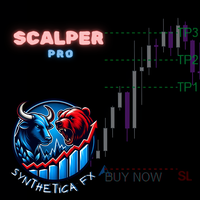
The SyntheticaFX Scalper Pro Indicator is a versatile and user-friendly tool designed to assist traders in identifying high-accuracy entry points across multiple timeframes and all currency pairs. This indicator provides clear visual signals on the chart, along with recommended Stop Loss (SL) and Take Profit (TP) levels, making it easier for traders to plan their trades with confidence. With its built-in dashboard, the SyntheticaFX Scalper Pro Indicator offers real-time trade statistics, helpin
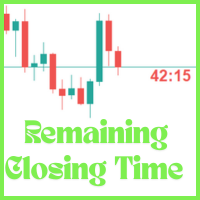
The Candle Remaining Closing Time indicator displays the amount of time left before the current candlestick closes on your chart. This tool is essential for traders who rely on precise timing to enter or exit trades, especially in fast-moving markets. By showing a real-time countdown, it helps you stay aware of upcoming candle completions across any timeframe—from 1-minute to daily charts. Whether you're a scalper watching minute-by-minute action or a swing trader timing key setups on higher tim

NOTE: CYCLEMAESTRO is distributed only on this website, there are no other distributors. Demo version is for reference only and is not supported. Full versione is perfectly functional and it is supported. CYCLEMAESTRO , the first and only indicator of Cyclic Analysis, useful for giving signals of TRADING, BUY, SELL, STOP LOSS, ADDING. Created on the logic of Serghei Istrati and programmed by Stefano Frisetti ; CYCLEMAESTRO is not an indicator like the others, the challenge was to inter
This Ea. is very unique in his function, and not designed to be traded automatic. as the first option. It is a tool designed to be used by a mild experienced Forex trader that can: Trade manual or automated and can try to find a good entry price levels Trader that can enter the market using market or pending orders at specify price levels. Please watch the video about using the excel calculator when using the breakeven technic . The same idea used for the breakev

INTRODUCTION Pass Your Prop Trading Challenge with Ease! Gold Miner Pro is a game-changing Expert Advisor that helps you pass prop trading challenges quickly and efficiently. Before using Gold Miner Pro, I spent 3 months trying to pass a prop trading challenge manually but couldn't succeed. With Gold Miner Pro, I was able to pass the challenge in just 1 month and withdraw profits just 2 weeks later. This EA helps you save time, reduce risk, and make the most of your trading journey. The Gold Min

Unleash the power of fully automated trading on Boom 300, Crash 300, PainX 400, and GainX 400 with the Boom and Crash Killer (Superior Bot) . This expertly designed bot is engineered for precision and efficiency, aiming to capitalize on market movements 24/7. Experience hands-free trading and potentially elevate your trading strategy with this superior automated solution.
Syntrix Trader – Smart Hybrid Grid EA for Adaptive Trading Syntrix Trader is a powerful and flexible Expert Advisor (EA) designed for traders who want precision entries and intelligent recovery. It combines multiple technical strategies with a smart grid engine to maximize opportunities and manage risk effectively — all in one modular system.
Documentation link: https://www.mql5.com/en/blogs/post/761818
Key Features Modular Strategy Logic
Choose from 5 powerful technical indicators:
Unlock the full potential of trading with the ADX PROject Expert Advisor (EA) , a highly customizable, automated tool built around the widely-used ADX indicator. This EA is designed with advanced filters and flexible settings, empowering traders to manage risk effectively through customizable parameters such as lot size, stop-loss, take-profit, and session filters. With multiple trend confirmation options and versatile trailing stop methods, the ADX PROject EA adapts seamlessly to various mar

Welcome to the world of high financial opportunities with " News mql5 " — your reliable assistant in news trading! This unique advisor is designed for traders looking to effectively leverage market volatility caused by economic news. **Trading is based on the comparison of the current and previous values of the news.**
1. News data is sourced from MQL5. 1.1 Let's consider the strategy for opening trades for EURUSD based on EUR news (i.e., the news of the collateral currency - Currency_margin or
Утилита (советник) помогает торговать на валютной паре EURGBP, использует для входов и выходов настроение индекса Еврозоны STOXX50, Великобритании FTSE100, Японии Nikkei225. Для каждой сделки устанавливается тейкпрофит. Выход из сделки по тейкпрофиту или при смене настроений индексов. Перед тестированием убедитесь, что в терминале есть индексы Евро50 (STOXX50, EU50, EuroStoxx50), Великобритании FTSE100 (UK100, UK100.spot и т.д.), Японии Nikkei225 (NIKK225, JP225, NKI225 и т.д.) Напишите в настр

Trunks EA EA works on 3 precise strategies that are included on this bot,the first one can provide short and long entry points of structure that includes time, & price,in scalping or swinging entry that will be defined by the EA based of that time and price requirements on Pacific session (GMT) by using Ryan Jones fixed ration & adding also some different lot size requi

Crystal AI Pro — 金、為替、株式のプロフェッショナル自動取引システム Crystal AI Pro は、パフォーマンス、一貫性、スマートな実行を求める真剣なトレーダーのために設計された最先端の自動取引システムです。 金 、 為替 、 暗号資産 、 株式 のいずれを取引する場合でも、このシステムはあらゆる市場環境で知的な参入と信頼できる成長を提供します。 その力の源: 完全な自動取引 — プロフェッショナル向けに設計 すべての金融商品 に対応:金、メジャー/マイナー為替ペア、暗号資産、指数 すべての時間足 (M1からH4)に対応 — あなたのスタイルに適応 金とマイナー為替ペア で最高のパフォーマンス 高収益戦略 に最適化、高精度 無制限のペア とチャート — 制限なし 20,000ドル以上の資本 の口座向けに設計、安定性とパフォーマンスを重視 スキャルピング、デイトレード、スイングトレード に適している ️ 知っておくべき重要事項: このシステムは、リスクを効率的に管理しながら収益性を最大化する プロフェッショナルレベルのス

RangeSniper Pro – The Ultimate Breakout Trading EA RangeSniper Pro is a powerful and flexible Expert Advisor built for breakout traders. Whether you're targeting session highs or navigating tight consolidations, this EA helps you trade with clarity, control, and precision. Whether you're a scalper, day trader, or swing trader, this EA adapts to your strategy with two powerful trading modes:
Turtle Mode – Dynamic Risk Management (RR-based trailing stops) Tiger Mode – Fixed-P

# Weekly & Daily Stochastic Signal Indicator User Guide
## Overview This indicator combines the Stochastic oscillator on weekly and daily timeframes to generate strong trading signals. It aims to create more reliable signals by tracking momentum changes across different timeframes.
## Parameters - **ShortPeriod (14)**: Daily Stochastic period - **ShortPeriodSMA (3)**: Daily Stochastic SMA period - **LongPeriod (70)**: Weekly Stochastic period - **LongPeriodSMA (3)**: Weekly Stochastic SMA per

Aurex EA is a sophisticated GOLD(XAUUSD) trading robot designed for Meta Trader 5, optimized for the M1 (1-minute) timeframe. It combines technical indicators like RSI and engulfing candle patterns with advanced risk management and a recovery strategy to execute trades. The EA features customizable trading sessions, a news filter to avoid high/medium-impact events, and a trailing stop system. Aurex has shown superior performance on live accounts compared to back testing, making it a versatile

Unlock the full potential of trading with the Parabolic SAR PROject Expert Advisor (EA) , a highly customizable, automated tool built around the widely-used Parabolic SAR indicator. This EA is designed with advanced filters and flexible settings, empowering traders to manage risk effectively through customizable parameters such as lot size, stop-loss, take-profit, and session filters. With multiple trend confirmation options and versatile trailing stop methods, the Parabolic SAR PROject EA ad

Pure Scalper R1 – Advanced Scalping Expert Advisor for XAUUSD (Gold) The Pure Scalper R1 is a cutting-edge, fully automated Expert Advisor (EA) designed specifically for scalping the XAUUSD (Gold) market on the MetaTrader 5 platform. Built with precision and efficiency in mind, this EA leverages advanced algorithms and our powerful custom indicator to identify high-probability trading opportunities, execute trades with lightning speed, and manage risk effectively. Whether you're a seasoned trade
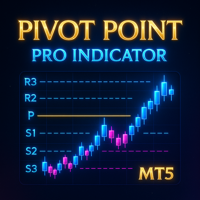
Detailed Description: The Pivot Point Pro Indicator is a powerful all-in-one fully customizable indicator that takes care of five pivot point methods (Classic, Fibonacci, Woodie, Camarilla, DeMark). It automatically plots pivot levels and midpoints, highlights key reversal zones and sends alerts when price approaches these levels. Unlike the free Pivot Point Classic version, this Pro indicator allows users to customize more settings, analyze current and historical pivot points and use al
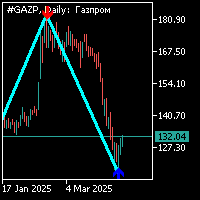
ジグザグ表示器は付加的な矢信号との34の期間と標準的である。 追加の信号は、ジグザグインジケータとは別に計算されます。この指標の作業は次のとおりです。 ジグザグインジケータのセグメントを形成し、追加の矢印信号が表示されるときは、矢印の方向に位置を開く必要があります。 前のアームの上部にある追加の信号(矢印)の反対方向にジグザグインジケータの別のアームを形成すると、保留中の注文の位置を確立することが可能になります。 形成が反対側のジグザグの肩から追加の信号(矢印)に完了した後、以前に開いた位置に追加するか、ストップロスをこのレベルに移動することができ;4. 保守的な取引モードで取引している場合、価格の動きの最初のプルバックの前に追加のポジションを開くことはできません。 市場に正確に参入するには、オープンポジションから40ポイント以下のストップを配置しながら、ジグザグインジケータセグメントの形成とシニアタイムフレーム上の追加信号の出現を待つことができます。 6. あなたが貿易に追加のポジションを追加した後、オープンポジションのストップは同じ価格レベルに保たれるべきです、ポジションがストップ

Innovative Forex Bot: A Path to Effective Trading In today's financial world, where information and technology move at incredible speed, traders need to find ways to optimize their strategies. Utilizing a Forex bot based on advanced analytical algorithms opens new horizons for achieving success in the market. This tool is capable of generating stable trading signals and minimizing risks, making it an indispensable assistant for any trader. Patterns as Core Elements of Analysis Patterns in tradin

Core Powerful: Your Intelligent Partner in Global Forex Trading Core Powerful is an innovative automated analysis and trading system designed to simplify the lives of traders and enhance the effectiveness of their strategies. With powerful algorithms based on geometric virtual patterns, this bot can identify stable price patterns, allowing you to act swiftly and confidently. Why Choose Core Powerful? Core Powerful is not just a trading bot; it’s your intelligent solution for autonomous market

Forex Falcon: An Innovative Multi-Currency Trading Bot Introduction In today's trading landscape, successful outcomes depend on the quality of the tools you use. Forex Falcon is not just a trading bot; it's a high-tech solution designed to enhance your efficiency in the Forex market. This multi-currency bot combines numerous features, allowing traders of all levels to confidently navigate complex market conditions. Why Choose Forex Falcon? When selecting a trading bot, it's crucial to consid

Insight Investor: The Advanced Multi-Currency Trading Bot for Forex Introduction In the dynamic world of Forex trading, having the right tools can significantly enhance your trading experience. Insight Investor is an advanced multi-currency bot meticulously designed to bring automation and efficiency to your trading activities. This expert advisor leverages cutting-edge algorithms to analyze market conditions and execute trades, all while aiming for consistent performance with controlled ris

Currency Curator: A Modern Multi-Currency Forex Trading Bot Introduction Currency Curator is an innovative multi-currency trading bot specifically designed to automate and enhance your Forex trading experience. By leveraging cutting-edge algorithms, this expert advisor performs in-depth analysis of market conditions and executes trades with high efficiency. Its primary goal is to equip users with reliable tools for successful trading while minimizing risks and optimizing time management. Flexi
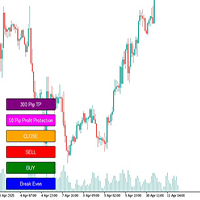
# Megathron Buttons EA User Guide
## 1. Overview Megathron Buttons EA is a helper tool designed for manual traders. It provides quick and easy trading through various buttons on the chart.
## 2. Installation 1. Install the EA on your MetaTrader 5 platform 2. Drag and drop it onto your desired chart 3. Configure the EA settings (detailed below)
## 3. Buttons and Their Functions
### Main Buttons 1. **BUY Button** (Green) - Opens a buy position with specified lot size - Automatically cal
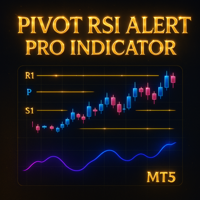
Detailed Description: The Pivot RSI Alert Pro Indicator is a powerful all-in-one indicator that combines five pivot point methods (Classic, Fibonacci, Woodie, Camarilla, DeMark) with a customizable RSI filter. It automatically plots daily pivot levels and midpoints, highlights key reversal zones and sends alerts when price approaches these levels, especially under RSI overbought/oversold conditions. Ideal for intraday and swing traders who rely on dynamic support/resistance and momentum confirm

マルチタイムフレーム・キャンドル インジケーターは、トレーダーが短期の時間軸分析を高期の時間軸構造と整合させるのに役立つ強力な視覚化ツールです。選択した高期の時間軸(H1、H4、D1など)のキャンドルを現在のチャートに直接プロットすることで、チャートを切り替えることなく、市場全体の状況をより明確に把握できます。
このインジケーターが必要な人は誰ですか? このツールは次の場合に最適です。 スマート マネー コンセプト (SMC) / ICT より低い時間枠で取引を実行しながら、より高い時間枠のバイアスを利用するトレーダー。 日次またはセッションの勢いと同期を維持したいスキャルパーとデイトレーダー。 小さなチャートでエントリーを洗練させながら、HTF 構造をざっと確認したいスイング トレーダー。
価格アクション、需要と供給、またはトレンドフォローシステムのいずれを取引する場合でも、このインジケーターにより、エントリーはより長い時間枠の強さによって裏付けられます。
戦略の改善 マルチタイムフレームキャンドルは、次の点の改善に役立ちます。 方向性バイアスの確認 – 支配的なトレンドまた

注意! 購入後すぐにご連絡ください。詳細な説明と推奨事項をお届けします! 最新技術と最高効率の世界へようこそ!Apex Neon MT5は、仮想通貨や金融市場での成功を支援する、あなたのガイドです。この革新的なAI搭載ソリューションは、最もダイナミックな条件下で最高の成果を達成するよう設計されています。 Apex Neon MT5のメリット: 卓越した精度: 独自の人工知能アルゴリズムが高精度のトレードシグナルを提供します。 BTC/USDのサポート: 仮想通貨および通貨ペアとの完全な互換性を備えています。 柔軟性: あらゆる市場条件で成功する運用が可能です。 仕組み BTC/USD仮想通貨ペアのエキスパートアドバイザーは、市場の高いボラティリティ条件下で効率的に動作するよう設計されています。アルゴリズムは重要な価格変動に素早く対応し、予測されるボラティリティの継続方向に指値注文を設定します。予測された動きが発生しない場合、指値注文は自動的に削除され、リスクを最小限に抑えながら取引戦略の効率を維持します。 また、資金管理のための信頼性の高いメカニズムを搭載しており、
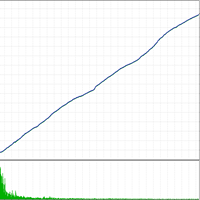
This price is only for the first buyer, then the price doubles. After purchasing, be sure to message me so I can guide you and send all the necessary files. One file for life, all markets and all timeframes
With this code, you can get the best results in backtesting for any currency pair and any timeframe
Made 100% by the latest artificial intelligence and the most advanced computers in the world
Customizable: just tell us the name of the currency pair and the desired timeframe
Can be used for

This EA will not automatically open the position, open the position needs the user manually!! MT5 position profit/loss up to the set amount of automatic closing EA\n will open the position is the apprentice, will close the position is the master, when all your order profit reaches the amount you set, the ea will automatically help you to close the position in bulk, the loss value will also be all closed Recommended time frame: Any time frame will work, but we like to use the M5, M15, M30 and H1
InsightPL – Advanced Profit & Loss Tracker with Smart Notifications InsightPL is a powerful Expert Advisor that provides deep insights into your trading performance with a user-friendly dashboard and mobile-friendly notifications. Monitor your profit/loss, track trades by magic number, and optimize your strategies with ease.
Unlock the Power of Your Trading Performance with InsightPL
Are you tired of manually tracking your trading profits and losses across multiple strategies? InsightPL is he

https://www.mql5.com/en/market/my https://www.mql5.com/en/signals/2298866?source=Site+Profile The Trend Hunter XAUUSD – Follow the Trend, Protect the Capital The Trend Hunter XAUUSD is a powerful Expert Advisor designed exclusively for trading Gold (XAUUSD) . It smartly follows major price trends while integrating risk management mechanisms to protect your capital in volatile market conditions. ️ Key Features : Trend-Following Core : Uses intelligent algorithms to identify and follow stro

GoldX PRO is a good trend indicator. The indicator's unique algorithm analyzes the asset price movement, taking into account technical and mathematical analysis factors, determines the most profitable entry points and issues a signal to open a BUY or SELL order. Bonus: When you purchase an indicator GoldX PRO you get the EA GoldX PRO for free.
Advantages of the indicator: The indicator produces signals with high accuracy. The confirmed indicator signal does not disappear and is not redrawn - a

Volume Flow Analyzer The Indicator helps you decode market activity by visualizing real-time volume strength. Whether you're a fast-paced scalper or a patient swing trader , this tool gives you a clearer view of when volume truly supports the price action.
Instructions: Indicator alerts when there is expected increase in volatility by analyzing volumes to allow a trader to prepare. It indicates "High Expected Volatility in such cases", It should be used along with your buy and sell parameters

自動ストップロス調整 – 正確に利益を守る! このエキスパートアドバイザー(EA)は、開かれたポジションのストップロス(SL)をユーザー定義の利益しきい値に基づいて自動的に調整し、取引戦略を効率的にし、手動操作を減らします。 仕組み: 動的ストップロス調整: 開かれたポジションに利益(青色で表示)がある場合、このEAは現在の価格を追跡し、ユーザーが設定した利益マージンに基づいてストップロスを調整します。 利益のロック: 例えば、EUR/USDの買いポジションで$15の利益を得て、5ドルのマージンを設定した場合、EAはストップロスを$10の利益に調整します。価格が有利に動けば、EAはさらにストップロスを調整します。 利益の保護: 価格が反転した場合、ストップロスが発動し、得た利益を確保します。 主な特徴: 自動ストップロス調整: 利益に基づいてストップロスを自動的に調整します。 設定可能なマージン: 利益(例:$5)のしきい値を設定し、そのマージンに達したときにストップロスを調整します。 すべてのオープンポジションに対応: EAは取引を実行せず、開かれたポジションのストップロスのみを調整

Live Signal: Live Signal Set files: Sets Find out more here : Kekeletso GoldenDow - Intraday Scalping for XAUUSD & US30
GoldenDow is designed for speculative trading on XAUUSD & US30 during the New York session.
It analyses for recent pivot highs and lows of a given period with the ability to adapt to forever changing market dynamics. The algorithm is not subject to swaps reason being that all open trades are closed before end of day. This EA is designed for traders and investors looking for

Simple Candle Timer
Overview: The Simple Candle Timer is a simple, yet powerful, tool for traders who want to stay informed about the time remaining until the next candle appears on their chart. Whether you are trading on minute charts or higher timeframes, this indicator ensures you never miss a new candle formation.
Features: Real-Time Countdown Timer: Displays the time left until the current candle closes and a new one starts. The timer updates smoothly every 100 milliseconds for precision
MetaTraderマーケットは自動売買ロボットとテクニカル指標を販売するための最もいい場所です。
魅力的なデザインと説明を備えたMetaTraderプラットフォーム用アプリを開発するだけでいいのです。マーケットでプロダクトをパブリッシュして何百万ものMetaTraderユーザーに提供する方法をご覧ください。
取引の機会を逃しています。
- 無料取引アプリ
- 8千を超えるシグナルをコピー
- 金融ニュースで金融マーケットを探索
新規登録
ログイン