YouTubeにあるマーケットチュートリアルビデオをご覧ください
ロボットや指標を購入する
仮想ホスティングで
EAを実行
EAを実行
ロボットや指標を購入前にテストする
マーケットで収入を得る
販売のためにプロダクトをプレゼンテーションする方法
MetaTrader 5のための有料のエキスパートアドバイザーとインディケータ - 139
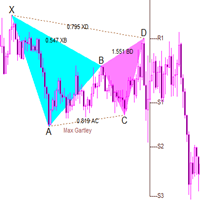
The full purchase discount is currently in progress! The best partner for any trader! This indicator is a classic butterfly indicator (harmonic trading). By default, it can identify 20 patterns and give prompts. You can also add custom shape parameters for custom prompts , prompting appropriate stop loss and profit levels. The built-in algorithm of this indicator is unique and is a unique band algorithm. Index characteristics Gartley pattern, also known as Gartley "222", was
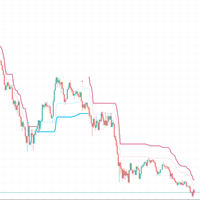
Using ATR to judge the trend, the dotted line is a short-term trend, and the solid line is a stable trend
Set different parameters according to different products. In most cases, please use the default parameters
Time cycle 5 minutes 15 minutes 1 hour
This indicator performs well in monetary products and gold
Index without future function
The entity part of the K line exceeds the entity trend part, which represents the trend conversion. Please wait for the K line to finish

Indicator works with two moving average, when this moving averages cross, then change of colors. You can change the color both moving average and chage all setup if you want, like a native moving average . If you want to put this indicator, all buffers are disponible and their are work fine. In case of doubt or any question don't exitate to write me, I'll read and aswer all the question.

" A successful trading means being able to master the art of timing, the art of execution and the art of protecting your capital in a very simple and faster way ". HermanGhost Manager is the most powerful tool that's actually designed to help you win in terms of executing different operations BUY,BUY STOP, BUY LIMIT, SELL,SELL STOP, SELL LIMIT, STOP LOSS, TAKE PROFIT, BREAKEVEN, TRAILING STOPS, all can be executed in seconds.
features : The intuitive interface One time configuration One click

Cryptosecurency is a fully automatic trending trading advisor for cryptocurrency trading. The EA enters a trade at moments of increased volatility in the direction of momentum. The impulse is determined according to one of two algorithms: By the percentage change in the price for a certain time period or by the built-in indicators based on Bollinger bands. The ADX indicator can be used to measure the strength of a trend. Trades are closed by Stop Loss / Take Profit. It is not recommended to use

Arielfx Smart Money Imbalance Indicator
What is Imbalance? imbalance noun: Lack of proportion or relation between corresponding thing
We Use Imbalance as a part of our trading system. When an imbalance is filled or price comes into it we often see big reactions and moves from those areas!
How can you use it?
You can take a trade an scalp reactions off of imbalance zones
//////////////////////////////////////////////// とても簡単です。設定はありません。 矢印の色とサイズのみを指定する必要があります。 この指標の読みを理解することも非常に簡単です。 上向き矢印は買いシグナルであり、下向き矢印は売りシグナルです。 ストラテジーテスターでテストしてみてください-あなたはそれを好きになるでしょう!!! ////////////////////////////////////////////////// ///////////////////////////////// この指標が取引の成功に非常に役立つことを願っています。 がんばろう。

インジケータSupplyDemand RSJ PROは、グラフ上に「Supply」ゾーンと「Demand」ゾーンを計算してプロットし、ゾーンのタイプ(弱い、強い、検証済み、証明済み)を識別し、ゾーンの再テストの場合は、その回数を示します。 再テストされました。 「供給」ゾーンは、需要よりも供給が多く発生し、価格が下がる価格ゾーンです。 「需要」ゾーンは、供給よりも多くの需要が発生し、価格を押し上げる価格ゾーンです。
ゾーンの分類 弱い:再テストされた場合、違反される可能性が高い価格地域。 強い:トレンドの方向を変えており、すぐに再テストされる可能性が低い価格地域。 検証済み:価格が高い地域。最大で1〜3回の再テストがありましたが、価格が地域を破ることはできませんでした。 実証済み:3回以上の再テストがあったが、価格がこの地域を突破できなかった、価格の高い地域。 壊れた/ターンコート:壊れた価格領域。サポートの場合は抵抗になり、サポートの場合は抵抗になります。
設定 視覚的な設定: 弱いゾーンを表示:弱いゾーンとして分類されたゾーンが表示されます。 テストされていないゾーンを表示:テ

Monkey Springs EA is an expert advisor that analysis two moving averages difference (stretch) . It´s possible to trade on trend or reversal. It´s possible to configure each moving average and its difference value - stretch, as soon as a stochastic and OBV filter . Takeprofit and stoploss are configured according to a percent of the moving averages difference. A trail system can also be configured, according to moving averages and stochastic. It´s also possible to configure a average

////////////////////////////////////////////////// //////////////////////////////// このインジケーターは、多項式回帰を使用して、それに応じて3つのチャネルと6つの線をプロットします。 最初のチャネルとその境界は大きな周期で、2番目は平均で、3番目は小さな周期です。 セットアップは簡単です。色を指定し、価格ラベルの表示を有効/無効にするだけです。 この指標の読みを理解することも非常に簡単です。 チャネルラインは、ストップロスを設定し、利益レベルを取得するために使用されます。 ストラテジーテスターにインジケーターの読み取り値が表示されない場合は、チャートウィンドウでズームアウトしてみてください。 ////////////////////////////////////////////////// ///////////////////////////////// この指標が取引の成功に非常に役立つことを願っています。 がんばろう。
This new indicator allows you to know the intensity of the movements of a certain period. It is a powerful indicator with which it is easy to identify trend changes. It should be noted that this indicator is new and it is likely that nothing similar exists, it is also only available in MT. A high intensity indicates that during the established period the movement of the price in each bar has been of great amplitude, that is to say, that there is a great difference between the opening and closing

EA has a live track record with many months of stable trading with low drawdown: Best Pairs (default settings) High-risk performance Night Hunter Pro is the advanced scalping system which utilizes smart entry/exit algorithms with sophisticated filtering methods to identify only the safest entry points during calm periods of the market. This system is focused on a long-term stable growth. It is a professional tool developed by me years ago that is constantly updated, incorporating all the late

With my custom built formula, you can visualize the market similar to displaying a heat map; with color showing at a glance the strength of the current trend, and the bar length showing the intensity of current movement. In more detail: Length of the histogram bar shows the average bar size of the last period, and color (from red to blue) shows the strength of upward or downward movement. Purple zones can indicate a change into a new trend. Bar period is adjustable so as to measure larger or sm

An indicator for receiving a lot of signals Can be used in all time frames and all markets Trade professionally using professional indicators yourself . Using this indicator, you will have a signal at any time. Do not miss any market movement. Get the signal very simply and clearly.
----------------------------------------------------------------------------------------------------------------------------------------------------------------------------------------------------
How it work:
Thi

ScalpJumping July 50% OFF Hey, haven't you tried it yet? What are you waiting for???? Try yoursef. It is a buy scalper robot with a recommended risk of 6%.This is not magic, it works well in a bullish context. you can do a back test yourself and check its operation. It is a multi-currency robot although it was tested with greater success on the EURUSD pair. Recommendations: currency EURUSD, timeframe 5M, Stop Loss 60, Take Proffit 60, Trailing Stop 0, Dynamic Lots true although you can tes

*** Comece a negociar AÇÕES na bolsa brasileira de forma automática ***
O Samurai Canarinho EA é um robô de negociação para Ações na B3 - bolsa brasileira Bovespa. O robô opera conforme tendência, com base no indicador Ichimoku Kinko Hyo , de acordo com sua dinâmica. Os alvos de Takeprofit e Stoploss podem ser configurados conforme a Banda de Bollinger . É possível configurar também um sistema de trail, conforme a dinâmica da Banda de Bollinger. Um percentual configurável pode ser estab
Any MA
Any Moving Average draws a moving average of * any indicator in a sub-window. Many Indicators included with MT5 are supported by default. You can add custom indicators as well. Settings Name Description Timeframe Select timeframe for calculation Source Indicator Select Indicator Custom Indicator Name Enter Custom Indicator Name ( when Source Indicator is set to Custom) Indicator Settings Source Indicator parameters ( separated by comma ) Moving Average Settings Moving Average para

Tom DeMark developed TD Sequential by hand, through a process of trial and error, in the 1970s. It never ceases to amaze me how something originally created to analyze daily price data can be applied so effectively, more than thirty years later, to any time frame—from one minute to one year—and to any market. The indicator has two components: TD Setup, which relies on momentum to define price ranges, and TD Countdown, which is trend based, and looks for low-risk opportunities to fade establishe

This scalper helper helps you manage your trader by placing AUTOMATIC stops and takes. When you enter a position and the market quickly turns against you, it's pretty boring isn't it? but with this helper your StopsLoss and TakeProfit will be AUTOMATIC, just configure how many pips you want and that's it. Besides, the helper has AUTOMATIC BreakEven, you just choose the amount of pips you want to place, and finally it contains a stop protector, whenever a candle closes in profit in your favor, it

*** NOVIDADE: Takeprofit e Stoploss com valores fixos em pontos ***
*** Comece a negociar na bolsa brasileira de forma automática ***
O Ichimoku Ninja EA é um robô de negociação para Mini-Índice (WIN) e Mini-Dólar (WDO) , negociados na bolsa brasileira Bovespa. O robô opera conforme tendência, com base no indicador Ichimoku Kinko Hyo , de acordo com sua dinâmica. Ainda, os alvos de Takeprofit e Stoploss podem ser configurados conforme valores fixos ou a Banda de Bollinger , de acordo com o pe

"Super Wave MT5" is an adaptive expert advisor based on band trend. It has a built-in unique price tracking algorithm , created specifically for trading EURUSD.
Pending orders for each price retracement. Every transaction will analyze the current price trends and fluctuations.
Sold at 60% the original price , $239 USD only 2 weeks ! the original price is $399 USD . After purchasing, please leave me a comment or message, I will send the private telegram group to you. Importan

市場はラウンド数を非常に好み、下落市場ではサポートとして機能し、価格が上昇するとレジスタンスとして機能することがよくあります。 この指標は、ラウンド値で価格レベルを描画するように設計されています。これは自動的に行われますが、それをオーバーライドして表示するレベルを決定するオプションもあります。 ラウンド レベルは、10、20、30 などの 10 のステップと同じくらい単純にすることができます。また、外国為替を使用している場合は、0.1 または 0.01 での変化を見たいと思うかもしれません。 インジケーターは、メジャーとマイナーの 2 つのクラスの線をそれぞれ異なる形式で描画します。これにより、レベルの 2 つの異なる変化の間の変化を同時に見ることができます。 アラート
このインジケーターには、価格が設定可能な距離内にある場合に、メジャー、マイナー、または両方の価格レベルでアラートを鳴らす機能が含まれています。 自動セットアップ デフォルトでは、指標はメジャー価格とマイナー価格の両方の適切なレベルを決定します。これは、いつでも画面に表示する行数を制御する構成可能な DensityInd

Find My Rules It is an fully custimizable Expert Advisor. You can choose multiple parameters that act as a trigger to execute a buy or sell order. The parameters available to configure to your liking are: lots, stop loss, take profit, dynamic lots, order type,timeframe. Indicator combinations for triggering orders and for preconditions (two factors) are: RSI, EMA1, EMA2, EMA3, EMA4,MACD. INPUTS PARAMETERS: OPERATION OPTIONS magic number = number for identification lots = lots for operati
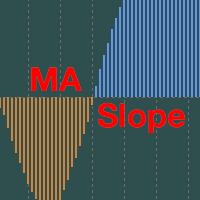
Moving Average Slope for MT5 is an indicator which displays the Slope of a Moving Average . Finding the Slope of a Moving Average is a great way to determine trends and ranges of the market. Moving Average Slope can be used for manual trading or built into an Expert Adviser for automated trading. It is presented as a histogram which you may change the colors for positive and negative results. Positive results indicate an upward trend of the market.
Negative results indicate a downward trend of

Delta Aggression Volume PRO is an indicator developed to monitor the strength and continuity of the aggression volume of sell and buy negotiations. Note: This indicator DOES NOT WORK for Brokers and/or Markets WITHOUT the type of aggression (BUY or SELL). Cryptocurrencies and Forex do not provide this type of data, that is, it does not work with them.
O Delta Agrression Volume PRO has features that allow you to view beyond the delta volume of the day.
Operation
Multi symbols (those who provid

This indicator creates the perfect RENKO for you to work with timeless types of Candles! Due to RENKO characteristics of timeless, the indicator adjusts trading arrows (otherwise they would be lost) and leaves them exactly where the negotiation occurred in Renko Candles! In addition, this indicator shows exactly the division between days, in order to make it clear to user where each trading session started and ended! Furthermore, the following indicators were added, giving you bigger analysis p

A ‘Supertrend’ indicator is one, which can give you precise buy or sell signal in a trending market. As the name suggests, ‘Supertrend’ is a trend-following indicator just like moving averages and MACD (moving average convergence divergence). It is plotted on prices and their placement indicates the current trend. The Supertrend indicator is a trend following overlay on your trading chart, much like a moving average, that shows you the current trend direction. The indicator works well in a tren

Two Factor Customizer is an fully custimizable Expert Advisor. You can choose multiple parameters that act as a trigger to execute a buy or sell order. Additionally you can choose a previous step (Two Factor), where you can also combine multiple parameters previous to those configured for the buy and sell orders. The parameters available to configure to your liking are: lots, stop loss, take profit, dynamic lots, order type,timeframe. Indicator combinations for triggering orders and for precondi

Hello!
Tired of constantly subscribing to other people's signals and earning pennies?
Want to manage your own trading?
Then you are on the right page!
It's very simple ==> buy my indicator ==> put it on the chart ==> blue arrow - buy ==> red arrow - sell. Even an infant can do it!
A handy histogram to trace the market direction.
Are you still here? Then read the parameter descriptions and take a look at the screenshots: Stoch K period - period for calculating the% K oscillator line. Stoch
MAs Crossover Dashboard Pro uses the value of Moving Average indicator. The periods of 2 MAs can be adjusted via the Edit boxes of this dashboard. The monitoring pairs will be selected by adding to the Market Watch (no need to set prefixes or suffixes) , you can monitor many pairs as you like. This dashboard will check almost popular time frame (M1,M5,M15,M30,H1,H4 and D1). The colors can be customized. The parameter of MAs can be set at the input. Crossover signal can be sent to you screen, yo

This indicator uses support and resistance, volume and some special formula to calculate the volume to filter the candles. If the volume reaches a specific value, And at the same time, Candle breaks the support/resistance line, There would be a signal and we can enter the market. Signals appear when the current candle closes. then you can enter the trade when a new candle appears. Please don't forget to follow your money management plan.
MT4 Version Support/Resistance Breakout MT4 : https:/

Aggression Wave PRO is an indicator developed to monitor the divergence, strength, and continuity of the aggression volume of sell and buy negotiations. The Agrression Wave PRO has features that allow you to view beyond the accumulated delta volume of the day.
Note: This indicator DOES NOT WORK for Brokers and/or Markets WITHOUT the type of aggression (BUY or SELL). Cryptocurrencies and Forex do not provide this type of information, that is, it does not work with it.
Operation
It is possib

Ilon Clustering is an improved Ilon Classic robot, you need to read the description for the Ilon Classic bot and all statements will be true for this expert as well. This description provides general provisions and differences from the previous design.
General Provisions. The main goal of the bot is to save your deposit! A deposit of $ 10,000 is recommended for the bot to work and the work will be carried out with drawdowns of no more than a few percent. When working into the future, it can gr

Put to work now Two brother AU11 this incredible EA was carefully made and tested for the AUD / USD market exclusively in the 5m time frame, the purpose of this EA is to keep your capital safely behind this incredible EA and your account never reaches to $ 0.
This EA can be used with little capital $ 100, I have tested it with $ 50 and it works perfectly but it is advisable to start with a minimum of $ 100, I recommend using a VPS. You can also work a higher capital, you just have to raise the

Put to work now Two brother EJ12 this incredible EA was carefully made and tested for the EUR / JPY market exclusively in the 5m time frame, the purpose of this EA is to keep your capital safely behind this incredible EA and your account never reaches to $ 0.
This EA can be used with little capital $ 100, I have tested it with $ 50 and it works perfectly but it is advisable to start with a minimum of $ 100, I recommend using a VPS. You can also work a higher capital, you just have to raise the

FX取引で成功するための鍵は、規律、忍耐力、そして私たちが独自に開発したリアルな取引量分析のような明確なエッジです。 これは私たちの10年間のFX取引の経験であり、これらの重要な要素はすべてStein Investments Expert Advisor(SIEA)シリーズにまとめられています。
SIEA ZENは、非常にバランスのとれたリスク・リターン比を提供し、すべての市場の状況を容易に生き抜くことができます-コロナ、ブレグジットなどの最も重大なものでさえも。 このシステムの堅牢性は、素晴らしいパフォーマンスに加えて、ユーザーにとってより重要な「安心感」をもたらします。それが、私たちが「ZEN」と呼ぶ理由です。
FAQ(よくある質問)、バックテストレポート、正しいサマータイム設定のためのヒントなど、より詳しい情報は SIEA FAQ をご覧ください。
トレーディングスタイル
SIEA ZENは、USD、CAD、EUR、CHF、GBP、AUD、NZD、JPYの8つの主要通貨をベースとした28の取引ペアすべてを取引します。 当社独自の出来高分析により、市場の不均衡とその度合い

This indicator displays buy or sell signals according to Bill Williams' definition of the Trading Zone. [ Installation Guide | Update Guide | Troubleshooting | FAQ | All Products ] Easy to use and understand Avoid trading flat markets Deterministic indicator with clear rules The indicator is non-repainting It implements alerts of all kinds It has straightforward trading implications. A blue arrow is a buy signal A red arrow is a sell signal According to Bill Williams trading in the zone helps t
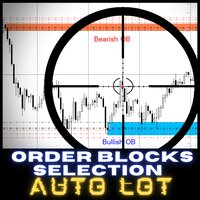
ONLY 4 COPIES FROM 10 TO $60 NEXT PRICE $95 Order Block Selection AUTOLOT is a great tool for all those traders who like to have control in their hands and especially to operate with high precision, thanks to our new control panel you will be able to select the candle where you want to choose the Bullicsh OB zone o Bearish OB
The objective of this Expert Advisor is that you can select Bullish Order Blocks (shopping area) or Bearish Order Block (sales areas) at any time, it will have 3 input pa

Strategy: 1.This EA is a trend trade, used for USDCHF H1 charts. 2.This EA is using indicators such as the Bolling band and moving average. 3. The initial amount of this EA is only $1000.This EA has a profit of over $3000. 4.The EA has detailed test data from January 2018 to June 2021, which is stable and profitable. 5.If you just want to put a small amount of money to get double reward, this EA trader is your best choice!

Please, if you like this AE, I would appreciate it if you could rate it with 5 stars ️ ️ ️ ️ ️ THANK YOU!!
Expert Advisor based on the signal generated by two MACDs (Moving Average Convergence Divergence), which can trade on different time frames (M1, M5, M15, H1, H4, etc.) The Expert has the following variables: >>>>>>>>>>>>>>>>>>> Magic number Slippage >>>>>>>>>>>>>>>>>>> Stop Loss (pips) Take Profit (pips) Trailing Stop (pips) Trailing Step (pips) Money management: Lot or

The main goal of the bot is to save your deposit! A deposit of $ 10,000 is recommended for the bot to work and the work will be carried out with drawdowns of no more than a few percent. When working into the future, it can grow several times and amount to several percent. Of course, you can reduce the deposit and thus get the bot more risky, but this is not recommended. Normal rates for a bot are 3-5 percent per year with a drawdown of 0.5%. There is a way to increase the annual percentage! To

ピボット レベルは、すべての市場で認められている確立された技術レベルです。 このインジケーターは、任意のシンボルについて、現在の四半期ごと、月ごと、週ごと、日ごと、および 4 時間ごとのピボットをチャートに描画します。また、各期間のサポート レベルとレジスタンス レベルを表示し、レベル 1 ~ 4 から表示するものを選択することもできます。 次の中からピボットのタイプを選択します。 標準 カマリリャ デマーク ウッディー フィボナッチ 元の仕様に従って、DeMark ピボットには単一のサポート レベルとレジスタンス レベルがあることに注意してください。 インジケーター ウォールは、ラインが価格に触れた場合、ラインの描画方法を変更します。これは非常に役立ち、ラインのサポートまたは抵抗の強さは、一度触れると大幅に減少します. 期間ごとに、予測されたピボット レベルを表示するように選択できます。これは通常のピボットと同じ計算を使用しますが、現在不完全な時間枠で機能します。そのため、価格がその範囲の大部分をすでにカバーしている、その期間の終わりに向かって使用するのが最適です。
設定

This indicator has a unique support and resistance calculation program, which is a unique trading system. Index characteristics Imagine if you can accurately determine the important trading support and resistance areas and points in advance, how will your trading improve? Based on a unique calculation method, the indicator analyzes the trend, analyzes the current support and resistance, and obtains the current important support resistance and single direction, the calculated stop profit and sto

This expert is best when running on GBPUSD M30 and is designed to give consistent mid/long term revenues. It doesn't use any dangerous strategies as martingale or grid trading. All orders are protected by a stoploss and the money management feature allows to protect the account balance. This expert also includes a sophisticated time management system to target best times to trade. This EA is not a scalper and will be less affected by slippages and spreads from brokers. It will trade less than a

前書き
21:00~22:00の夜間取引用EAです
長期ライブトレードは収益性が高い
一度に1つの注文のみを取引し、大きな損失を引き起こさない
各注文はストップロスとテイクプロフィットで設定され、グリッド、マーティン、またはその他のリスクの高いファンド管理は使用されません
複数の通貨を同時に取引できる デフォルトでタイムゾーンを自動設定
特性
トレーディングチャート:M15
取引可能な通貨:
EURUSD、GBPSUD、USDCAD、USDCHF、AUDCHF、EURGBP、EURCHF、USDJPY、EURCAD、EURAUD、GBPAUD、AUDJPY、EURJPY、GBPJPY、AUDUSD
最低入金額: 100 USD
推奨される仲介業者: IC Markets、Peperstone、Darwinex、EXNESS、およびその他の普及率の低いプラットフォーム
リアル口座シグナル MQL5 Live : https://www.mql5.com/zh/signals/1021524
パラメータ
MagicNumber: MagicNumber
U

The ease of observing the market anytime, anywhere
Exchange chart is the software for the professional trader to follow what happens in the financial market in real time. Developed by those in the market, it keeps up with the latest research on successful traders who show that the best, the ones who get consistent results use few types of chart configurations, in several different symbols.
All market watch passing through your chart
Exchange chart makes all the symbols configured by you in th
"Crazy Break MT5" is an adaptive expert advisor based on price breakthrough strategy. It has a built-in unique price tracking algorithm.
Every transaction will analyze the b reakthrough space and trading position. Buyer and seller two-way pending orders.
For the last month,just $2 99 dollars ! The next price increase is $399 !!!
Important information Mainly operate with EURUSD/GBPUSD within the H1 time frame. If you want to perform verification and evaluation, it is rec
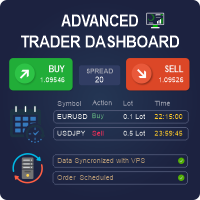
Powerful and beautiful trading panel helps you in scheduling or placing multiple trades based on your presets in a single click. It is designed to execute orders immediately or schedule trades in advance to be executed at certain time using multiple filters to avoid non favorable market conditions (wide spread, reduced leverage etc.). Additional functionality developed to sycnhronize two instances of the expert over the internet (Master - Slave Mode), which means trader can open the panel in loc

This indicator shows on the current day some lines of interest, such as maximum, minimum and closing of the previous day, as well as the opening, maximum and minimum price of the current day.
It can also show the GAP (closing of the previous day and opening of the current day) and projections of the amplitude of the previous day, according to the value you choose in the multiplier.
Oh, I was going to forget. It is also possible to determine the time frame, which is daily by default.
If this i

Simple Ichimoku Cloud break system. Configurable number of trades openened on trigger. Choose to include a trade which has no Take Profit but closes with trailing candles high/lows. Trades are always opened above/below the prev. closing candle (see pending pips) RSI and EMA as a bias/confirmation. Use the strategy tester to get your own setup per market. Use of fixed fibnumbers won't let you over-optimize. Best to be used 1H / 4H depending on market. It will mark any trade with a vertical red/g

ENJOY THE LAUNCH PROMOTION WITH SUPER DISCOUNT For a complete description of all parameters and EA, check out the article I created: Make Your Own EA - Main Description : https://www.mql5.com/en/blogs/post/732582 Sets : https://www.mql5.com/en/market/product/67727#!tab=comments&page=1&comment=22585237 Monitoring signal: https://www.mql5.com/en/signals/984624 The idea of this EA is to allow the user to develop their own strategy , since few people understand programming. The oper

Rice Martingale is an EA, which uses the Martingale algorithm with a low DD rate (not for XAUUSD, not TimeFrame M1) Rice Martingale can open two sides: buy and sell at the same time. We can set the maximum number of orders, the number of Martingale, and the number of the first orders. Especially, if the number of orders reach the point that users want to start the risk parameters, Rice Martingale can manage risks. It will cut loss at the point of the nearest average price which users set befor

Indicator of trend deviation with a static level. The deviation coefficient is set for the trend histogram. Signals are the intersection of the level trend histogram in the direction of the trend or during a trend reversal - the option is selected in the indicator settings by the "Revers" parameter. There are all the necessary settings for the design of the indication and sending messages to mail or a mobile terminal. All input parameters have an intuitive name. Analog for MT4: https://www.mql5.
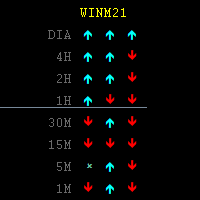
Indicador visual que mostra a direção de um ativo em diferentes times frames. Acompanhe em tempo real a variação de direção dos preços nos últimos 3 candles. É possível escolher o ativo a ser mostrado e quais times frames deseja acompanhar. Excelente para operações Day Trade. Facilita a visualização de vários times frames auxiliando assim na tomada de decisão rápida. Parâmetros de fácil configuração.

Automatice sus estrategias comerciales con nuestra sencilla herramienta de creación de estrategias "similar a un rompecabezas". Cree fácilmente estrategias que operen por usted en modo de piloto automático. También puede cargar estrategias creadas por otras personas, como la clásica Estrategia Martingala, para usarla como muestra para su propia estrategia.
Características clave Cree su estrategia a través de funciones simples de arrastrar y soltar, sin necesidad de conocimientos de pro
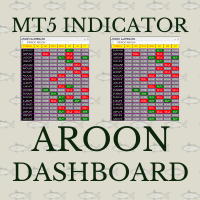
Aroon crossover Dashboard uses the value of Aroon indicator. The Aroon period can be adjusted via the Edit box of this dashboard. The monitoring pairs will be selected by adding to the Market Watch (no need to set prefixes or suffixes) , you can monitor many pairs as you like. This dashboard will check almost popular time frame (M1,M5,M15,M30,H1,H4 and D1). The colors can be customized. The Aroon indicator has been included in to this Dashboard, you do not need purchasing it. Crossover signal c

Entry and exit signals from the Double 7's Strategy by Larry Connors in his book "Short Term Trading Strategies That Work".
Larry claims this strategy predicted the market's direction over 80% of the time since 1995. Picking up the gains and being exposed in the market less than 25% of the time. Good for swing trading on Daily charts of SPY, Nasdaq, China's FXI, Brazil's EWZ and the majority of the equity ETFs and World Indices.
How does it work? The indicator activates the buy signal when we

Hello Seasonal Traders! The seasonality trading strategy works because the smart money is doing the same thing every single year more often than not. The month of the year or the day of the week and the time of the day can call the shots in any market. The seasonal cycle is another useful tool in your trading arsenal. I'm not saying to trade solely off of seasonality and forget anything else. I'm only giving you another trading tool that you can incorporate into your own trading strategy to ga

DYJ TradePanelMT5 allows you to perform trading operations ,opening market positions, placing pending orders, removing pending orders, and closing all positions When you use the "DYJ TradePanelMT5" to make a mistake in the direction of manual trading, you can cooperate with our remote order rescue service to turn the order back into profit. Parameters
Volume = 0.01 - - default volume; InpTP = 1200 -- default takeprofit POINTS; InpSL = 600 -- default stop loss POINTS; InpStep = 200 --

Binanceは世界的に有名な暗号通貨取引所です!暗号化されたデジタル通貨市場のリアルタイムデータ分析を容易にするために、プログラムは分析のためにBinanceFuturesのリアルタイムトランザクションデータをMT5に自動的にインポートできます。主な機能は次のとおりです。
1.通貨セキュリティ省のUSD-M先物取引ペアの自動作成をサポートし、基本通貨を個別に設定することもできます。基本通貨BaseCurrencyは空で、すべての通貨を示します。BNBやETCなど、Binanceでサポートされている暗号通貨も個別に設定できます。
2. Binanceの各通貨の価格精度、取引量の精度、および最大取引量を同期します。
3. WebSocketを介してBinanceをリンクすると、すべての先物取引をMt5にプッシュして市場を更新できます。
4.同時に更新されるすべての先物の種類をサポートします。リアルタイムのデータ効率を向上させるために、最大更新グループをカスタマイズできます(更新するには対応するウィンドウを開く必要があります)。ツールのデフォルトは最大数です。グループは4つのグル

Binanceは世界的に有名な暗号通貨取引所です!暗号化されたデジタル通貨市場のリアルタイムデータ分析を容易にするために、プログラムは分析のためにBinanceリアルタイムトランザクションデータをMT5に自動的にインポートできます。主な機能は次のとおりです。
1.通貨セキュリティ部門でのスポット取引ペアの自動作成をサポートします。また、利益通貨と基本通貨を別々に設定することもできます。たとえば、ProfitCurrencyが空の場合、すべての取引エリアを意味します。オプション:USDT、BTC、DAI、およびBinanceでサポートされているその他の取引エリア(契約取引は現在サポートされていません)。BaseCurrencyは空で、すべての通貨を示します。BNBおよびETCも可能です。個別に設定するBinanceでサポートされている暗号通貨を待ちます。 2. Binanceの各通貨の価格精度、取引量の精度、および最大取引量を同期します。
3. WebSocketを介してBinanceをリンクすると、すべてのトランザクションをMt5にプッシュして市場を更新できます。
4.すべての

Session Control session indicator. Depending on from which continent the trading activity takes place in a certain period, the entire daily routine is divided into several trading sessions.
Due to the fact that at each separate time interval exchange and banking platforms from different parts of the world are connected to the trading process, and the Forex market operates around the clock.
There are 4 main trading sessions:
Pacific. European. American. Asian.
This indicator allows you to se

Sense Pro - a highly customizable Expert Advisor for MetaTrader terminals that uses a grid trading algorithm. It works simultaneously in 2 directions: along the trend and against the trend. Trading in the direction of the trend works on the principle of closing profitable positions using Take Profit or Trailing Stop (configurable in the settings). Trading in the direction against the trend works by opening averaging orders to close losing positions at a profit. The EA has a wide range of se

Binanceは世界的に有名な暗号通貨取引所です!暗号化されたデジタル通貨市場のより正確な分析を容易にするために、プログラムは分析のためにBinanceの先物K-lineデータをMT5に自動的にインポートできます。主な機能は次のとおりです。
1. Binance USD-Mでのすべての先物取引ペアの自動作成をサポートします。または、基本通貨を個別に設定することもできます。たとえば、基本通貨BaseCurrencyが空の場合、それはすべての通貨を意味し、BNBやBTCなどのBinanceUSD-M先物でサポートされている暗号通貨も個別に設定できます。
2. Binanceの先物通貨の価格精度、取引量の正確性、および最大取引量を同期します。
3.テクニカル分析を容易にするために、リスト内のBinanceでサポートされているすべてのリストされた先物の見積もりデータを自動的に更新します。
4. 7 * 24時間の先物市場データをサポートします。最初のトランザクションは、最初にインポートされたときにデフォルトでBinanceから同期され、データは将来、最新のK-lineから自動的に同期

Serepok MT5 is a trending following EA. This EA uses a custom indicators to detect entry signal. The fixed stop loss and take profit are always set for each trade. This EA has smart money management. Users only need to determine the accepted loss for each trade, EA will calculate the lot size for each trade according to stop loss price. Therefore, this EA is very safe. This EA is very easy to use and can apply for many currency pairs. Recommended time frame is H1. Note:
1. Please do back testi

It's a DYNAMIC PERIOD indicator which identifies best ENTRY PRICE in the direction of main trend. It's completely non-repaint indicator and very simple to use.
Each arrow has a specific impact value from 1 to 10. Basically there is no important difference between impact numbers. The main point is: A higher impact value means that signal is generated from a bigger swing.
When it draws a Buy arrow on a bottom, It means that we had a Trend, A correction, And now this bottom is a reliable trigger fo
LineTrader2.0MT5
MT4: https://www.mql5.com/en/market/product/67566
リアルタイムでの実際のアカウント上の専門家の作業の監視:
1. 5,000ドルの残高を開始するリアルアカウントは、2020年5月に開始されました。 https://www.mql5.com/en/signals/773977
2. 2022年4月に開始された、10,000ドルの残高を開始するリアルアカウント:
顧問の仕事の背後にある考え方: 誰もが価格が一方向に無限にそして修正なしに行くことは決してないことを知っています。 テクニカル分析のルールは、歴史が常に繰り返されることを示しています。 これは、価格が一定期間後に安値と高値を繰り返すことを意味します。 また、様々な金融商品の価格行動チャートを見てみると、市場が一定の価格帯で横ばいになっている時間の約90%、市場には下降または上昇傾向がある時間の10%しかないことがわかりました。 この理解に基づいて、我々は潜在的な利益で取引操作を開き、記録するアルゴリズムを開発しました。
EAの設定

DESCRIPTION The ‘No Open Trades’ Expert Advisor is a dream come true to any mindful trader that knows that controlling risk is extremely vital to any successful trading plan. The ‘No Open Trades’ Expert Advisor closes all open trades in the account once the percentage loss you set is met. For example, if your account balance is $5,000 and you set the percentage loss to 5. This information has been passed to the Expert Advisor and it will close all open orders once the loss made is -$250 (which
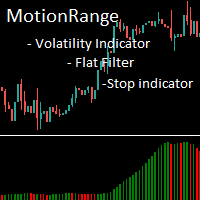
MotionRange - индикатор волатильности цены.
Индикатор не показывает направление движения цены и предназначен для наглядной демонстрации наличия трендового движения, силы тренда, ускорения и замедления трендового движения. Индикатор можно использовать для: - фильтрации флэтового состояния рынка, - открытия позиций в момент начала тренда, - закрытия позиций в момент замедления или остановки тренда.
У индикатора один входной параметр - Calculation Period. Это количество сравниваемых свечей для

MA Price Crossing EA by Capitarc CAPITARC`s MA Price Crusader for MT5 MA Price Cross -is a professional expert advisor used by our investment firm it is based on moving averages and the crossing of the candlesticks. This product looks at all the pairs, the candles closing above and possible trend continuation formations of the ever changing markets, while the usual experts are based on one or two indicators, this expert trades with naked price in addition to Moving Averages!! THIS IS A TR
MetaTraderマーケットは、履歴データを使ったテストと最適化のための無料のデモ自動売買ロボットをダウンロードできる唯一のストアです。
アプリ概要と他のカスタマーからのレビューをご覧になり、ターミナルにダウンロードし、購入する前に自動売買ロボットをテストしてください。完全に無料でアプリをテストできるのはMetaTraderマーケットだけです。
取引の機会を逃しています。
- 無料取引アプリ
- 8千を超えるシグナルをコピー
- 金融ニュースで金融マーケットを探索
新規登録
ログイン