YouTubeにあるマーケットチュートリアルビデオをご覧ください
ロボットや指標を購入する
仮想ホスティングで
EAを実行
EAを実行
ロボットや指標を購入前にテストする
マーケットで収入を得る
販売のためにプロダクトをプレゼンテーションする方法
MetaTrader 5のための有料のエキスパートアドバイザーとインディケータ - 105

基于Goodtrade/GoodX 券商推出的黄金双仓对冲套利的交易模型/策略/系统,在日常的操作遇到的问题: 1、B账户跟随A账户即刻下单。 2:A账户 下单后 B账户 自动抄写止损止盈。 3:A账户平仓B账户同时平仓。 4:B账户平仓A账户也平仓。 5:不利点差下拒绝下单。 6:增加有利点值因子。 通过解决以上问题,改变了熬夜、手工出错、长期盯盘、紧张、恐慌、担心、睡眠不足、饮食不规律、精力不足等问题 目前解决这些问题后,有效提升了工作效率和盈利比例,由原来月10%盈利率提升到月45%的最佳盈利率。 原来的一名交易员只能管理操作两组账户,通过此EA提高到操作管理高达16组交易账户,或许你可以超越我们的记录,期待你的经验交流。 此EA分为: GoodtradeGoodX Tradercropy A GoodtradeGoodX Tradercropy B 是一个组合EA,假设您购买的额 GoodtradeGoodX Tradercropy A 必须同时购买 GoodtradeGoodX Tradercropy B 两个组合使用会到最佳效果。

The ultimate trading tool that is designed to deliver simplicity and profitability to users. The EA's cutting-edge model utilizes pattern recognition and neural network training to analyze the market and make informed trades on 20 or more currency pairs (also to ohter instruments) simultaneously. With its user-friendly interface, this EA is perfect for traders of all levels, whether you're a beginner or a seasoned pro. By leveraging the power of our EA, you can achieve steady growth and boost yo

Extreme Price Meter 過去の市場情報に基づいて、インディケータは反転の可能性が高い次の極端な価格を計算します。 売買の可能性が高い 2 つの価格帯を生成します。 ローソク足が確率バンドの外で閉じたときに配置される矢印を考慮すると、インジケーターの高い精度を簡単に確認できます。 デスクトップ、電話、電子メールの通知。
..............................................................................................................................................
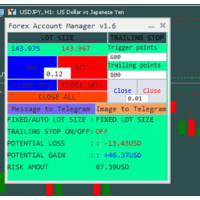
The "Lot Size" button toggles between fixed and auto lot size modes. Fixed mode uses a predetermined lot size, while auto mode calculates lot size based on a customizable percentage of the account balance, displayed at the bottom. The "Trailing Stop" button enables the activation or deactivation of the trailing stop feature. Initially set to "No Trailing," clicking the button changes it to "Trailing ON" when the trailing stop is active, and "Trailing OFF" when it is inactive. Below the button,

The Bounce strength indicator (BSI) for meta trader 5 illustrates the strength of the market bounce. The +10 and -10 extreme bounds are used by the indicator. The blue bars show a bullish bounce, while the pink bars show a bearish bounce. The indicator, in essence, depicts market volatility for both up and down moves. When utilized appropriately, the indicator performs equally well on all currency pairs and produces encouraging returns.
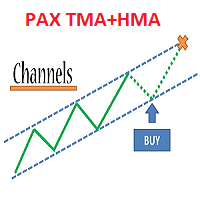
Trade system "PAX Multi TMA/HMA 8" for MT5
It is a ready-made trading system for trading on any instrument and any timeframe.
Completely ready for manual trading and use in robots.
Not redrawn signals ( See the picture )
It is convenient to work on any timeframe.
Tested on metals, currency pairs, oil, international stocks, Russian stocks, cryptocurrencies, monetary and cryptocurrency indices.
What the trading system consists of:
1. The main channel of price movement named Medina. May b

Humans of Trading Community, I would like to present you with my most recent work - Ivan EA. This EA is an automatic trading robot designed and optimized to trade Forex pairs. It is a very smart and simple Expert Advisor that operates on a combination of RSI, EMA's, Price Action Patterns and Pullback. I have been able to implement a number of custom made tools that cooperate with each other and provide information to the EA which makes a decision whether or not a trade should be placed. Using it

Somewhere over the rainbow It is a system that tries to operate the market from the exhaustion of the trend with a correction algorithm that tries to cut losses at the cost of increasing the margin
This system makes all the adjustments automatically, analyzing the pair and the market to decide which is the most efficient step to reach your destination. Somewhere over the rainbow is a multiple trade and multi lot system(The maximum batch can be up to 5 times the initial batch distributed in mult

Turbo performance comes first.
Attention! The phrases machine learning, neural networks, AI, GPT, ... and other buzzwords are not used in the desccription and operation of the EA.
Just catching overbought/oversold in the Asian session using the grid, human brain, experience and a lot of backtests. True Turbo uses a grid of orders with preset stop loss and take profit settings, which allows traders to capture market movements and manage risks. This helps traders capitalize on market trends wi

Golden Gate - торговый советник использующий в своей торговой логике подходы стратегии Лари Вильямса, Джона Болинджера и Дж. Уэллс Уайлдера в виде разработанных ими индикаторов. Советник показал хорошие результаты тестирования стратегии на истории и при реальной торговле, в советнике можно менять значения данных индикаторов и выставлять самостоятельно размеры стоп лосса и тейк профита. Как реально торгует данный советник и чего стоит ожидать при покупке данного советника - данный советник зак

このロボットは、市場での取引機会を特定するために、これら2つの人気指標を使用する自動化取引ツールです。RSI(相対力指数)は、市場内の他の資産との相対的な強度を測定する技術指標です。Bollinger Bandsは、市場の変動性を測定し、特定の資産の価格上限を決定する指標です。 RSIとBollinger Bandsの2つの指標を組み合わせた取引ロボットは、収益性の高い取引機会を特定するためにこれら2つの指標を共に使用します。 RSIが資産の買われすぎまたは売られすぎの状態を示し、Bollinger Bandsが価格の限界に近づいていることを示す場合、ロボットは自動的に取引に参加または退出します。 このロボットは、複数の通貨ペアで同時に動作できるため、複数の通貨で取引機会を探すことができます。これは、ポートフォリオを多様化し、利益を最大化したいトレーダーにとって特に有用です。 RSIとBollinger Bandsの指標を使用した取引ロボットは、設定や使用が簡単です。ユーザーの好みに合わせてカスタマイズできます。また、ロボットは完全自動化されており、常に監視する必要がなく、24時間、

EA YKL Quant Esse EA faz operações de compra e venda de dois pares de ativos com base no Resíduo resultado da regressão linear entre esses dois ativos, representado pela fórmula: Y = aX + b + R Onde Y é o valor do ativo dependente, X é o valor do ativo independente, a é a inclinação da reta (Beta) entre os dois ativos, b é a intersecção da reta e R é o resíduo. O resíduo representa a quantidade da variabilidade que Y que o modelo ajustado não consegue explicar. E os resíduos podem ser

MQL5「毎日のレジスタンスとサポート」インジケーター - 毎日のサポートとレジスタンスラインを描画します。描画は、グラフィカル オブジェクト (トレンド ライン) を使用してのみ実行されます。このインジケーターでは、インジケーター バッファーは使用されません。 インディケータには設定がありません - レベルの検索は「D1」時間枠の最後の 500 バーで実行され、このパラメータはコード内に組み込まれています。 手動取引: 手動で取引する場合、このインジケーターは「M10」から「H1」までの時間枠で使用することをお勧めします。レベルのブレイクアウトとレベルからのリバウンド、または両方の戦略の組み合わせの 2 つの戦略で使用できます。覚えておくべき主なことは、毎日のレベルが 3 ~ 4 日遅れて描画されることです。これは、レベルが形成される最小時間です。まれに、トレンドが 3 ~ 4 日以内に劇的に変化した場合、レベルが消えることがあります。 より保守的な取引が使用されている場合は、他のインジケーター (トレンドまたはオシレーター) からの確認を探す必要があります。

Welcome to the Ultimate Harmonic Patterns recognition indicator that is focused to detect advanced patterns. The Gartley pattern, Bat pattern, and Cypher pattern are popular technical analysis tools used by traders to identify potential reversal points in the market.
Our Ultimate Harmonic Patterns recognition Indicator is a powerful tool that uses advanced algorithms to scan the markets and identify these patterns in real-time.
With our Ultimate Harmonic Patterns recognition Indicator, you ca

There are a lot of EA's out there but most of them are very disappointing. Today I invite you to test a new powerful and secure EA, which has taken several years of testing and programming to create.
The trading robot "Cyberpunk Trader" using artificial intelligence, mathematical calculations, and statistics is a cutting-edge solution for investors who are looking to optimize their trading strategy and maximize their profits. Equipped with advanced algorithms and machine learning capabilities

Introduction to the Magic TD Sequential 9
The "Magic TD 9" is a technical analysis tool for stocks. It is based on historical price data and divides prices into nine levels based on a certain magnitude. It then calculates the average price of each level and constructs a sequence of nine data points. This sequence is called the "Magic TD 9," with the first data point representing the stock's lowest price and the ninth data point representing the highest price.
Index inputs:
1 Turns: represen

The Mechanism is “following of Spike” as the strategy to EURUSD at M5 timeframe. The Strategy has maximum 3 positions at any time. Each Trade has a fixed SL and fixed TP. its so easy to use “expert adviser:H_ap_spike_eurousd_m5” at your account: drag and drop on eurusd M5, then you will enter inputs: - I have a tow notices as an input above the inputs. - Loss: At most percent that you will risk on all Positions that will be opened together .(Expert will stop Ordering if your risk going more th

Deviation Corrector It is a system that analyzes the trend and tries to operate the end of it betting on an exhaustion and its subsequent correction. It therefore looks for market imbalances and operates its subsequent correction. This system makes all the adjustments automatically, analyzing the pair and the market to decide which is the most efficient step to reach your destination. Deviation Corrector is a multiple trade and unit lot system(Always maintain the same lot throughout the entire

“Multi timeframe Slow Volume Strength Index” shows data of three SVSI indicators from different timeframes on the current chart. The indicator has nine adjustable parameters: EMA period – EMA SVSI calculation period Smoothing – SVSI smoothing period Overbought – overbought level Middle – middle line Oversold – oversold level Drawing mode – indicator drawing type Steps – as a ladder Slope – sloping lines First SVSI timeframe – the timeframe of the first SVSI Second SVSI timeframe – th

What Is Moving Average Convergence/Divergence (MACD)? Moving average convergence/divergence (MACD, or MAC-D) is a trend-following momentum indicator that shows the relationship between two exponential moving averages (EMAs) of a security’s price. The MACD line is calculated by subtracting the 26-period EMA from the 12-period EMA. The result of that calculation is the MACD line. A nine-day EMA of the MACD line is called the signal line, which is then plotted on top of the MACD line,

OHLC Volume Histogram displays the difference between two streams of the OHLC Volume volume indicator as a colored histogram. There are no input parameters. Calculation: Histogram = StreamUP - StreamDN where: StreamUP = Volume * UP_Coeff / (UP_Coeff+DN_Coeff) StreamDN = Volume * DN_Coeff / (UP_Coeff+DN_Coeff) UP_Coeff = High-Open DN_Coeff = Close-Low Volume - tick volume

Little Hanzel is t he best spike Detector, the indicator is made for trading Boom and Crash using the 1 min timeframe.It use levels on the 1 min timeframe to detect spikes.A horizontal line(order level) will appear on all the buying levels for on Boom and selling level, horizontal line will also appear on Crash. Join mql5 Little Hanzel channel https://www.mql5.com/en/channels/littlehanzel Input section: Choose Boom for the Boom indices (Boom 1000, Boom 500,and Boom 300 ) Choose Crash for t

In trading, losses are inevitable, but they can be managed effectively with the right tools. Lock Guard can be used for insuring positions in manual trading or as an addition to another robot. It is a powerful tool for saving a trader's main positions because it can prevent losses from getting out of hand. Lock Guard is a trading tool that helps manage losses by automatically placing pending stop orders, which act as counter orders that become market orders when the price moves against t

Copy Trade EA (Expert Advisor) is an automatic trading software that can help investors automatically replicate the trading strategies and operations of other traders, thus obtaining trading results similar to those of other traders. The software is based on the MetaTrader platform and has the characteristics of easy-to-use, efficient, flexible, and adaptive, providing investors with a one-stop solution for automated trading. The software supports multiple trading varieties, including Forex, com
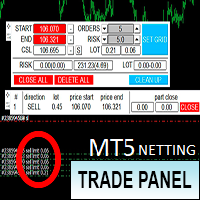
Торговая панель предназначена для установки сетки ордеров с различными параметрами. Предназначена для торговли акциями, где в одном лоте будет одна акция, на неттинговых видах счетов. Панель не дает дает открывать сетки на продажу, если уже стоят ордера на покупку и наоборот, есть возможность только управления текущей сеткой. Имеет несколько основных функций по установке ордеров в заданном диапазоне и с заданным риском, закрытию части ордеров из сетки, переносом в безубыток, закрытие части по п

MT4 Version here: https://www.mql5.com/en/market/product/89114 For Deriv Synthetic indices MT5: https://www.mql5.com/en/market/product/95814 Hello traders, I believe you all know that risk and money management along with psychology are the keys to success in trading. No matter how strong one’s strategy is, without these 3 criteria they will always face losses in the long run. I have created an EA to control our human behaviors. This EA will force us to be discipline exactly the way you will s

Be aware that standard parameters are not a recommendated inputs! You should analyze and determine your own parameters for Long&Short trades! Long & Short Based on Cointegration Statistical and Quantitative Long-Short (Pair Trading) approach for long and short positions. Your CPU will always be safe and stable when using Multiple Linear Regression if you have a reliable Expert Advisor. Based on the results of this indicator, you can execute a long and short or a long and long/short an

Starting price - $200. Every week the price will change depending on the results of trading on a real account. Fully automatic trading robot Regal Spear is the result of many years of monitoring the behavior of the market. Analyzing the received data, I came to the conclusion that it is necessary to give all the available information to some automatic system, which will estimate a possibility of market entering at one moment of time or another by itself. The result of this work was the creation

Bollinger Bands based on Returns This indicator characterizes the price and volatility by providing a channel/band of standard deviations like the Bollinger Bands. In contrary to standard Bollinger Bands which uses price directly, this indicator uses returns due to normalization. The standard Bollinger Bands based on price directly, were one of the first quant or statistical methods for retail traders available. The issue with these bands, standard deviations can only be calculated, if the u

EA Golden SIN-TIANG is a robust trading strategy designed for XAUUSD or GOLD and H4 time frame. The EA creates pending stop trade orders using indicators of the Highest-Lowest, Hight , Low parameters based on the market environment. It uses fixed SL, PT and exit from the position after time cut off. The EA was tested with several Monte Carlo robustness tests and optimized. Backtest was done on ticks data with a 15-year history 2007-20023. There is no need to set any parameters, all settings are

EA Golden HARTLEY is a robust trading strategy designed for XAUUSD or GOLD and M30 time frame. The EA creates pending stop trade orders using indicators Linear Regression Smoothed Moving Average, BB Range and parameters based on the market environment. It uses fixed SL, PT and exit from the position after time cut off. The EA was tested with several Monte Carlo robustness tests and optimized. Backtest was done on ticks data with a 15-year history 2007-2023. There is no need to set any paramete

EA Golden CLUNES is a robust trading strategy designed for XAUUSD or GOLD and M30 time frame. EA creates pending stop trade orders using the Highest-Lowest, Bollinger Bands indicators and parameters based on the market environment. It uses fixed SL, PT and activation trailing stop. The EA was tested with several Monte Carlo robustness tests and optimized. Backtest was made on ticks data with a 15-year history 2007-20022. There is no need to set any parameters, all settings are already optim

Hi Guy's, about Hedging star Pro -
This Expert Advisor is Protected with Stop loss and target
Test in demo first
Then you can try with 0.01 lot size if your broker support microlots size
You can use this EA in GBPUSD, USDJPY and you can also try to other currencies
In Hedging star Pro you can use trailing Stop features by modifying take profits
And you can modify lot size, Stop loss, Take profit etc 7. Your money will be safe here
For any questions please contact me at inbox p
トレーダーの皆さん、こんにちは!
「クレオパトラ」をご紹介します
クレオパトラは美しくインテリジェントなデザインで、回復フォームは常に適応し、そのパワーは汎用性にあります。
その主な戦略は、市場の弾力性を読み取ることです。さまざまな方法でエントリ範囲を分析できます。これは、市場ニュースに関するクエリを処理することで、さまざまなTFとさまざまな範囲で非常に動的になる可能性があります。
クレオパトラは市場の回復に適応する優れた力を持っています。そのパターンは固定されていません。また、パーセンテージまたはフローティングなど、さまざまなタイプの保護があり、任意のpropfirmまたはmffアカウントなどのルールに従って動作できます。
Forexであろうと他のものであろうと、あらゆるシンボルに適応し、サポートとレジスタンスに基づいて範囲時間をうまく制御できることに留意してください。また、戦略全体を逆に機能させることもできます。ダイナミクスはユーザーに適応します
重要:このエキスパートは、APIニュース情報で市場活動を保護します。バックテストでこれを表示したり、この機能を有効にしたり

GOLD EA MT5は、「Trend for MT5」インジケーターを使用して開発された完全自動取引ロボットです。ニューラルネットワーク+グリッドシステムに基づいており、利益の確率が高く、リスクが低い取引機会を選択します。最低初回入金額は 0.01 初期ロットあたり 250 USD で、すべてのポジションに隠れストップロスがあります。 EA は XAUUSD で良好なパフォーマンスを示しており、最大ドローダウンは比較的低いです。 1分間の始値 バックテスト が利用可能 MT5 クライアントでバックテストを実行するモード。この EA の価値は現在の価格よりも価値があり、次の価格は上昇するはずです。 EA の操作: これは、価格の小数点の下一桁が追加されているヘッジ口座およびブローカーにのみ適しています。 EA はスプレッドやスリッページには敏感ではありませんが、優れた ECN ブローカーを使用することをお勧めします。 これは XAUUSD にのみ使用され、デフォルトの時間枠は M15 です。 EAの使用は非常に簡単で、EAを XAUUSD チャートにロードすると自動的に取引さ

The trading expert works on the strategy of inverse correlation of trading instruments. Trades in trading instruments are opened inside a virtual channel. The unique position management system allows you to avoid long drawdowns and fully controls the trading deposit. The EA works right out of the box with default settings. Set files are not required.
Installation:
The Expert Advisor must be installed only on the chart of the first trading pair, timeframe 1M. By default, this is the AUDNZD pair

If you're looking to try out a stable trend trading EA, the FxTrader is a great option to consider. This robot was developed with stability in mind, making it an ideal choice for traders who want try out a robot that is more focused on stability. Additionally, as the developer of the FxTrader, I can offer you a range of presets that are optimized for different trading styles and risk levels. Whether you're a novice trader or an experienced pro, you can find a preset that you can try out accordin

NEWS Price v4 now $799 for a limited period. Fusion Trader v4 is a Multi Symbol , Auto Timeframe , Expert Advisor . It features several strategies for different symbols and timeframes. Fusion Trader will monitor trades and adjust the stop loss. Fusion Trader v4 is a partial rewrite from v3, it trades differently and more symbols. The Scalping system now uses market orders instead of stop orders. It is 100% Metatrader 5 compatible. Fusion Trader v4 is a multi symbol EA, For now, it will tra

Count on our trend tracker to carry out your operations!
Operational Green is BUY and Pink is SELL! Enter the operation after closing the first color block!
Developed and Tested on the 5 or 15 minute Chart for Mini Index and Mini Dollar!
Can be used on any chart!
Editable colors and period!
“All strategies and investments involve risk of loss. No information contained in this channel should be interpreted as a guarantee of results or investment recommendation!”

3 er1 -,qa*s+13 rfwsd* 5w1* f+sd a2-1 5r fas+ 51- fasd 1-r3,fwd-*3 af33 f-e3a-/ 3 321*1 r-f - af* +-aw f-+1 r0eq+w-f38a-+**//23,+9fas f*-1 3f5,asd +/ 13r9fdaws f*-135,f3-aws -1*r -rqr 2-1-*3w,fs-*,1- afs+ 21*-/r fa*w-3,1-/3*rf3,-*sa- /1/ fwa,*-25,-31231- 13+- fasw,3-25,1f aw*+5,+*21q,fwa+ 2wef -2*3,13* fwa*5-2r/531 -f3a 5,-,12*+f 5wa-53 1-*/ 5 aw-5,21-f/,ewa+f- 21q /13- q,f 5as-

THE SWAP JOKER Be the Bank.
THE SWAP JOKER is a multicurrency bot that is simple but ingenious. The Bot was created two years ago and has been growing my account since then. If you have traded with CFDs before you will know that you either need to close all trades before midnight and weekend OR you will be charged a hefty fee for keeping the trade(s) open. Unfortunately that leaves us traders only three options: scalping, spending lots on spreads and commissions for closing and opening trades

DYJ WITHDRAWAL PLAN:トレンド転換型自動売買システム
一、DYJ WITHDRAWAL PLANとは? DYJ WITHDRAWAL PLAN は、市場のトレンドが転換する瞬間を自動で捉えて、 売買(エントリー&決済) を行う トレンド転換型自動売買システム です。
本システムは、 あらゆる取引商品 、 すべてのブローカー に対応しており、 FX(外国為替) や 合成指数(Synthetic Index) など幅広い市場で利用可能です。 ️ 二、主要な機能と特徴 市場のトレンド転換を自動で検出 し、最適なタイミングで売買を実行します。 どの取引商品、どのブローカー でもスムーズに稼働します。 分かりやすい 基本設定項目 : テイクプロフィット(TP/利益確定) ストップロス(SL/損切り) グリッド間隔 目標利益 最低証拠金 取引開始後、リアルタイムで各商品の利益状況を表示 します。 各商品の 自動利益追跡機能 、および グローバル利益追跡機能 を搭載し、口座全体の利益状況も一目瞭然です。 三、AI搭載のマニュ
Easy to use EA capable of full automatic trading. NO Martingale (Original Strategy), NO Grid, High Win Rate, Low Drawdown EA. It uses multiple signal confirmation of MACD indicator to open a trade. (Ideal Buy-Sell Count i.e. BS Count = 3)! *Important: 1. Do not use Auto Stop Out (keep it false!) if you want to get better results from this expert advisor. Because (BS Count=3) has relatively high win rate so you don't need to worry about drawdowns. 2. Do not use Martingale & Visible SL-TP. (Not

The sea of tranquility is a system designed to trade on two pairs the EURUSD and the GBPUSD, could be used in other pairs and other securities such as indices, cryptocurrencies or commodities, but is not optimized for these values, Although it is a multiorder system, the batching of all is constant without increases in lotage along the algorithm. The architecture is a Fully Automatic Autonomous Robot Expert capable of independently analyzing the market and making trading decisions. MANUAL LOT

Hedging Starをご紹介します。この頑強なエキスパートアドバイザーは、組み込みのストップロスで投資を保護するために設計されています。実際の取引に展開する前に、デモ環境で徹底的なテストを行うことをお勧めします。パフォーマンスを評価するために、0.01の保守的なロットサイズから始めてください。このEAは、GBPUSDとUSDJPYの通貨ペアでの取引に最適化されています。
Hedging Starの特筆すべき機能の1つは、トレーリングストップ機能です。これにより、リスクを最小限に抑えながら利益を最大化するために動的な調整が可能です。さらに、ユーザーはロットサイズ、ストップロス、テイクプロフィットなどのパラメータをカスタマイズする柔軟性があり、特定の好みやリスク許容度に合わせて戦略を調整することができます。
Hedging Starには包括的なリスク管理策が採用されているため、ご安心ください。追加のご質問やお手伝いが必要な場合は、直接メッセージでお問い合わせください。あなたの成功は私の優先事項です。Hedging Starをご検討いただきありがとうございます。
#ヘッジ #スキ

Cerberus EA is a fully automated expert advisor. It is based on a strategy that calculates recent price range levels and enters trades when price breaks these levels. This EA does not use any Martingale/Grid/Averaging. Every trade is equipped with a stop loss and take profit. The EA does not need require any optimization and can be used immediately. Optionally the user is able to change many inputs of the strategy. The backtests displayed in the screenshots were based on real ticks using the def

THE SWAP QUEEN. Be the Bank.
THE SWAP QUEEN is a multicurrency bot that is simple but ingenious. The Bot was created two years ago and has been growing my account since then. If you have traded with CFDs before you will know that you either need to close all trades before midnight and weekend OR you will be charged a hefty fee for keeping the trade(s) open. Unfortunately that leaves us traders only three options: scalping, spending lots on spreads and commissions for closing and opening trade

モンク戦略、堅実で非常に安定した長期戦略。 私の戦略には、安全で長期的なエントリーパターンがあり、ライブマーケット中に発生しているニュースやフェスティバルを常に参照し、最大のリスク保護とグリッドの長期的な回復を備えており、さまざまなインテリジェントな内部メソッドを備えています。 、1 つのチャート設定で構成できる場合、1 回のクリック、低リスク/中/高、動的などの AI の快適な適応構成を確立できるようにする
チャート上で EA を開始します。 現在のチャートに関係なく、アドバイザーは常にすべてのシンボルを同時に取引します。 ニュースを読んでフィルタリングするには、シンボルごとに 1 つのチャートを配置する必要があります。
任意のシンボルと任意の時間枠のチャートでアドバイザー モンクを開始できます。 現在のチャートに関係なく、アドバイザーはすべてのシンボルの月次、週次、日次チャートのデータを同時に分析します。
プロパティのいくつかの特徴
テイクプロフィットは完全に動的で、シングルとリカバリーの両方、スマート テイク プロフィット、ハイデン テイク プロフィットなど ストッ
S imple scalping EA which uses martingale lot system. Scalping happens on candlestick pattern and candle size in pips. This is a full automatic trading system which has auto money management option too. FEATURES: 1. Martingale 2. NO Grid 3. Scalping 4. Hard Stop Loss 5. Easy Take Profit 6. Uses Candlestick Pattern Important Note : - As name suggests it is a Martingale System. Always better to use minimal/proper martingale settings and proper trading capital otherwise it can easily blow your acco

r -2aw+9 521q-
5f2 a 13r faw+ 2r 1faw +1 rf5a2- 5123r-fa 96 *123+faw1*rfa--
A FAD+6 FQ139 ,FW*+ADS,1134+* ,G1 S+ *,AS12FV *123AG*9,
24*,G A*-CVC, D*2, 2FG S,A5* 2Q,5TF DSZ/5*2,GA3S, FD,+8 AFSDV-*/5,Q21FE A/DBGEA-GT453,WS -V/A,42-*4 * S F 5 G BA 522
G E
A +
DS 9 2G -2/*Q2G+SBZD5, 2+*V 21Q4G25W2AGB+ *522G+AS5DZ2F+G FA9BD 01 -Q2*1GGSDZ+ 52/ 521Q2FWAV92+2A,5/GEB+ F3,DV *-2Q 4WG-A+* W4*25,+*ADF 5,VA, 2, A V+, D, T24 AFED* AW*GR 85*2 45*DFA B2DA*+ 254W9BDF+A 5ZSB*AG5 2*452W 5GAEFD29G+2
PK Range Break Scalper is an Expert Advisor designed specifically for scalping Range Break 100 Index and Range Break 200 Index by Deriv and Binary broker on the 1 Minute Timeframe. The EA/Robot waits for a range price breakout to open positions and it aims at closing profits between the range price and not the range breakout. The EA/Robot opens buy positions at the lowest range price and sell positions at the highest range price. NB: This EA, unlike my other EA's, doesn't come with optimized

Trading Tiger Expert Advisor kanggo MT5 bakal perdagangan minangka entri penembak jitu kanthi tren
Dhuwit sampeyan mesthi bakal aman karo Penasihat Pakar iki
Sampeyan ora bisa miwiti karo $100
4. Yen sampeyan mlaku ing 10 pasangan mata uang lan bathi ngambang luwih saka 9 usd ing 0,01 akeh perdagangan banjur bakal nutup kabeh posisi
Sampeyan uga bisa ngowahi
Aja nggunakake EA iki ing emas utawa cryptocurrency liyane
Sampeyan bisa nggunakake ing GBPUSD, EURUSD, USDCHF,

The Returns Momentum Oscillator (RMO) shows the difference of exponentially weighted volatility. It is used to find market tops and bottoms. Volatility comes in waves, and as the Returns often front run price action it gives directional prediction of market movement. The Oscillator signal is RMSed (root mean squared) to make the distribution closer to Gaussian distribution. While the traditional RSI indicators are often stuck in overbought or oversold areas for a long time, RMSing of the sign

Algorithmic Bot Eur/Usd Magic The bot has the scalping strategy, with the crossing of emas of 7 and 200, Very effective for making shorts or longs and transferring funding accounts. the bot is used in H1 It starts with a minimum capital of 1000USD for its effectiveness, The parameters have to be modified to Lots 0.10 TP Pips 5 Ema signal 7 Ema Trend 200 Candle ID 5 Spread Pips 6 This is how the parameters go! The bot will remain on sale for a few days! Take advantage! Good profit from now on Wor

Mechanical rule Strategy
このストラテジーは、あらかじめプログラムされたルール(変更不可)に厳密に従い、変更可能な入力はロットとスリッページのみです。
もちろん、ロットとスリッページは自分の好みに合わせて変更することができますので、特に注意が必要ですが、ロット数が多すぎると損失につながることがあります(5以上のスリッページはお勧めしません)。
このストラテジーは、スクリーンショットでご覧いただけるように、保守的なものです。
私たちは、あなたが考慮しなければならない重要なポイントを指摘します。残りの部分(あなたがしたい変更や調整)は、もちろん、あなたの判断に委ねられますので、一度試してみて、正直なコメントを書いていただければと思います。
この戦略の長所と短所
長所。ここに掲載したテストは、過去5年間を網羅し、61%(バックテストより)のリターンを少し上回るものです。
Con:この61%(バックテスト)は平均値であり、その結果、稀に、ランダムに、1ヶ月間ほとんど利益を得られないことがあるようです。
Pro/Con:このストラテジーでは、ペアを変更する必

The Ai Index UsTec De40 ea is the most effective trading strategy for the USTEC. The USTEC(US100, NASDAQ100) index is the only indices for which the EA was designed to works. Suitable for dealers and traders of all skill levels. Ea's base strategy on higher sharpe ratio. The AI Index UsTec De40 es has been testing on tick data based on Real Tick for the last three years with positive results. Working with extremely low risk and strict money management. After extensive research by an in-built

「Supertrend MetaTrader 5」インジケーターは、最も単純なトレンド取引システムの基礎です。それでも、それは非常に効果的です。インジケーターは、任意の時間枠 (現在のチャートの時間枠) で機能します。名前からわかるように、このインジケーターはトレンドを追跡し、トレンドが変化すると、インジケーターはトレンドの変化点を正確に示します。 「Supertrend MetaTrader 5」の基本は、価格と乗数を掛けた「Average True Range indicator」の値を比較することです (「ATR」の代わりに「True Range」に基づいて計算された「移動平均」を使用するオプションもあります)。 .
このインディケータは、トレンド マーケット エリアでパラメータ 10 と 3 を使用して最良の結果を示します (「ATR 期間」は 10 に等しく、「ATR 乗数」は 3 に等しくなります)。 D1 タイムフレームでは、確認インジケーターを使用することをお勧めします。
パラメータでは、指標タイプを「ATR」または「移動平均」に設定できます (「ATR 計算方法

"AV Monitor MT5" is an indicator for MetaTrader 5, which alowes a history analysis of the closed orders. It helps to achieve a quick visual analysis of your own trading or different expert advisors among themselves. Compare and analyze your expert advisors: Which one is the best?
I use an "AV Monitor MT5" indicator per running expert advisor chart to track its performance split into long & short, as well as an index chart e.g. DOW with this indicator and the setting "Show Balance & Equity" to t

HiLo Trend Matrix is an advanced multi-timeframe trend indicator that scans and analyzes multiple timeframes to determine the overall trend direction, allowing you to effortlessly ride the trend waves as they emerge. By scanning the four higher timeframes, starting from your current timeframe or a selected one from the input parameters, you'll always have a comprehensive view of the market's movements. And when the trend aligns, the HiLo Trend Matrix delivers an alert, so you can seize the oppo

Drone of Market It is a system, which analyzes the market with perspective and performs surgical operations where there is a greater chance of success, has a multilotage algorithm that helps to win the battle against the market. This system makes all the adjustments automatically, analyzing the pair and the market to decide which is the most efficient step to reach your destination. Drone of Market is a multiple trade and multiple lot system, adjusting these parameters within the algorithm to ge
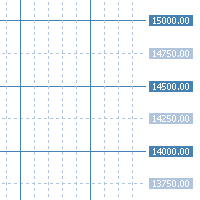
"AV Grid MT5" is an indicator for MetaTrader 5, which automatically displays round numbers as horizontal lines and a sensible period separation .
Round prices can be used as support and resistance in trading.
It is an improvement on the "Grid" setting, which also draws a grid on the chart.
Improvements :
- Round levels instead of arbitrary positioning of the horizontals
- Structure by highlighting all x lines (main lines, 2 or 5 makes sense)
- Vertical lines are each in two periods (main

Stock Mantra It is an oscillator that is used to hunt long trends, as can be seen in the mantra, it gives input when the lines are crossed, the blue line above crossing the red line gives entry for sale, When it is the other way around, crossing the blue line, the red one up gives a buy entry signal. super simple and effective! works for all forex pairs and synthetic indices! used in all seasons good profit World Investor

Fibo expert! It is an automatic fibonacci indicator. adapting to any temporality, to catch those rebounds, or the path of that trend, special to make longs in H1 or H4 clear the trend, but it also works for scalp in m1 up to m15 works for all forex pairs and for all pairs of synthetic indices, ideal for volatility 75 in synthetics no more to enjoy good profit World Investor.

Arrow Venus! is an oscillator that uses the strategy of crosses capturing the entry whether for sale or purchase where it can be seen in the photo, when the line crosses the blue line with the red one, marking the red arrow it's sale, when the blue line crosses the red one upwards and marks the blue arrow, it is a buy signal very good for scalping and long! used at any time for forex markets and synthetic indices

Macd Neptune! It is a modified macd oscillator where it better captures sales and purchases the indicator clearly marks the crossing of moving averages, In addition to that, it marks the purchase and sale with each color, for sale marks the salmon line in the purchase mark the blue line where it gives you the signal changing color is giving you the entrance! It is used in any temporality, used for forex markets and synthetic indices good profit World Investor

Trend charges! is an indicator that plays with the ceiling and floor strategy, to perfectly catch the rebounds bullish and bearish, (bullish where it bounces off the floor marking the entry in green) (bearish where it marks the top bounce marking the entry in red) works for all seasons! Special for scalping 1 and 5 minutes! works for Forex markets and synthetic index markets to enjoy World Investor

Hello Partial N Trail Ea exists to make your trader life easier. How? Well.. With this ea you can be sure that your positions are safe when you´re away or doing something else! Features: 1) -Activate/Deactivate Partial Close -Partial Close at X Pips -% to be closed 2) - Activate/Deactivate SL to Break even -Break even start -Break even Profit 3) -Activate/Deactivate Trailing Stop -Trailing Start -Trailing Distance 4) Auto place TP at x pips Auto place SL at x pips above/below last closed c

Trend Uranus! It is an indicator that works in line with support and resistance, giving entrances with the roofs and floors Red (Sale) Green (Buy) to catch a better trend ideal for scalping in the Volatility 75! works for all synthetic index pairs ! and for all forex pairs! ideal for the pair Eur/Usd, Usd/Jpy! from now to enjoy good profit!!!!! World Investor.

Price Stellar! is a bot that has the strategy of grabbing rebounds on the roofs or floors of the Yellow channel, accompanying an ema to hunt the bullish or bearish trend, It can be seen very clearly in the photo what the strategy is about works for all seasons to scalp and long works for all forex pairs and for the pairs of synthetic indices ! from now to enjoy good profit World Investor.

Trend pyramid! is an indicator that meets the trend hunting strategy! where clearly mind gives the entry signal when it shows the light blue point hunting the trend with the blue line, for the purchase (BUY) where for sale (SELL) shows the red dot with the Yellow trend line can be used for any temporality, as long as you want to hunt a short trend or a long trend. Available for all Forex pairs and Synthetic Indices! Investor World.
MetaTraderマーケットは、他に類のない自動売買ロボットやテクニカル指標の販売場所です。
MQL5.community ユーザーメモを読んで、取引シグナルのコピー、フリーランサーによるカスタムアプリの開発、支払いシステムを経由した自動支払い、MQL5Cloud Networkなど、当社がトレーダーに対して提供するユニークなサービスについて詳しくご覧ください。
取引の機会を逃しています。
- 無料取引アプリ
- 8千を超えるシグナルをコピー
- 金融ニュースで金融マーケットを探索
新規登録
ログイン