YouTubeにあるマーケットチュートリアルビデオをご覧ください
ロボットや指標を購入する
仮想ホスティングで
EAを実行
EAを実行
ロボットや指標を購入前にテストする
マーケットで収入を得る
販売のためにプロダクトをプレゼンテーションする方法
MetaTrader 5のためのエキスパートアドバイザーとインディケータ - 93
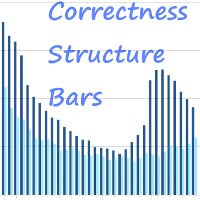
The Correctness Structure Bars indicator displays the bar structure in digital terms. How to Interpret the Information Provided by the Indicator It is very simple, all you have to do is analyze the chart. We will explain the work using an example, take the EURUSD instrument on the D1 timeframe, install this indicator and analyze the information provided by the indicator. The indicator works in the bottom of the chart and gives the result in the form of a histogram, that is, each bar (when a bar

UR ボリュームトレンド
UR VolumeTrend は、出来高の継続的な傾向を示す最も明確な出来高インジケーターです。 UR TrendExhaustion などの他のインジケーターと完全に連携して、ローカルのトップとボトムを示します。
パラメータは 2 つだけに制限されています。値が高いほど、トレンドが長く表示されます。 極端な勾配は、潜在的な反転を捉えるためにボリュームが枯渇する可能性を示しています。 2 本の線 - 出来高の傾向と平均です。 最大の利点: 簡単で、すべてのアセットに合わせて調整できます。 ツールの最新情報を入手できる特別な電報チャットがあり、何か不足していると感じた場合はリクエストを送信することもできます!
UR VolumeTrend を選ぶ理由
トレンドを捉えるには出来高が鍵となることは誰もが認めるところです。 このオシレーターは、1 つの使いやすいインジケーターに圧縮されたすべてのボリューム ツールの合計です。 見やすい方法で正/負のボリュームを示します。 背後にあるインターフェイスは、ボリュームが過去に比べて使い果たされている

Special offer for the next 10 copies
Are you tired of manually navigating through menus and inputting data every time you want to execute a trade or open an order on Meta Trader? Our hotkey tool is here to make your life easier and boost your trading efficiency. Our tool is natively coded for lightning-fast performance and comes loaded with all the features you could possibly want. From pending orders and OCO orders to trailing and multiple buckets, it has everything a scalper could need. A

UR ダイバージェンススポッター
UR DivergenceSpotter は、長年の経験の結果であり、時には最も簡単な方法が最善です。 いくつかの指標の間には良好な相関関係がありますが、それらが一致しない場合 (価格は「再調整」しようとします)、UR DivergenceSpotter でシグナルを受け取るのはその瞬間です。
UR Divergence Spotter を使用する利点:
パラメータなし ろうそくの作成後に再描画しません シグナルが有効でなくなった場合のシグナル (つまり、トレードをより長く保持し、ストップ ロスを BE に設定して乗り、部分的な利益を得るか、完全に閉じることができます!)。 この指標は、長年の経験と観察の結果です。 それはしっかりしていて、テスト済みです。 より良い結果とより安全な信号を得るには、より高い時間枠 (h1/h4) で使用するのが最適です。
加えて、UR TrendExhaustion や UR VolumeTrend などの私の他のインジケーターと一緒に使用して、シグナルの精度を高めることもできます。 ツールの最新情
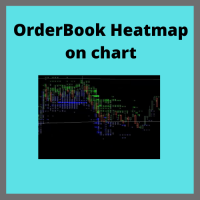
Ever needed a Boomap-like indicator for you MT5? Here you are!!
FULL WORKING DEMO VERSION available on Channel:
https://www.mql5.com/en/channels/011107AFAAE3D801
With this indicator you will see all the important levels, in which the largest bid and ask order are sitting. This indicator will show show all the history on limit order planed on the book. It will work only for futures broker who support level 2 order book. You can visualize the orders with colors and or with a text indicating

!! FLASH SALE !! Over 80% off !! For ONE week only. Now only $47 - normally $297! >>> Ends on 30 June 2023 - Don't miss it!
Buy and Sell Arrows On The Chart According To Price Action Sends Alerts On MT5 To Your Phone To You Email
Does NOT repaint. Works on any pair, any timeframe.
10 Activations allowed so you are free from limitations. MT4 Version here . For spreads from a tiny 0.1 pips RAW/ECN Accounts, click here . Check out my Waka Esque EA signal here: >> High Ri

Here is the boom and crash crazy Ma scalper a secretly coded color MA that is 1000% NON-REPAINT Works best on boom and crash 1000 Can be used on all timeframes from the 1 Minute timeframe to the Monthly timeframe The indicator is also a multi-time frame indicator you can select which timeframe to use The indicator is made for scalping purposes. as the trend changes the color of the indicator changes all well

Definition :
Risk Monitor is an expert for Analyzing, monitoring, controlling account risks.
Strategy :
Analyze Each Currency Volume and Direction on Account and Sort Them Find and Suggest Best Three Symbols in Opposite Direction (Hedging Positions) for Controlling Risk. Analyze User-Defined Position and preview effect before placing /Closing
Features of EA :
Graphical Interface Show Risk Graph for each currency Smart Analyze and suggest best hedging positi

In the Forex trading system, the Pivot Points trading method is a classic trading strategy. Pivot Points is a very simple resistance support system. Based on yesterday’s highest, lowest and closing prices, seven price points are calculated, including one pivot point, three resistance levels and three support levels.
The resistance line and the support line are one of the tools that are often used in technical analysis, and the role of the support line and the pressure line can be mutually tran
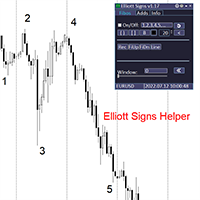
Elliott Signs Helper - A panel for marking Elliott signs and technical analysis. This is not an EA, This is an indicator that You can use to draw signals on the chart.
Wave Analysis:
Allows you to build a wave analysis in a few clicks with the definition of the type and order of waves. - Choice of color, style and font of waves is available. - Marking of impulses, triangles, zigzags, flats, simple and complex combinations is available.
For more information and how to use the indicator,

Golden Phoenix Expert This specialist is against the trend and works against the trend. It is better to be silent during important news. It works great in the suffering market and gives good profit and will amaze you. mt4 version
Inputs are divided into four parts: Main setting: The main settings of the robot on the corresponding symbol
Magic number: The magic number that, if it is zero, randomly selects a number for trades.
Deviation: Maximum display of changes in broker price with issued

オープン ポジションと指値注文を管理するための手動取引用 EA。組み込みのトレーリング ストップには 5 つのモードと 7 つの商品があります。 バーチャル ストップ ロスとバーチャル テイク プロフィットがあり、チャート上を自由に移動できます。 組み込みの取引シミュレーターを使用して、EA がストラテジー テスターでどのように機能するかを確認できます。 UTrailingMT5 の詳細なガイドは、「コメント」セクションにあります。 MT5テスターでは、チャートに従って仮想SLとTPラインを手動で動かせません! 利点 5 つのトレーリング ストップ モード: 仮想、通常、合計、パーセンテージ、およびモバイル ストップ ロス。 7 つのオプション: ポイント、バーの極値、フラクタル、ボリューム、MA、パラボリック SAR、ATR。 仮想 TP および SL - グラフに従って手動で自由に移動します。 すべてのオープンポジションにストップロスとテイクプロフィットを追加する; ストップロスの設定: ポイント、フラクタル、ATR インジケーター、毎日の高値/安値; チャートで開かれたすべての注
· What it is:
The Risk Reward Tool was developed to facilitate the management of your Forex trades.
Can you imagine if you could...
Place orders on the chart in a more practical and faster way? View your trade entry and exit points? Control the risk of each trade performed without having to do manual calculations? Trade using keyboard shortcuts? Change the timeframe of the graph with just the touch of a key? Swap and sync assets across as many charts as you like?
Now you c
· O que é: A ferramenta de Risco Retorno foi desenvolvida para facilitar o gerenciamento dos seus trades no Forex. Já imaginou se você pudesse... Colocar ordens no gráfico de forma mais prática e rápida? Visualizar os pontos de entrada e saída do seu trade? Controlar o risco de cada operação realizada sem precisar fazer cálculos manuais? Operar utilizando atalhos do teclado? Alterar o timeframe do gráfico com apenas o toque de uma tecla? Trocar e sincronizar os ativos

Hello, trading with EAs or manual?
We are coming with unique solution of how to protect your hard EARNED profits. Despite the fact you are beginner or experienced user, we all have experienced that trading can turn badly, especially before week / month end. In order to PROTECT your earnings , we are offering Trading Manager that closely overlooks the gains (or protecting the account from extreme losses) and locks the balance if certain profits is reached. HOW TO USE:
1. Please understand that

Milan holy grail The Expert Advisor tool has been developed for GBPJPY M15 !!! based on SMA and BollingerBands. It has been backtested on more than 18-year long tick data with 99% quality of modeling. The enclosed screenshots demonstrate the complexity. A broker with a small spread and slippage is recommended for better performance. There is no need to set up any parameters, except Magic number and Friday exit time, lot size . All other settings are already optimized and fine-tuned. Strategy w
Risk Controller Expert Advisorは、アカウントのトレーディングアドバイザーの総リスクを管理できるようにするプログラムです。 このプログラムを使用すると、すべてのアドバイザーのアカウントで許可される最大のリスクを制御できます。 たとえば、最大ドローダウンの30%のリスクを設定します。つまり、株式取引ロボットが30%のリスクを超えると、リスクコントローラーはアドバイザーのすべてのポジションを閉じ、開いているすべてのチャートを閉じることもできます。顧問はさらに働くことから。 平均化ロボットをマーチンゲールと交換し、不可抗力やその他の予期しない状況が発生した場合にロボットからの最大損失を制限したい場合は、「安らかな睡眠」のためにエキスパートアドバイザーが必要になります。市場の逆転。 Советник Risk Controller, очень важная и по моему мнению необходимая программа для каждого трейдера который торгует роботами. 制御は、アカウントの最大損失に相当す

Do you like trade Technical Analysis like I do? Then you will like this indicator, because it automatically calculates the support and resistance of the asset in simultaneous timeframes, or the famous MTF (Multi Time Frame). In addition to support and resistance, it is possible to have alert signals when the price breaks or touches (or both). Its configuration is very simple. The visual is fully configurable. Enjoy it!

KrakenCryptoExchange先物履歴更新パネル
特徴 :
1.シンボルのKrakenAPIから利用可能な設定および更新履歴に基づいてシンボルを完全に作成します。 このパネルは、Open High LowCloseデータを使用してKrakenFuturesシンボルの履歴を更新します。また、履歴の更新が完了するとメッセージを出力します。 これはライブデータではないことに注意してください。
3.[ツール]>[オプション]>[URL]タブからのWebリクエストを許可するで説明したようにKrakenAPIURLを追加し、[Webリクエストを許可する]チェックボックスをオンにする必要があります
-API URL:futures.kraken.com
4.より少ないメモリとCPUを消費します
5.ターミナルの再起動時に欠落データを自動更新します! ターミナルを開くたびに、最新のデータが準備できます!
6.DLL呼び出しは行われません

Indicator developed by the Brazilian and analyst Odir Aguiar (Didi), consists of "Moving Averages", famously known as "Didi needles", where it allows the viewing of reversal points.
The concept is very simple, when you enter 3 Moving Averages on display, a period equal to 3, one equal to 8 and the other equal to 20, then the formation of the indicator that works in axis or line center equal to 0 (zero) appears. ). Moving averages must intersect when approaching line 0.
The scanner monitor
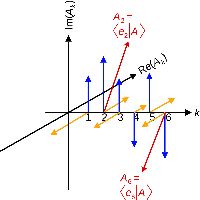
ComplexVectorHL is an indicator that characterizes the change in short-term market trends. The indicator is based on market analysis using the mathematical apparatus of complex numbers. The essence of the indicator is that it, with clear impulses, indicates the points in time when it is necessary to make decisions. The impulses are like a cardiogram showing the heartbeat of the market. The indicator has pulses only in one direction (unlike the previous development of ComplexVector), the pulses
indicador para opciones binarias que siempre funciona en favor de la tendencia principal , por favor identifiquela en temporalidades altas para poder tomar operaciones en las temporalidades bajas , puede usar una media movil de cualquier periodo para identificarla , recomendada la de 50 periodos exponencial ideal para operar el mercado de indices sinteticos del broker deriv y/o divisas, se puede acompañar de cualquier oscilador usando unicamente el nivel 50 para validar tendencia alcista o baji
This is a break even/break even plus EA. It moves your stop loss to break even(BE) or BE+ based on pre-set number of pips in profit. You can edit this in the input section. This EA sets breakeven for both manually and auto-opened trades. Moving stop-loss to a breakeven is popular among traders who wish to safeguard their trades and to let the trades run without incurring a risk of loss. With this EA , you can have your stop-loss orders moved to a breakeven point automatically when a po

Do you like to trade on EURUSD and GBPUSD? This expert may be for you. Trading starts with pending orders: buylimit and selllimit. The second order is at the market price - the so-called probing order (reduces risk). Then the EA adjusts subsequent orders according to the market situation. Both the first and subsequent orders are closed based on a trailing stop. The expert selects the volume himself, as well as how many positions will be closed. input start_enum inp_start= 2 ; //S

place a vwap line starting from the line placed on the chart parameters: tick_mode: enable to use ticks instead of bars. this uses a lot more cpu processing power prefix: prefix to add for line created by indicator line_color: set the color of the line created line_style: set the line style of the line created applied_price: set the price of bar to use of the bar std_dev_ratio: set the multiplier for the std dev channel

テクニカルインジケーターでこのようなフォームを使用すると、インジケーターの感度と安定性の間の妥協点を見つけることができます。それはそのアプリケーションで追加の可能性を与えます。 インジケーターパラメーター: iType -ogiveフォームのタイプ。 iPeriod -インジケーター期間。 iFactor は、放物線および指数形式で使用される追加のパラメーターです。有効な値は0〜255です。iFactor= 0の場合、インジケーターは単純な移動平均に縮退します。 iChannel -価格が変動する上位および下位チャネルを構築できるようにするパラメーター。有効な値は-128〜127です。値が正の場合は上部チャネルが描画され、値が負の場合は下部チャネルが描画されます。 これらのパラメーターを組み合わせることにより、さまざまな結果を得ることができます。このインジケーターは、市場のトレンド価格の動きを追跡するために使用できます。チャネルを構築することにより、価格が移動できる最も近いターゲットを取得できます。チャネル境界値は、利益を取り、損失を止めるために使用できます。 iFactorを使用す

Back to the Future это индикатор который определяет направление тренда. Определяет четыре уровня для роста и падения 1-й уровень флета 2 -й уровень коррекции 3-й уровень продолжения тренда и 4-й уровень возможного разворота. Индикатор рисует трендовые линии краткострочного и долгострочного тренда. Так же индикатор определяет динамические сел и бай зоны в виде прямоугольников. От ближайшего максимума или минимума рисует фибо уровни для определения целей движения. В меню индикатора отключа

It's a modified, and improved version of the classic HMA developed initially by Alan Hull in 2005. It uses a combination of three weighted moving averages to reduce the lag. Long Entry: When HMA turns blue from red with an upward slope. Short Entry: When HMA turns red from blue with a downward slope.
Features It comes with a multi-timeframe scanner which scans for the new signals across all the timeframes. HMA reduces lags which usually come with the traditional moving averages. Effectively
SSL stands for Semaphore Signal Level channel. It consists of two moving averages applied to high and low, respectively, to form a price following envelope. Buy Signal: When the price closes above the higher moving average. Sell Signal: When the price closes below the lower moving average.
Features It comes with a multi-timeframe scanner that scans for the new signals across all the timeframes. A straightforward personal implementation of the classic SSL effortlessly finds the trend directio

MT4: https://www.mql5.com/en/market/product/83443 時間枠: M1 通貨ペア: EURUSD、GBPUSD、USDCHF、EURGBP、USDCAD、AUDCAD。 高リスク通貨ペア: CHFJPY、EURCHF、USDJPY、AUDCHF。 推奨事項: Expertを使用する前に、インストールとブローカーの推奨事項について、必ず作成者に問い合わせてください。 ブローカーのサーバーには、必ずVPSまたはネットワーク遅延が最小のサーバーを使用してください。 スプレッドと手数料が最も低いブローカーを使用してください。 実際のアカウントで使用する前に、必要なロットでテストしてください。 取引戦略: アルゴリズムは、穏やかな市場期間中にボラティリティの異常なスパイクを検出します。 サポートおよびレジスタンスレベルからのリバウンド。 狭い方向のチャネルでの取引。 トレンドの方向に取引を開始し、偏差を伴う 反対方向の ボラティリティ 。 このアルゴリズムは、リスクの高い戦略を使用していません。各トランザクションは、いくつ
The indicator measures the buying and selling force between the buyers and sellers in the form of a histogram/oscillator by using a BOP equation:
BOP = Moving Average of [close – open)/(high – low)]
Igor Levshin first introduced the Balance of power in the August 2001 issue of Technical Analysis of Stocks & Commodities magazine.
Features
Quickly find the buying and selling pressure among the traders. It comes with simple inputs and an interface. All Metatrader alerts included.
Appli

This indicator shows the bullish/bearish market regime using the no. of bars moved above and below the overbought/oversold region of RSI. The green histogram depicts the Bull power, while the red depicts the Bear power.
Features
It can be used to enter new trades or validates trades from other strategies or indicators. It comes with a multi-timeframe scanner that scans the bulls/bears power across all the time frames. It's a perfect choice to boost the confidence of new traders via validatin
This is a break even(BE)/break even-plus(BE+) EA. It moves your stop loss to BE or BE+ based on pre-set percentage of current TP. You can edit the percentage in the input section. This EA sets breakeven for both manually and auto-opened trades. Moving stop-loss to a breakeven or BE+ is popular among traders who wish to safeguard their trades and to let the trades run without incurring a risk of loss. With this EA , you can have your stop-loss orders moved to a breakeven point automat

It is a script that allows you to open all market watch symbols at one go having the current time frame of the opened chart. I have been looking for a script like this for a very long time when I first started trading. Finally figured out how to do it, so no more problem for those who are suffering like me. This is a blessing for me now hopefully for you too. Buy the script, if it does not work as shown full refund. DM me for any problems, this script is only for MT5 . instruction Are : 1 - Keep

The indicator plots the Up and Down arrows on every price swing made by the classic Zigzag indicator. When Zigzag makes a new swing low, a green arrow is plotted. Likewise, a red arrow is plotted when Zigzag makes a new swing high.
Features
Compared to the classic ZigZag, it marks the swing points more effectively. It helps to identify the forming chart patterns in advance. It comes with a Multi-Timeframe scanner which shows the Zigzag direction on each timeframe. All Metatrader alerts includ

We are happy to present you the "Info Trader" information indicator. As we are traders ourselves, we create software that we primarily use in our own trading practices. During intraday multicurrency trading we were constantly in need of a "ready to use" info panel. You have probably noticed that it is necessary to make a decision on taking profit on the account with consideration of profit on multiple instruments. To do this, you need to see the whole picture of each trade in detail. “Info Trade

時間枠: M1 通貨ペア: XAU / USD ゴールドブースターMT5 は、ドルに対して金を取引する革新的な開発です。戦略はサポート/レジスタンスレベルを使用します。各取引はストップロスによって保護されており、適応追跡アルゴリズムがあります。このエキスパートアドバイザーは、特別な適応アルゴリズムの助けを借りて、保留中の注文を行った後に決定する最も重要なサポートとレジスタンスのレベルを突破することに基づいています。 推奨事項: Expertを使用する前に、インストールとブローカーの推奨事項について、必ず作成者に問い合わせてください。 ブローカーのサーバーには、必ずVPSまたはネットワーク遅延が最小のサーバーを使用してください。 スプレッドと手数料が最も低いブローカーを使用してください。 実際のアカウントで使用する前に、必要なロットでテストしてください。 取引戦略: アルゴリズムは、穏やかな市場期間中にボラティリティの異常なスパイクを検出します。 サポートおよびレジスタンスレベルからのリバウンド。 狭い方向のチャネルでの取引。 トレンドの方向に取引を開始し、偏差を伴う

*OPTIMIZE BEFORE TEST AND USE* Sentient is the next evolution of of scalping and has all the angles covered. I tested it on XAU/USD. Optimize on the time frame assets you choose. I like XAU/USD.
Sentient has more points and indicators to it to create a cluster signal and there are many inputs to optimize. You can use the basic ones for the threshold or all of them.
Note: There are many steps and points. Optimizing longer than 1 month, would require much time and power. Forward opti
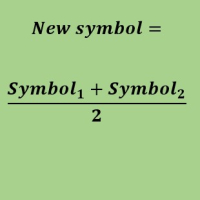
Create a new custom symbol based on average of Multiple arbitrary symbols (for MT5)
An Expert Advisor (EA) used to create custom symbol by averaging multiple input symbols (e.g. EURUSD and GBPUSD) and provide real-time updates. This is an MT4 "offline" chart equivalent which is very simple to use.
You can attach any MT5 compatible indicator or template to this new symbol and perform your technical analysis. You can back-test any EA on this new custom symbol in strategy tester. for example

TIO Channel Ichimoku - это базовая стратегия Трейдинга работающая на пробитие канала АТР, с выходами по ТП или по Ichimoku. Это круглосуточный Скальпер. Он не использует ролловерное время как граальные тестовые советники. В советнике не используются Мартингейл и пипсовка! Советник работает по барам, и тестировать его можно по ценам открытия. Конечно граалей нет. И нормальные, устойчивые ТС без всяких мартинов и сеток, или тестерных граалей ночников, будут иметь не ровную эквити и в некоторых г

Supported currency pairs: EURUSD,USDCAD, GBPUSD, EURGBP
Setting Lot -frist trading lot TakeProfit, in pips - t ake profit value Step between positions: Step between positions(Distance) Volume increase factor Max lot Author
I have an experience of more than 8 years in forex and gold trading, I started my career as a trader and now developing Expert Advisors to make trading process and trading fully automated I believe "if you can't make money while you sleep, you have to work fo

you don't have to monitor your trades all the time. save yourself screen time and leave management of your trades to Dynamic Trades Manager. Dynamic Trades Manager is a trading assistant tool. it has automated capabilities to break even, take partial profits, trails stops and to set your risk to reward ratio . it does not take trades on its own but only performs the aforementioned functions when the user has already conducted their analysis and opened a trade. this would save you the time of ha
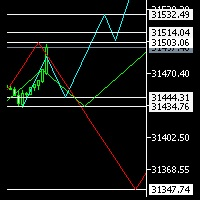
Hello Everyone ,
I am not an Elliot pro , but I promise to let you see it in a different way , have you ever considered to see 3 probabilities of different time frames on same chart ? this will not only enhance your trades entry , but will give you confidence and certainty when everything is not clear.
in my indicator you will be able to select 3 time frames of your choice , define number of candles per each time frame , give the color per each trend (Bearish or Bullish), not only that , yo
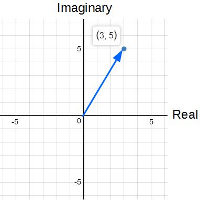
ComplexVector is an indicator based on market analysis using the mathematical apparatus of complex numbers. The essence of the indicator is that it, with clear impulses, indicates the points in time when it is necessary to make decisions. The impulses are like a cardiogram showing the heartbeat of the market.
For example: it may be the moment of planning a new entry. this may be the moment to exit the position. if you work with a series that is in a drawdown, you are recommended to close it i

黄金の神は機械学習を使用しています。 XAUUSD 1 HRの時間枠、またはOHLCをロジックとして取引する他の時間枠で取引します。 入力のバランスのリスクを設定します。デフォルトは5%です。 取得する最大ロットを制御します。 すべての取引は停止し、利益を上げます。 このEAは積極的に取引されています。 これは指標に基づいていないため、デモで取引してライブを行います。 リアルタイムで試してみてください。インジケーターを使用する多くのEAとは異なります。 このEAはインジケーターを使用しません
黄金の神は機械学習を使用しています。 XAUUSD 1 HRの時間枠、またはOHLCをロジックとして取引する他の時間枠で取引します。 入力のバランスのリスクを設定します。デフォルトは5%です。 取得する最大ロットを制御します。 すべての取引は停止し、利益を上げます。 このEAは積極的に取引されています。 これは指標に基づいていないため、デモで取引してライブを行います。 リアルタイムで試してみてください。インジケーターを使用する多くのEAとは異なります。 このEAはインジケーターを使用しません

The ADX indicator (average directional index) is a technical tool designed to measure the strength of a market trend. The ADX indicator is used for various purposes such as measuring the strength of a trend, finding a trend and a trading range, and as a filter for various Forex trading strategies.
Some of the best trading strategies are based on following the market trend. There are also strategies through which traders make profit by trading against the trend. In any case, if you can identif

The purpose of the inidcator is to identify the reversal point.
The blue arrow is buy signal and the yellow star is its stop loss. The red arrow is sell signal and the yellow star is its stop loss. Please note that the singal is against trend,it could be continual fail. Alert feature: if there is a signal, the indicator will send alerts of popup window,email or mobile push. Inputs: Popup Window Alert: it is false in default Email Alert : it is false in default Mobile Push Alert: it is false in
Tool converted from tradingview indicator. Modified version with pivot points calculated in a more intuitive way.
This tool displays relative volatility and directional trend. Excellent way to pickup diversions and reversals. Length can be lowered to 11 or 13 in settings to show price range.
Can be used to identify patterns such as parallel channels and likely direction of price action.
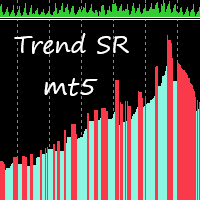
This indicator takes input from Support and Resistance levels, combined with a special trend filter. Easily spot tops and bottoms, and trade with more confidence. Great for scalping. This indicator can be used on all time frames and pairs. Features alert function.
No need to set up the indicator.
How to use: Simply attach to any chart. Zoom chart out completely. Red histogram line color = Selling opportunities. Blue histogram line color = Buying opportunities. See pictures below. To spot high

This Expert trades macd crosses , using ADX and AC. Designed for 4hr EURUSD trading but able to trade major pairs. Code is designed for speedy metatrader optimisation using open price testing as ea uses open prices on indicators used. EA identifies trends with specific momentum and exits using the ADX or stop loss. Please optimise using out of sample data. preset at 0.1 lots best to start with 0.01 lots.
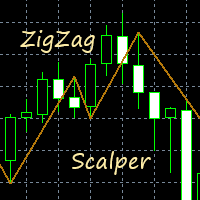
This indicator gives you a modified ZigZag, combined with a trend filter. Great for scalping. Perfect for channel trading. Features alert functions. No need to set up the indicator. How to use: Simply attach to any chart. Buy when the golden line stops below the price. Sell when the golden line stops above the price. It also helps to keep the audible alert set to true. Best results when checking two or more timeframes before entering trades on the lower time frames. Use as you see fit for your

この指標は、いわゆる「悪」の数値を重み係数として使用します。それらの反対は「いやらしい」数字であり、これもこのインジケーターに表示されます。これらの2つのクラスへの数値の分割は、特定の数値のバイナリ表記の単位数によって決定されるハミングの重みに関連付けられています。 これらの数値を重み係数として使用すると、トレンド追跡インジケーターが得られます。さらに、いやらしい数字はより敏感な指標を与え、邪悪な数字は保守的な指標を与えます。それらの違いはそれほど大きくはなく、市場での急激な価格変動によってのみ顕著になります。このインジケーターの使用は、新しいトレンドの開始を判断するのに役立ちます。これにより、位置を開く瞬間をより正確に決定することが可能になります。 インジケーターパラメーター: Type numbers -番号タイプの選択、EvilまたはOdious; iPeriod -インジケーター期間。インジケーターの感度は、このパラメーターによって異なります。小さいほど、価格の変化や市場動向の変化に対する感度が高くなります。 インジケーターの動作例を図に示します。

EA Goldlytic use a trend built-in indicator. It's specifically designed for trading the XAUUSD (GOLD) but can be used with other assets (forex, crypto...).
The Expert Advisor opens an order based on a signal from the indicators and fixes the profit at a certain level with the ability to open order basket For best results, it is recommended to cancel the direction of trade on the EA panel on the chart Since this is a trend-following Expert Advisor, we recommend disabling the Expert Advisor in

Optimize before back test or use.
New Wave trades trends. 3 moving averages and trends up and trends down, buying and selling. Finding the optimal parameters for yourself, you will need to optimize in the platform. A set file is in the comments to use in the test to show the Expert. Optimize inputs according to your asset and risk. I optimized this with EURUSD on a 1 hour time frame. Percentage of balance is used to trade by.

Supported currency pairs: EURUSD,USDCAD, GBPUSD, EURGBP Recommended timeframe: M15
The EA should run on a VPS continuously Setting Fixed Lot - fixed frist trading lot StopLoss, in pips - stop loss value TakeProfit, in pips - t ake profit value RSI : averaging period, Averaging period for calculation
RSI : type of price RSI :RSI value calculation
Use martingale, martingale Mode Martingale coefficient, martingale multiplier Order Maximum number of multiplications
Este EA foi desenvolvido para o mercado financeiro Brasileiro, porem, com os Parâmetros corretos pode ser aplicado a todos ativos disponíveis na metatrader inclusive forex e metais. Não julgue o resultado com os parâmetros padrão, entenda que os parametros são para validação de diversos ativos, por isso cada ativo tem um valor que se enquadra na realidade do contexto do mercado. Qualquer duvida, pode me chamar no Telegram @andrefonsecaloureiro ou no email vendas.mercadocapital@gmail.com

The Force and Weakness Indicator for MT5 Real Volume is part of the (Wyckoff Academy Price and Volume) toolset The Force and Weakness Indicator for MT5 Real Volume was developed to identify the Strength and Weakness of volume in an accumulated way. Enabling the vision of a panorama between price and volume. The Indicator can be used as an oscillator and as a histogram. As a fantasy it has all the premises of R. Wyckoff's three laws when put together with the price: Cause and Effect, Effort x Res

The Force and Weakness Indicator for MT5 Forex is part of the (Wyckoff Academy Price and Volume) Toolkit The Force and Weakness Indicator for MT5 Forex was developed to identify the Strength and Weakness of volume in an accumulated way. Enabling the vision of a panorama between price and volume. The Indicator can be used as an oscillator and as a histogram. As usual it has all the premises of R. Wyckoff's three laws when put together with the price: Cause and Effect, Effort x Result and Supply a

The VSA Candle Signal for MT5 is part of the toolset (Wyckoff Academy Price and Volume). Its function is to identify the correlation of Price and Volume in the formation of the candle. Its creation is based on the premises of R.Wyckoff , a precursor in the analysis of Price and Volume. VSA Candle Signal for MT5 assists in decision making, leaving your reading clearer and more fluid. See the images below.

The Weis Wave Bouble Side Indicator for MT5 is part of the toolkit (Wyckoff Academy Wave Market) The Weis Wave Bouble side Indicator for MT5 was created based on the already established Weis Wave created by David Weis. The Weis Wave Double Side indicator reads the market in waves as R. Wyckoff did in 1900. It helps in the identification of effort x result, cause and effect, and Supply and demand Its differential is that it can be used below the zero axis and has a breakout alert showing Who is s

The Weis Wave Bouble Side Indicator for MT5 is part of the toolkit (Wyckoff Academy Wave Market) The Weis Wave Bouble side Indicator for MT5 was created based on the already established Weis Wave created by David Weis. The Weis Wave Double Side indicator reads the market in waves as it was done by R. Wyckoff in 1900. It helps in the identification of effort x result, cause and effect, and Supply and demand Its differential is that it can be used below the zero axis, further improving plus operat
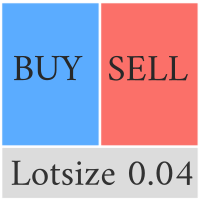
This Pro version of the LotSizePanel let's you set the stoploss with a line. Instantly the ea will calculate the lotsize based on where you drag the line on the chart. Press the "Show Line" button again, and the line dissappears and the ea reverts back to calculating the lot size from an ATR based stoploss again.
I can't see how I would ever trade manually without this panel again.
Remember that autotrading needs to be turned on to place orders with the buttons.

MT5のWAPV価格と出来高インジケーターは、(Wyckoff Academy Wave Market)および(Wyckoff Academy Price and Volume)ツールセットの一部です。 MT5のWAPV価格および出来高インジケーターは、チャート上の出来高の動きを直感的な方法で簡単に視覚化できるように作成されました。 それを使用すると、ピークボリュームの瞬間と市場が専門家の関心を持たない瞬間を観察することができます 「スマートマネー」の動きではなく、慣性によって市場が動いている瞬間を特定します。 ユーザーが変更できる4色で構成されています。 赤=オファーの増加 緑=需要の増加 灰色のキャンドル=需要と供給の減少 青=スマートマネー演技 上方向への動きは強さを示します。 下向きの動き弱さを示します。 価格の方向に関係なく、最強のボリュームが上がる必要があります。 R.Wyckoffの理論に基づいて作成されたインジケーター

MT5のWA_PV_BOX_EFFORTXRESULT WAPV Box Effort x Result Indicatorは、Package Indicatorsグループ(Wyckoff Academy Wave Market)の一部です。 MT5のWAPVボックスエフォートx結果インジケーターは、価格とボリュームを読み取るのに役立ちます。その読みは、努力×結果の特定を支援することで構成されています グラフによって作成された波で。 ボックスが緑色の場合のMT5のWAPVボックスの労力x結果インジケーターは、ボリュームが需要に有利であり、ボックスが赤色の場合を意味します ボリュームは供給に有利です。 ボックスが大きいほど、価格に対するボリュームの変位が大きくなります。価格の上昇波がボックスのサイズに比例しない場合、 努力×結果。 非常に視覚的な方法で、ボリュームと価格の間のこの相違を識別できます。 MT5のWAPVBoxEffort x Result Indicatorを使用すると、インジケーターをゼロ軸の下に配置することで、視覚化を向上させることもできます。 ティックボリュームとリア

Supported currency pairs: EURUSD,USDCAD, GBPUSD, EURGBP Recommended timeframe: M15
The EA should run on a VPS continuously Setting Fixed Lot - fixed frist trading lot StopLoss, in pips - stop loss value TakeProfit, in pips - t ake profit value CCI: averaging period, Averaging period for calculation
CCI: type of price, Use martingale, martingale Mode Martingale coefficient, martingale multiplier Order Maximum number of multiplications


The Price Elevator indicator is developed to help you figure out the general long-term trend of the market. If the price is above the Green separator line, this is a clear indication the bulls are in control. Similarly, the bears are in control if the price continues to trend below the red separator line. Download Price Elevator MT4
Trend Re-entry In this case you would plan your buy entries above the green dotted box (make sure to set the Buy / Sell Retracement Floor=30). The SL should be

他のEAを無料で入手!!!他のEAを無料で入手!!!他のEAを無料で入手!!!他のEAを無料で入手!!!他のEAを無料で入手!!!
USD Scalper MT5は、USDペアのニューラルEAです。この製品はGBPUSD、EURUSD、AUDUSD、NZDUSDのために作られています。将来、新しいペアが追加される可能性があります。
現在のペア:
GBPUSD
EURUSD
AUDUSD
NZDUSD-次のバージョンで追加されます
入力:
ストップロスに基づくリスクのリスク率(1が選択されている場合、取引あたりの最大リスクは1%です)
限定のみ!!!元の価格:999ドル
リスク警告 購入する前に、関連するリスクに注意してください。 過去のパフォーマンスは将来の収益性を保証するものではありません(EAも損失を出す可能性があります)。 示されているバックテスト(スクリーンショットなど)は、最適なパラメーターを見つけるために高度に最適化されていますが、結果をライブ取引に転送することはできません。 この戦略は常にストップロスを

This indicator gives you arrows, two SR lines and a golden trend line. Uses a special trend algorithm to plot the arrows, combined with support and resistance inputs. Perfect for channel trading. Features alert functions.
Parameter TrendArrowPeriod. Parameter TrendLinePeriod. (Change to your preference) How to use: Simply attach to any chart with default settings. Zoom in the chart, to see the two blue SR lines and arrows more clearly. When the blue SR line is below the price, golden trend line
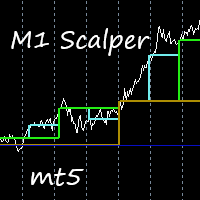
This indicator is excellent for scalping on the M1 or M5 chart. Uses a special algorithm for the lines. No need to set up the indicator. Does not feature any alerts and is best used manually after visually confirming the line displays. NB: Make sure to download M1 history before testing and use.
How to use: Simply attach to M1 or M5 chart. Zoom chart out completely. Sell when all lines above the white line (PriceLine). Sniper line crosses above white line. Buy when all lines below the white li
MetaTraderプラットフォームのためのアプリのストアであるMetaTraderアプリストアで自動売買ロボットを購入する方法をご覧ください。
MQL5.community支払いシステムでは、PayPalや銀行カードおよび人気の支払いシステムを通してトランザクションをすることができます。ご満足いただけるように購入前に自動売買ロボットをテストすることを強くお勧めします。
取引の機会を逃しています。
- 無料取引アプリ
- 8千を超えるシグナルをコピー
- 金融ニュースで金融マーケットを探索
新規登録
ログイン