YouTubeにあるマーケットチュートリアルビデオをご覧ください
ロボットや指標を購入する
仮想ホスティングで
EAを実行
EAを実行
ロボットや指標を購入前にテストする
マーケットで収入を得る
販売のためにプロダクトをプレゼンテーションする方法
MetaTrader 5のためのエキスパートアドバイザーとインディケータ - 88
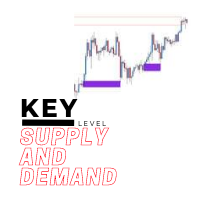
The key level supply and demand indicator is the first supply and demand indicator with options to change settings to show different zones, giving you the choice to pick the zones you see are being respected the most and saving the settings.
Advantages
The key level supply and demand DOES NOT REPAINT unlike other supply and demand currently in the market. This gives you a massive advantage to scroll back and see how price reacted on previous levels. The key level supply and demand

Get the MT4 version here ! Automate your range breakout strategy!
This EA alerts and/or places orders on range breakouts with additional filters. It works with all broker symbols and contains multi-symbol modes (market watch, major forex pairs or symbols in the list).
The default settings are for the EURUSD pair. The EA can also be used only as an indicator to receive range and range breakout alerts. Warning: before using this EA, please read its documentation on this page .
Functionaliti

This indicator helps to identify market sessions, It's High/Low, Open Range (OR), range of the sessions in pips and percentage of previous day (change%) under OHLC.
It is also editable for any brokerage market watch time. For traders who use session trading strategies such as Mark B. Fisher ACD it can be super effective, where they can edit OR from the settings to either line or box. We tried to make the settings easier to edit, for traders' use on different markets, charts and brokerage t

Expert Name : SWING BREAK _____Swing Break is a multicurrency pair EA that looks on the breakout on Daily Timeframe, this EA is using pending orders to see to it that it wont take false entry._____ Note !!!!!!DON'T USE Default Settings Below, USE THE RECOMMENDED SETFILES LINK BELOW.
Timeframe : D1
Variable
Value
Autolots
0.1
SL
5
TP
10
Expire
0
Trading Days
-----Filters-----
Monday
True
Monday Symbol
Tuesday
True
Tuesday Symbol
Wednesday
True
Wednesday Symbol
T

長い間待っていた、私の最初の製品がついに発売されることになりました。
私のスーパートレンド指標は、明確なエントリーシグナルとエグジットシグナルを提供します。
この指標はボラティリティベースであり、機能的にはトレンドフォローに近い指標です。
スーパートレンドの計算に組み込まれているATR指標を通じて、価格のギャップも計算され、見落とされることはありません。これにより、より正確な値を算出することができます。
ボラティリティを測定する場合、現在の価格の平均値が基準となる。
Supertrendは、ストップとリバーサルのラインを移動させるという特徴があるため、Parabolic SARと機能的に非常によく似ている指標です。
Supertrendは、常にトレンドの方向に動く指標です。
チャート上に赤と緑のラインが表示されるインジケーターです。緑色の線は上昇トレンド、赤色の線は下降トレンドを表しています。
トレンドは、既存の支持または抵抗のレベルを超えたときに反転する。
価格がシグナルラインを下方にブレイクした場合、これは潜在的な売りシ
Breakout EA based on advanced strategy , generates market entry signals when the price crosses a border of a certain price ranges. Data has been collected for over 15 years to produce model strategy. The strategy, filters out false signals and performs technical analysis and considers only the breakouts that show the best result.
It uses a system of filtering false signals. The EA uses advanced adaptive trailing stop. specifically optimized for EURUSD,GBPUSD,USDJPY,EURJPY,GBPJPY The

Expert Name : MULTI AXIS _____Multi Axis is a multicurrency pair EA with hedge strategy and correlates through other pairs and close it all with the tight value of 2 pips. This EA relays and get the signals based on price action, it can trade even high impact news._____
Variable
Value Autolots
250
SL
0 TP
0 Delta
40 Close All Pips
2 Close All Win Or Loss
11 Symbol
USDJPY,CHFJPY,EURUSD,EURCAD,USDCAD,NZDUSD,AUDCAD,AUDCHF
Beta Set False
False
Alpha Set True
True
Timeframe : M15

A Metatrade 5 technical Indicator made of the best trading strategy, very easy to use and to understand. Providing good and reliable signals for scalping and swing trading. Always killing the shower on any pair , whether currency’s, stock’s, index, community , Deriv synthetics and many more. TransitKiller is a very useful technical indicator system, that analyze the market using a unique technical strategy so that it can give accurate signal’s for buying or selling , and the bull’s and bear po
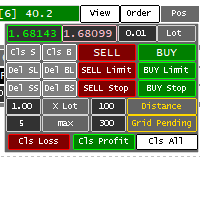
Panel for help Manual Trade if trader take order in multi Symbol/pair this will help more. this is look like hybrid dashboard in multi pair with small display
Panel have function : TP/SL, that also have funtion in Average TP/SL from BreakEvent (this will have for trader with multi trader in singgle pair) in Point can response multi Symbol
Trailing and Average Trailing from BreakEvent in Point can response multi pair. breakEvent in point Take Profit/Stop Loss in $ will detect in multi pair,
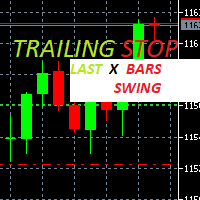
Trailing Stop loss last X candles swing high and low.
X is a value of candles you can set as an input parameter.
This Trailing stop loss moves the SL below the last X candles low(if BUY positions) or high(for SELL positions)
If we are in a trend and we open a position following the trend, the SL will be automatically placed at the low or high of the last X bars.
contact me if you need further assistence

- This is an implementation of OCC ==> open close cross - This indicator applies twelve different averaging methods to open and close prices separately to signal the trend switching. - All MA methods are set as input as well as period and different offsets applied to linear regression and ALMA averaging. - Buffers 16 and 17 can be used in EAs to detect trend direction. - You can message in private chat for further changes you need.
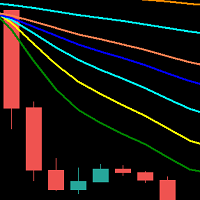
Multicolor moving average (8x). Define period, color, line width. Set period =0 to off moving average.
The moving average (MA) indicator is one of the most used technical indicators for forex traders. It's a formula used to calculate the averages of a market's movements over a longer time period (usually weeks or months rather than days) to identify trends , which is vital for a good forex trading strategy.
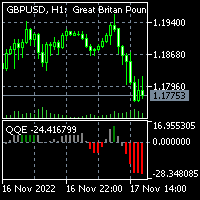
To download MT4 version please click here . - This is the exact conversion from TradingView: "QQE mod" By "Mihkel00". - It can be used to detect trend direction and trend strength. - Gray bars represent weak trends. You can set thresholds to achieve better accuracy in detecting trend strength. - There is buffer index 15 to use in EA for optimization purposes. - The indicator is loaded light and non-repaint. - You can message in private chat for further changes you need.

Trading strategy: Scalping at night. The EA is based on a complex trading system at night. The essence of the Adviser's strategy boils down to the fact that the expert determines the calmer moments on the chart using complex mathematical calculations and then if there are good moments to enter the market, the adviser opens pending orders. The EA uses complex algorithms to recognize Trend and Flat situations on the charts. The EA automatically adjusts GMT for each broker (not for the strategy tes
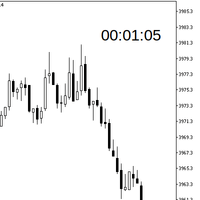
A simple indicator to help showing the remaining time until the candle closes for all pre-defined chart periods with the following formats depending on which timeframe the chart is on. DD:HH:MM:SS - in case of W1, and MN period HH:MM:SS - in case of other periods Included with some of configurations as follows (please see attached inputs screenshot) X/Y distance to the upper right corner of the chart window Text size Text color Show/hide
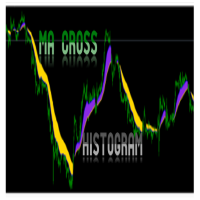
MA Histogram is MT5 Indicator for beginners which plot a histogram after Moving Average Crossover of 2 MAs. The Indicator does not have arrow or alert. It will simply plot on chart the potential Up and Down trend when trend is beginning or ending. It will show a Blue color for potential up trend and Gold color for potential down trend. Recommended Pairs: ALL Pairs including Indices for MT5 FOREX BROKERS Recommended Pairs On Deriv: BOOM 1000, Boom 500, Boom 300 and CRASH 1000, Crash 500, Cra
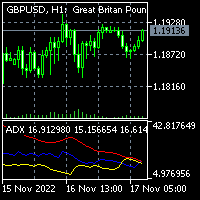
This is a two in one indicator implementation of Average Directional Index based on heiken ashi and normal candles. Normal candles and Heiken Ashi is selectable via input tab. The other inputs are ADX smoothing and DI length. This indicator lets you read the buffers: +di: buffer 6 -di: buffer 7 -adx: buffer 10 Note: This is a non-repaint indicator with light load processing. - You can message in private chat for further changes you need.

It can help with manual traders. EA have following features with risk management. Sell Buy Close sell Close buy Close all Manual Trade Panel EA MT5 Installation In order to buy Manual Trade Panel EA MT4/5 from MQL5.com Market you need to have a MQL5 community account. If you don’t have one, you can register here: https://www.mql5.com/en/auth_register. 1. First make sure that you have the necessary funds required for your purchase in your MQL5 account, it's always easier to pay with your MQL5 bal

Buy and Sell Targets Indicator
You can see the buying and selling goals in the box and they are inevitably achieved.
It consists of three lines: the first green color sets buying targets, the second red color sets selling targets, and the third blue color is the average price.
Trading Method
For Buy Trade:
The entry point will be where the wavy blue line (representing the average price) is 'broken' by the ascending 'Buy' candle from beneath
Please wait until the next candle appears

This EA is a Trend Following EA. It can place trades using a Fixed Lot size or Percent Risk and has an optional Trailing Stop to lock in Profits. Stop Loss is set automatically Take Profit is set using your desired Risk to Reward Ratio. Does not take trades every day for every pair. Average 10 trades per month with default settings but can have many more based on settings. Ultimate Trend Trader does not use a GRID or MARTINGALE system but simply maintains profitability by Risk to Reward (U
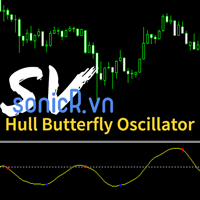
The Hull Butterfly Oscillator (HBO) is an oscillator constructed from the difference between a regular Hull Moving Average ( HMA ) and another with coefficients flipped horizontally . Levels are obtained from cumulative means of the absolute value of the oscillator. These are used to return dots indicating potential reversal points . This indicator draw line in separate window, plus blue dot (for buy signal) when hull oscillator is peak and red when sell signal. It also includes integrate

This EA uses a combination of a Martigale strategy along with bollinger bands, which allow it to improve the effectivity. It run in low timeframes, which generates a lot of entries.
This is the V1.0 of the strategy. By now, it only sells. The idea is to improve not only the net profit but also the max DD and profit factor by introducing improvements like allowing buy as well or making the take profit dynamic.

Relativity Power EA is based on RSI Indicator,Pivot points and lots of indicator has been used to create this Expert, Uses Hedging when it gets a signal.
Variable
Value Autolots
0.0001
RSI
14
Buy Cross Above
50
Sell Cross Below
50
ATR
14
ATR SL
5
ATR TP
10
Candle ID
1
Beta Set False
False
Alpha Set True
True
Timeframe : M15
Recommende Pairs : CFD's Cash Indice s : SWI20Cash,GER40Cash,SPAIN35Cash,FRA40Cash,EU50Cash,AUS200Cash,US500Cash
Forex : EURGBP,USDCHF,GBPUSD
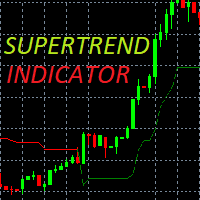
A super-trend indicator is plotted on either above or below the closing price to signal a buy or sell. The indicator changes colour, based on whether or not you should be buying. If the super-trend indicator moves below the closing price, the indicator turns green, and it signals an entry point or points to buy. If a super-trend closes above, then the indicator shows a sell signal in red. You will also note that at the point where buy or sell signal is generated is the crossover point. At the p

同期されたクロス インジケーターを使用すると、複数のチャート ウィンドウからクロスヘアをリンクできます。これは、チャート上の十字線を移動すると、別の時間枠で他のすべての十字線が自動的に移動するため、ユーザーは市場の動きとタイミングごとに取得するターゲットを簡単に識別できることを意味します。
十字線の使用方法:
1)開いているすべてのチャートをドラッグ&ドロップした場合
2)チャートクリックのいずれか
A を押して Active Cross Hair を表示し、すべてのチャートを表示します。
D を押すと、十字線が非アクティブになり、線またはチャートが削除されます。
たとえば、マウス ポインターを M5 時間枠 (スクリーンショットを参照) に移動すると、十字線は高い時間枠では線として表示され、低い時間枠または高い時間枠では領域として表示されます。これにより、時間枠を簡単に関連付けることができます。
秒単位の更新で現在の市場情報を表示します。 スプレッドサイズ; 利益表示金額: ショート ポジションとロング ポジションの場合。 利益表

*ジグザグを修正して加速しました。 (範囲は変更できます) * ジグザグは、新しいキャンドル/バーごとに更新されます。 ※必要に応じて、ボタンを有効にして、ボタンをクリックしたときだけパターンを検索します。自動的に行うと、チャートが更新されるたびに検索されます。 * 17 の頻繁に使用されるハーモニック パターンと、独自のプロポーションを定義できる特別なパターン。 *価格表示でチャートをシンプルに保つことができます。必要に応じて、三角形の表現を作成できます。 ※「ヒストリーモード」で過去の公演を振り返ることができます。 ※再塗装はしておりません。 ※パターンルールが無効な場合、パターンは削除されます。価格が所定の水準に達した場合、売買が可能です。 * 注: 他のすべてのパターンを「false」に設定し、独自の比率を設定できます。履歴モードで独自のパターンをテストできます。満足のいく結果が得られたら、テンプレートとして保存できます。
* パターン: * Custon パターン (あなたの特別な比率) *ガートレー * GarleyV2 * 蝶 *ButterFlyV2 * バット
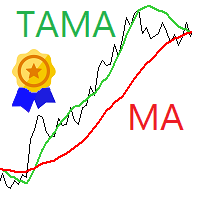
Short description : TAMA is, at its core, a novel method for correcting moving averages (MAs) during trends. | This usually also results in better smoothing and a significantly lower time delay (lag) of the MAs. | The indicator can additionally be used for price forecasts and band formation, also combined. | TAMA received an award from VTAD in 2022. |
Honored with the VTAD Award 2022 (VTAD = Association of Technical Analysts Germany, German branch of IFTA).
Core Features :
Classic MAs

The Hourly Scalper EA is Trading On Selected Hours and Selected Pairs. This is a simple EA which looks on the Hourly chart and trades even on the news depends on what you set is true on the parameters. It will Automatically put a Pending Orders BuyStop and SellStop based on the Gridsize you put on the Value Parameters. Parameters : Variable
Value
Autolots
1000
SL
50
TP
100
Gridsize
50
Expire
4
Max_Order
1
Hour Settings Server Time
=====Parameters=====
10-10.1 Hour
true

ブレイクイーブンボタンは、あなたの生活を非常に簡単にする便利なツールであり、同時に複数の取引が進行中の場合にチャートを見栄え良くします。ブレイクイーブンボタンをクリックするだけで、利益の出ている現在のポジションを一括でブレイクイーブンに設定できます。そのため、損失リスクから解放され、複数の取引がオープンしている場合でも作業が容易になります。たとえ一つの取引であっても、ボタンを使用することで素早く行動でき、重要な状況で役立つことがあります。特に短時間フレームではそうです。ボタンにはカスタマイズするためのいくつかの設定オプションもあります。
将来的には、ボタンには忍耐強い利益確定などのさらなる機能が追加される予定ですが、それは遠い未来の話です。
重要な点: ブレイクイーブンボタンは、すべてのポジティブなポジションをブレイクイーブンに設定するものではありません。現在のチャートの取引のみが対象です。たとえば、EURUSDとXAUUSDのポジションがあり、両方の取引がプラスであり、XAUUSDのチャート上でボタンを押すと、XAUUSDの取引のみがブレイクイーブンに設定されます。Aut

HTF CAD JPY is a fully automated Expert Advisor designed for CAD JPY trading. It is based on cluster analysis of machine learning and genetic algorithms. The Expert Advisor contains a self-adaptive market algorithm that uses price action patterns and standard trading indicators. The entry and exit logic works only when a bar closes. It filters market noise, greatly speeds up optimization, avoids stop-loss hunting and ensures correct operation at any broker with a reasonable spread. The Expert

Introducing the "Range Breaker". Range Breaker is a daily breakout EA that allows you to define a custom daily time range. Once the designated time range elapses, the "Range Breaker" place two STOP/LIMIT orders at the upper and lower limits of the range. This approach allows to automate daily ORB strategies. Once the day range is over, you can decide whether to keep the orders or to close/delete them.
It also counts with several filters such as - News - Inside Bar range - Trend - Narrow rang

説明 J. ウェルズ ワイルダーによって開発された相対力指数 (RSI) は、価格変動の速度と変化を測定するモメンタム オシレーターです。 RSI は 0 から 100 の間で変動します。伝統的に、RSI は 70 を超えると買われ過ぎ、30 を下回ると売られ過ぎと見なされます。シグナルは、発散と失敗の揺れを探すことによって生成できます。 RSIは、一般的な傾向を識別するためにも使用できます.
このEAの仕組み RSI は 70 を超えると買われ過ぎと見なされますが、EA はそれ以上を使用して、注文を受けるに値する買われ過ぎであるかどうかを検出および検証しています。
Description The Relative Strength Index (RSI), developed by J. Welles Wilder, is a momentum oscillator that measures the speed and change of price movements. The RSI oscillates between zero and 100. Traditi
Itrade manager expert advisor (EA) is a type of software that can be programmed to perform a variety of tasks related to managing trades in the financial markets. Some of the ways in which the Itrade manager EA can help you trade better include: Itrade manager EA can automatically modify, and close trades based on predefined rules and conditions, freeing you up to focus on other aspects of your trading strategy. Managing risk: Itrade manager EA can help you manage risk by placing stop-loss and t

The Trima EA's strategy is based on the position of various moving averages. The Stop Loss is calculated automatically from ATR and SMA and the Take Profit using the rrr value. Trima EA was developed for the 1 minute timeframe but can be used on any timeframe. For the best result test the EA on the forex pair EURUSD. The last screenshot contains the corresponding settings for many forex pairs on the 1 minute chart, so the Trima EA can also be used without intensive testing. For more symbols or o
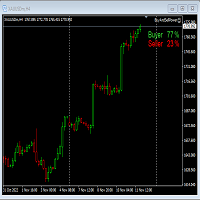
This Expert Advisor will not place any trade.
This Expert Advisor will only show the buyer and the seller power in percentage on the upper right corner of the selected chart. The percentage of the Buyer and Seller is calculated based on the Open, Close, High and Low price of the selected candle.
Candle can be selected using the shift on the Input Tab where 0 means the current candle, 1 means previous 1 candle before the current candle.
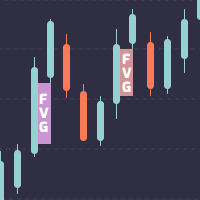
MetaTrader 4 の公正価値ギャップ インジケーター。
フェア バリュー ギャップは、有名なスマート マネー トレーダーであるインナー サークル トレーダー (別名 ICT) によって教えられた 3 つのローソク足の価格行動パターンです。 基本的に、これは価格の動きが速すぎる場合にチャート上に開いたままのギャップです。 それは、左のローソクとその隣の右のローソクが重なったティックを取得しない中央のローソクの本体の領域です。 価格がチャートにギャップを残す場合、2 つのことを念頭に置くことができます。 1つ目は、価格がその方向に向かう非常に強い勢いを持っていること、2つ目は、価格がその方向に向かう前に、ギャップを埋めるために通常リトレースすることです.
フェア バリュー ギャップは、プライス アクション トレーダーの間で最も一般的に使用され、プライス デリバリーに非効率性または不均衡がある場合として定義されます。 この非効率性は、以前は約定されなかった多くの残りの注文があるため、この価格の不均衡を再調整するために将来的に価格を引き付ける可能性があります。 トレーダーはこ

Robotizz Indicator is a powerful trading indicator using price action and moving averages. Robotizz indicares with arrows on long trades ir short trades, showing some TP and SL points too. It works with any symbol, even on forex markets or B3 Brazilian markets. You can configure moving averages periods, besides simple or exponential moving averages. Also it is possible to configure arrow position. Try Robotizz for one month and take a boost on your manual trades.

!! BLACK FRIDAY !! FOR LIFETIME !! ================== == 35$ ONLY !! == ==================
BOOK YOURS NOW !!
The Position Manager Contains A Lot of Functions such as; (How to Operate) 1. Adjustable Volume per Trade (You could change the volume as you wish per trade). 2. Adjustable Risk : Reward Ratio (1RR means sacrifice 1 Risk : 1 Reward, 1.5RR, 2RR etc. as you wish) 3. Adjustable Stop Loss Points (Calculated Points as Stop Loss and Automatically adjusted the Risk Reward Ratio) 4. Buy Butt
現在、ホリデーディスカウントで399ドル! 今後値上がりする可能性があります。以下の説明をお読みください。
Ultimate Dynamic Levelsの紹介 - Ultimate Sniper DashboardのBESTエントリーインジケーター! 極めてローリスクなタイムリーエントリーと高RR!!!
アルティメットスナイパーダッシュボードはこちら。 初心者はもちろん、プロのトレーダーにとっても最も重要な能力は、いつどこで相場が転換するかを正確に判断し、いかに安全に参入し、利益を得て退場するかを見極めることです。
アルティメット・ダイナミック・レベルズ・インディケーターは、相場が転換する可能性が最も高い場所を簡単に教えてくれるので、極めてローリスクなトレードを自信を持って行うことができ、同時にチャートをクリーンでシンプルに保ちながら、$$$を稼ぐことができるのです!
アルティメット・ダイナミック・レベルズ・インディケーターは、複数の時間枠で重要な隠れたレベルを一度に見つけるユニークで強力なアルゴリズムを持っています。また、他の典型的なSRインジケーターのように、レ
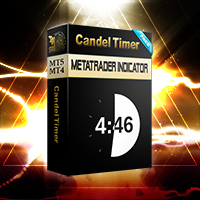
300 downloads without review ? !!!!
If continued. I will not share any product for free. :( Small and very simple timer next to the current price to show the end time of the current candle
Very useful and important for scalpers and those who work on price action.
We assure you that we welcome any suggestions to improve this indicator and make the necessary changes to improve this indicator.
You can contact us via Instagram, Telegram, WhatsApp, email or here. We are ready to answer you.

The indicator returning pivot point based trendlines with highlighted breakouts . Trendline caculated by pivot point and other clue are ATR, Stdev. The indicator also includes integrated alerts for trendlines breakouts and foward message to Telegram channel or group if you want. Settings · Lookback bar: Default 200 is number of bar caculate when init indicator. · Length: Pivot points period · Slope Calculation Method: Determines how this lope is calculated. We supp
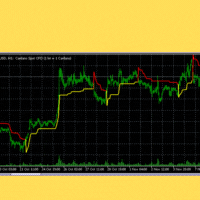
スーパートレンドは、前述のように、トレーダーがトレンドを特定し、金融資産をいつ売買するかを知るのに役立つように、オリビエ・セバムによって開発された比較的人気のないテクニカル指標です。このインディケータは、TradingView と MetaTrader のデフォルトとして見つかりません。それでも、カスタムメイドの Supertrend インジケーターを市場で見つけることができます。
チャートに適用すると、スーパートレンド インジケーターは 2 色で表示されます。これらは変更できますが、デフォルトの色は通常、赤と緑です。緑色の場合は資産を購入するシグナルであり、赤色の場合は資産を売却するシグナルです。
スーパートレンド インジケーターは、すべてのタイムラインでうまく機能します。日足チャートや週足チャートなどの5分以上のチャートのような短い時間枠で機能します。
売買シグナルを特定する 上に示したように、売買シグナルはスーパートレンド指標でよくマークされています。価格がインジケーターの緑色の部分を上に移動すると、買いシグナルが現れます。
一方、インジケーターの赤いセ

価格チャートのマーケット セッション インジケーターは、ニューヨーク、ロンドン、東京、シドニーの取引時間を示しています。各取引セッションの開始時間と終了時間は手動で設定できます。
特徴:
メイン セッションを表示: シドニー、東京、ロンドン、ニューヨーク。 色付きの線でハイライトし、オブジェクトを描画します。 重複するセッションのセッションのボラティリティをグラフィカルに識別できます。 パラメータを含む 18 個の可動パラメータが含まれています。
シドニーセッション開始 - シドニー取引セッション開始時間 シドニーセッション終了 - シドニー取引セッション終了時間 シドニーセッションの色 - 価格チャートのシドニー取引セッションエリアの色 東京セッション開始 - 東京取引セッション開始時間 東京立会終了 - 東京立会終了時間 Tokio session color - 価格チャート上の東京取引セッションエリアの色 ロンドンのセッション開始 - ロンドンの取引セッション開始時間 ロンドンのセッション終了 - ロンドンの取引セッション終了時間 ロンドン セッションの色 - 価

Trend Follower predicts the possible start of a trend, the indicator uses as a basis for the closing high possibility of the indicators to identify a possible entry or low possibility, the indicator just an entry parameter which can be the period .
Input parameters Period : A positive integer that indicates the period for number
Alert: Sends an audible signal when a signal occurs
Check out other products: https://www.mql5.com/en/users/junioredj16/seller

Symbol Changer this Indicator for make more easy when change Chart pair, this more usefull if trader make deal with many pair.
Property Input Indicator Custom Unique ID : Indicator have Id for make different. Show Profit Loss : Adjustable for Show or no Profit and Loss Option Horizontal/Vertical button : Button can change Horizontal or Vertical. Option Window : Adjustable in main Chart as window or buttom chart as Window 1, 2 Main Pairs Preset / Own Pair : available group pair for make easy ha

TransitBlueOcean is indicator system that uses ocean wave's pattern, to help one to know when to buy and when to sell. The indicator system is very powerful like the ocean waves. Join the mql5 channel for TransitBlueOcean https://www.mql5.com/en/channels/transitblueocean How to use: Zoom in so that the Ocean will appear on your chart.
Buy when you see the candles, the candle will be above the ocean wave (buying signal).
Sell when you can't see the candles, the candles will be inside the w
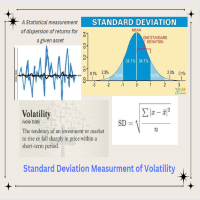
Standard Deviation Pivot Point will enhance your trading and highlight great trade opportunities with the Support and Resistance levels that professionals use based on volatility of market. Standard Deviation Pivot trading is a simple effective method for entry and finding targets that are statistically on your side, highlighting market key levels has been used by professionals for decades and is effective on all symbols: Forex, Crypto, Stocks, Indices. Standard deviation is a measurement if vol

You Can Copy All the Trades from one MT5 terminal to another MT5 terminal hosting two different accounts in the same computer or VPS. It will work with same broker as well as different broker. You can also use it to copy from MT5 to MT4, then you also need to download the MT4 version and set the SEND and RECEIVE accordingly. MT4 version download- https://www.mql5.com/en/market/product/83400 Note: While Testing with demo version, do not use real account, as it will not copy. If your trades are
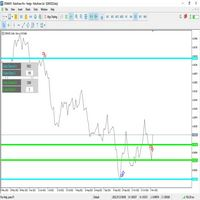
プライスチャンネルは、2つの独立したプライスチャンネルとプライスゾーンのレベルで構成されています - (A / B). このインジケータは、常に価格の挙動と動きを監視し、チャネルレベル(A / B)の破壊、レベルの再配置、極値および極小値の新しいゾーンの固定を行います。 以前の高値と現在の安値の分析については、各チャンネルのバーの数 - (A / B)に依存することはありません。 チャート上の各チャンネルに有用な情報を表示するインジケーターです - (A/B)。 1. 各チャンネルの解析で指定されたバーの数。 2. デルタ - 各チャンネルのレベル間の距離。
1. インジケータのアプリケーション例:最大値と最小値(上または下)のゾーンと新しいローカルレベルを検索して更新するために、チャネルで - (A)は、範囲を指定します - (100 - 500)バー例えば。チャンネル(B)は使いたくないので、チャンネル(B)には(0)バーを表示します。 B)チャネルの水準は、チャート上では消えてしまい、私たちの邪魔をすることはありません。 2. インジケータアプリケーションの例:狭い廊下で価
Robot usage: RSI, EMA, MFI to open trade.
RSI — Relative Strength Index — is an indicator created by Welles Wilder. The main objective for this indicator is to measure the strength of an instrument now against its history. To do it, the indicator compares price changes of up days to down days. The RSI indicator is a momentum as it shows the velocity of the upward or downward market movement, is an oscillator as it is bounded and oscillates between 0 and 100 level, and is a leading indicator a

This is 3 pre-filtered CCI, Commodity Channel Index, indicators pre-filtered by your choice of 3 Smoothing and/or Averaging methods. I have found certain settings to be very reliable and I plan to incorporate this into an Expert Advisor in the future. I have added a new form of Averaging: Smoothed TEMA, or Triple Smoothed EMA, Exponential Moving Average. It gives less noise than the TEMA, but provides the smoothing of the Double Smoothed EMA, so it should be a slight bit quicker. PLEASE Download

Binance Utilites help in view and manage your Binance Assets. This utilities comes as Expert Advisor and only need to be attached to any chart, don't mind the account, can be a demo account of any broker. This EA connects to your Binance account to retreive the information.
Detailed information and How To Setup
https://www.mql5.com/en/blogs/post/750912 Automatize subscription on not full time available stake products https://www.mql5.com/en/blogs/post/751114
And on SFE Telegram Group (Fin

Hush mt5 is an advanced indicator that gives a signal about the overbought or oversold market in a certain period of time
Hush mt5 the advantage of this indicator is that it does not disappear after the signal on the chart
Suitable for any trade: forex, stocks, cryptocurrency, metals
Hush mt5 can be used on any time period. The signal goes to the beginning of the next candle after the arrow
Hush mt5 performed best on the period H1,H4,daily
It can be used in addition to forex, in binar

( MT5 FILES ) For MT4 version : https://www.mql5.com/en/market/product/88697 Capability
MT4 to MT4, MT4 to MT5, MT5 to MT5, MT5 to MT4 Features Minimize button Close All button ROLE selection : Master / Client Master pairing : direct input Indicator lamp : Green -> Master distributing signal. Blue -> Client connected to the Master. Red -> Master key pairing not found. Master Features Reset button : Resetting the account list to the ea input. Add account : input the client account
Here is an EA based on the Renko indicator, it can be used with currencies, commodities, and forex. Just associate it with the corresponding graph.
The indicator used for the EA is available here, but it is not necessary for its operation, they are 2 independent products: https://www.mql5.com/fr/market/product/87852?source=Site +Market+MT5+Indicator+Search+Rating006%3agino+renko
Personally I don't like renko like EA, and I haven't done any tests to find out which configuration is the best.
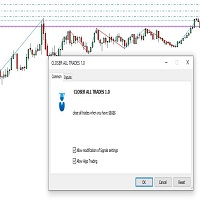
VIDEO https://youtu.be/qDMbdJU8wWA Close your trades when you have X$ in profit or Y$ in loss. Closing all trades automatically and pending orders. Use your strategy and start being a winner You can have more information about my robot at video Feche todas as suas ordens instantaneamente no lucro ganhe muito dinheiro fazendo scalper de uma forma que nunca viu! o robo fecha todas as ordens quando atingir o lucro em $$$ e apaga as ordens pendetes! Veja o video é tudo automatico CLOSE YOUR TRADE I

The utility displays in a convenient form the historical trades made on the account. You can filter trades by magic or comcent, display only profitable or losing trades, and only buy or sell trades. Using this utility, you can see trade entry and exit points, stop loss and take profit levels, trade profit, magic number and comment, order ticket and order size - you only need to run the utility on the chart of the currency pair you want information on get and customize the input parameters. MT4

アラートメールを送信することにより、アカウント情報をリアルタイムに知ることができるツールです。
アラートの機能は次のとおりです。
1. フローティング損益アラート、設定した利益額と損失額に達すると、EAから自動的にアラートの詳細がメールで送信されます。
2. 2. 注文の開始と終了のアラート、あなたのアカウントにオープンポジションとクローズポジションがあると、EAは自動的に電子メールで詳細なアラートを送信します。
3. 3. 複数シンボル気配値アラート:お客様が設定した気配値が上昇または下降すると、EAが自動的にアラートの詳細をEメールで送信します。
上記全てのアラート回数をカスタマイズすることができます。
使用方法
1. MT5クライアント-ツール-オプション-電子メール ,電子メール設定を完了し、それを有効にします。
2. MT5クライアントにEAをロードし、自動売買を有効にします。
EAのパラメータ設定の説明
損益アラートのパラメータは以下の通りです。
1. TPは利益額、SLは損失額を設定し、その額はFloating P

The Expert Advisor is real trading strategy that does not use any grids, martingales or other dangerous functionalities. The EA has been developed for GBPJPY M15 based on Range Breakout. It has been backtested on tick data with 100% quality of modeling. There is no need to set up any parameters, all settings are already optimized and fine-tuned. I recommend you always do your own testing with your broker. My recommendation is to have a look also on the rest of my products in the portfolio as

The Expert Advisor is real trading strategy that does not use any grids, martingales or other dangerous functionalities. The EA has been developed for GBPJPY M15 based on Range Breakout. It has been backtested on tick data with 100% quality of modeling. There is no need to set up any parameters, all settings are already optimized and fine-tuned.
FX Blue - find strategy with magic number # 225108 I recommend you always do your own testing with your broker. My recommendation is to have a l
This indicator will mirror the assets in use in another Metatrader, being able to choose the timeframe and a template. This is the Metatrader 5 Server, it can work with Metatrader 4 or 5 Client versions: Metatrader 4 Mirror Chart Client: https://www.mql5.com/en/market/product/88649
Metatrader 5 Mirror Chart Client: https://www.mql5.com/en/market/product/88650 Details of how it works in the video.

Hello ! If you scroll in one chart, all charts will be scrolled If you change the time frame in one chart, it will change in all charts Of course, you can turn this feature on or off All the charts in which you want changes to be applied are specified through ID in the indicator settings You can scroll the charts of different time frames in two ways at the same time 1: Coordinated based on time That is, 1 hour candle is 60 candles one minute back 2: scroll in the form of number of candles That i
Dear trader, others have seen what is and asked why. We have seen what could be and asked why not. We present to you, The Sandman.
This is an MT5 scalping robot designed to give you a pleasant and simple trading experience. The market is chaotic and unpredictable. Even the most experienced traders get it wrong due to one reason or the other. We imagine it would be a liberating experience to have a robot that makes predictions and makes the bold moves in your stead. This was the very intent
The Black Swan Trading Panel was designed and built to make trading as easy as possible. Track any trading instruments with multiple time frames on one chart and thus have a complete overview of the market situation. The Black Swan Trading Panel uses three custom indicators that will give you a clear overview of the market situation regarding trend, price deviations and support/resistance zones. This indicator is highly customizable and therefore suitable for every type of trading. With this too
Multi Symbol ZigZag Breakout Scanner は、マーケットウォッチで選択されたすべてのシンボルをスキャンします。
価格がこれらのレベルに到達しようとしているときに、ダブル トップ、ダブル ボトム、または任意のフィボナッチ エクステンション レベルを簡単に見つけるのに役立ちます。
Timeframe と、Zigzag の複数の Extdepths (最大 3 つ) を選択できます。 推奨される ZigZag は 21、34、および 55 で、すべてのタイプの Zigzag とフィルター ノイズをカバーします。
端末アラートまたはプッシュ通知のいずれか、または両方を受信するように設定できます
Multi Symbol ZigZag Breakout Scanner は、マーケットウォッチで選択されたすべてのシンボルをスキャンします。
価格がこれらのレベルに到達しようとしているときに、ダブル トップ、ダブル ボトム、または任意のフィボナッチ エクステンション レベルを簡単に見つけるのに役立ちます。
Timeframe と、Zig

Neural Bands is a scalping indicator. There are 2 different deviation bands for oversold and overbought levels. Color candles are to determine the trend if it passes the deviations and is showing a strong trend or if the color candles stop at the deviations and revert back to the mean. This indicator is a type of regression indicator trading ranges and breakouts in price. 15 min charts and above recommended. TRADE WITH THE LARGER TREND DIRECTION

インディケータは現在のクオートを作成し、これを過去のものと比較して、これに基づいて価格変動予測を行います。インジケータには、目的の日付にすばやく移動するためのテキスト フィールドがあります。
オプション:
シンボル - インジケーターが表示するシンボルの選択;
SymbolPeriod - 指標がデータを取る期間の選択;
IndicatorColor - インジケータの色;
HorisontalShift - 指定されたバー数だけインディケータによって描画されたクオートのシフト;
Inverse - true は引用符を逆にします。false - 元のビュー。
ChartVerticalShiftStep - チャートを垂直方向にシフトします (キーボードの上下矢印)。
次は日付を入力できるテキストフィールドの設定で、「Enter」を押すとすぐにジャンプできます。
Next Candle Timer Pro displays the remaining time before the current bar closes and a new bar forms. It can be used for time management with trade to wait next moments. Feature Highlights Tracks server time not local time Configurable Text Color and Font Size Optional Visualization of the Symbol Daily Variation Optimized to reduce CPU usage Every time frame will automatic get remain timing. Input Parameters Color as Label Anchor of the label a sort assign Position of timer: true/false Text Font

UPDATE v1.0 IS OUT - PLEASE READ ALL THE DESCRIPTION BEFORE USE IT "like all expert advisors, LL Magnetic EA works for you, but you can't always leave it alone. use it with care and attention, choose a time slot and decide your money management first. the best results are obtained by using with care, avoiding important news that generate large movements and keeping the EA off on high volatility days. the key to success is always the management of your tools, remember that" L.Licari LL Magnetic

BC Juice mt5 (ビッグ キャンドル スキャナー) は、ポートフォリオに入れるべき強力なツールです。その最も重要な特徴の 1 つは、85% の確率で市場で「反転」を見つけた場合に成功する可能性が高いことです。
Martin Gale や Grid を使用していません。これは、Heiken Ashi インジケーターによって提供されるトレンドの独占的な確認に加えて、非常に十分に根拠のある実績のある戦略です。
Experts Advisor は、反転の可能性が高い領域に参入しようとしますが、市場の急激で強い動きは、この EA の運用にとって最良の味方であることが確認されています.不安定で不安定な BC Juice mt5 EA は、経済カレンダーの金融ニュース レポートの恩恵を受けており、世界経済の不安定性によって生じる市場の潜在的でつかの間のターンを利用するのに理想的な EA です。
BC Juice mt5 EA のデモをダウンロードして、その見事なパフォーマンスをご自身で確認してください。AUD/USD ペアですぐに使用できる構成が付属しており、最近の最適化はわ
MetaTraderマーケットはMetaTraderプラットフォームのためのアプリを購入するための便利で安全な場所を提供します。エキスパートアドバイザーとインディケータをストラテジーテスターの中でテストするためにターミナルから無料のデモバージョンをダウンロードしてください。
パフォーマンスをモニターするためにいろいろなモードでアプリをテストし、MQL5.community支払いシステムを使ってお望みのプロダクトの支払いをしてください。
取引の機会を逃しています。
- 無料取引アプリ
- 8千を超えるシグナルをコピー
- 金融ニュースで金融マーケットを探索
新規登録
ログイン