YouTubeにあるマーケットチュートリアルビデオをご覧ください
ロボットや指標を購入する
仮想ホスティングで
EAを実行
EAを実行
ロボットや指標を購入前にテストする
マーケットで収入を得る
販売のためにプロダクトをプレゼンテーションする方法
MetaTrader 5のためのエキスパートアドバイザーとインディケータ - 26

The Big Mac B MQL5 expert advisor is a based off a Bollinger breakout strategy. The MACD indicator is used to confirm either a buy or sell trend. The MFI indicator to act as a trading range to ensure that the buy or sell is not activated when the price is in an overbought or oversold condition.
Trades will only be entered if the current price is within the trading range of the MFI indicator. Default settings are for the USDJPY on the 5 minute time-frame.
To work with the news server, you must
FREE
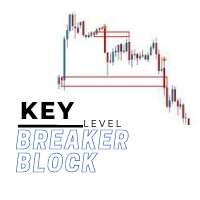
The key level breaker block indicator automatically draws breaker blocks for you on the chart. Breaker blocks are, in short, failed order blocks, but create strong support and resistance zones when price comes back to re-test them.
Advantages
The key level breaker block DOES NOT RE-PAINT, giving you confidence when a signal appears and also helps when looking back. The key level breaker block includes an on/off button on the chart to easily keep the charts clean after analysis by just on
GoDaekSun 是根據信號產生器做出交易決定後再根據現有的資金量調整下單的單量 設計目的希望所有參與交易的交易者,都能夠獲取合理的利潤
值得注意的是,過去的歷史回測匯或許會有相當大的利潤發生.但是將來的行情型態是不可知的.所以不要盲目地相信EA會創造出絕對的利潤,但也不要一昧地認為自動交易就是不可取的
特點
自適應的交易信號: 根據市場狀況自動調節信號產生的條件 簡單的設定方式: 只需簡單的設定即可. 單品種交易: 根據信號產生器做EURUSD單品種的交易 無華麗顯示面板: 將算力完全用在交易程序的計算 可以更高效續的執行工作 長期交易策略: 穩定的市場狀態時才會執行開單平倉 安全的風險控制: 在當前行情不例於持倉狀況時安全認損 不會早造成爆倉或是大量虧損
環境
使用時間框 M15 交易品種 EURUSD (品種必須列在報價清單上) 啟動資金使用1500美金即可運行 免費版只能交易EURUSD 正式版可以交易多品種 購買或是測試可以聯繫我取得適當的參數
運行淨值保持在2500美金以上 能更加確保交易帳戶的安全
參數
Magic :
FREE

入力信号平均フィルターを備えたトレンド追跡インジケーター
このインジケーターは、移動平均をエントリーシグナルとして使用し、トレンドトラッカーおよびフィルターとして機能します。 移動平均は、さまざまなトレンドの範囲を決定するための鍵となります。
- 標準的な 200 期間の一次平均は、長期的な傾向を示します。 - 50 期間の二次平均は中期的な傾向を示します。 - 20 期間の三次平均は、最も短い傾向を示します。 - 9 期間の平均は、即時アクションのエントリートリガーとして機能します。
このインジケーターはトレーダーにとって貴重なツールであり、市場トレンドの正確かつ包括的な分析を提供し、慎重に選択された移動平均に基づいてタイムリーなエントリーポイントを特定します。
エントリーシグナル平均フィルターを備えたトレンド追跡インジケーターを使用して、取引戦略を強化し、より多くの情報に基づいた意思決定を行います。 今すぐダウンロードして取引結果を高めましょう!
FREE

Что такое Awesome Oscillator? Создателем данного индикатора является Билл Вильямс. Этот трейдер разработал собственную торговую систему. Её основой служит постулат: «Рынок движется хаотично. Какие-либо закономерности этого движения вывести довольно сложно, так как многое зависит от психологических факторов.» Поэтому Вильямс разработал собственные инструменты для анализа рынка.
Одним из таких инструментов и является индикатор АО. Это осциллятор, который дает возможность выявить силу текущего
FREE

ストキャスティクス オシレーターのマルチ通貨およびマルチタイムフレームの変更。パラメータで任意の通貨とタイムフレームを指定できます。パネルには、シグナルとメイン (ストキャスティクス クロスオーバー) のラインの現在の値と交差点が表示されます。また、インジケーターは、買われすぎレベルと売られすぎレベルを横切るときに通知を送信できます。ピリオド付きのセルをクリックすると、このシンボルとピリオドが開きます。これが MTF スキャナーです。
通貨強度メーター (CSM) と同様に、ダッシュボードは、指定された通貨を含むペア、またはその通貨を基本通貨とするペアを自動的に選択できます。インジケーターは、「ペアのセット」で指定されたすべてのペアで通貨を検索します。他のペアは無視されます。これらのペアに基づいて、この通貨の合計ストキャスティクスが計算されます。そして、その通貨がどれだけ強いか弱いかを確認できます。
ダッシュボードをチャートから非表示にするキーは、デフォルトでは「D」です。
パラメータ %K Period — K ラインの期間。 %D Period — D ラインの期間。

このインディケーターはダブルトップとダブルボトムの反転パターンを見つけ、ブレイクアウトを使用して取引シグナルを発生させます。 [ インストールガイド | 更新ガイド | トラブルシューティング | よくある質問 | すべての製品 ]
クリアな取引シグナル カスタマイズ可能な色とサイズ パフォーマンス統計を実装します カスタマイズ可能なフィボナッチリトレースメントレベル 適切なストップロスとテイクプロフィットのレベルを表示します 電子メール/音声/視覚アラートを実装します これらのパターンは拡張でき、インジケーターは再描画によってパターンに追従します。ただし、インジケーターはトレードを容易にするためにツイストを実装します。トレードをシグナルする前に正しい方向へのドンチャンブレイクアウトを待機し、シグナルを非常に信頼性が高く、ほとんど再描画しません。
入力パラメータ
振幅:振幅は、代替価格ポイント間のバーの最小量を表します。大きなパターンを見つけるには、振幅パラメーターを大きくします。小さなパターンを見つけるには、振幅パラメーターを小さくします。 最小リトレースメント:

このインディケーターは ウェッジを 見つけます。 ウェッジ は、価格統合期間を囲む収束トレンドラインによって識別される継続パターンです。フォーメーションブレイクアウトと一緒にドンチャンブレイクアウトを使用してトレードを通知します。 [ インストールガイド | 更新ガイド | トラブルシューティング | よくある質問 | すべての製品 ] 使いやすい カスタマイズ可能な色とサイズ ブレイクアウト信号を実装します あらゆる種類のアラートを実装します
最適な使用法 オーバーラップする可能性があるすべてのサイズのウェッジを表示するには、異なるサイズ(6、12、18、24など)でインジケーターをチャートに数回ロードします。
入力パラメータ サイズ:検出されるパターンのサイズ。代替ポイント間のバーとして表されます ブレイクアウト期間:取引を通知するドンチャン期間
最大履歴バー:チャートで調べる過去のバーの量 強気パターンの色:このパラメーターは一目瞭然です 弱気パターンの色:このパラメーターは一目瞭然です 切れ目のないパターンの色:このパラメーターは一目瞭然です 線幅:パターン線のサイ

トレンドパネルは、ユーザーが選択した10ペアを使用して、時間枠M1〜D1の確認されたトレンド方向を表示するシンプルで便利なツールです。 インディケータは、任意の戦略/テンプレートに方向性の確認を追加するように設計されており、チャートを別のペアまたは時間枠にすばやく変更するためのクリーンなインタラクティブインターフェイスとしても機能します。 グループチャット: https://www.mql5.com/en/users/conorstephenson セットアップのアドバイスと無料のエキスパートアドバイザーについては、購入後に私に連絡してください! 私の製品はMQL5でのみ販売されています 。この製品を他の場所で見た場合、それは模倣品です。だまされてはいけません。 主な機能
チャート上のパネルをきれいにして、時間枠の傾向をすばやく判断できるようにします。 インタラクティブ機能。 チャート上のキャンドルの色を変更します-現在と過去のトレンドを簡単に確認できます。 ペアと時間枠のボタンはクリックすると機能し、現在開いているチャートを変更します。 チャートのパネルをクリックして、テンプレート
FREE

Volume Projection Indicator The Volume Projection Indicator is a specialized tool designed for traders who focus on the relationship between volume and price action. This intuitive indicator projects the expected volume for the ongoing candle, aiding in decision-making during live market conditions. The indicator presents volume data in a histogram format directly on the chart for quick analysis. Features: Bullish Volume Representation : Each green bar in the histogram signifies the volume for a
FREE

素晴らしい信号を見つけましたが、プロバイダーの敷地が小さすぎますか?より大きなポジションボリュームが必要ですが、ターミナルの設定が悪すぎますか? Signal Lot Manager は、必要な量の重複注文によってプロバイダーのポジション量を増やします。 ロットサイズと注文をコピーするシグナルの名前を設定するだけです。 Signal Lot Manager は、端末上で注文を複製するためのロット乗数ユーティリティです。ソースは、任意のアドバイザー、手動取引、個別の取引シグナルを選択できます。簡単なセットアップで幅広い機能を備え、高速性と信頼性も備えています。 Sign Lot Manager インストールおよび入力ガイド EA に関する通知を受け取りたい場合は、URL を MT4/MT5 ターミナルに追加してください (スクリーンショットを参照)。 MT4のバージョン https://www.mql5.com/en/market/product/34864 MT5のバージョン https://www.mql5.com/en/market/product/41610

Higher Timeframe Chart Overlay will display higher timeframe candles, including the number of candles high/low you specify.
You no longer need to switch timeframes to check the candles. Everything can be shown in one chart. Get Full Version - https://www.mql5.com/en/market/product/115682 Please feel free Contact me if you have any questions regarding this tool.
FREE

DONCHIAN CHANNEL DC It is a trend indicator developed by “Richard Donchian”, consisting of 3 layers, the upper channel, the lower channel and the middle channel. It is created on the Donchian Channel by plotting the highest and lowest prices reached in the past period on the price chart. It is also used to measure the volatility of the market, as it is an expanding/contracting channel according to the increase/decrease of price volatility. Method 0; Donchian channel indicator drawing. BUY/SELL S
FREE
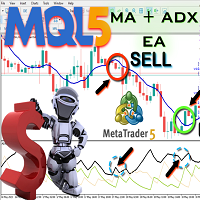
This MA ADX Market analyzer Expert Advisor is an advanced EA that continuously scans the market and finds the best trading opportunities for the trader. It uses a combination of Moving Average (MA) and ADX indicators to generate the trading signals. It is a fully automated EA that sends buy and sell orders to the market so that the trader does not have to be at the computer interface each time and gives his or her time to do his own activities. This is a free EA that you can download Straight A
FREE

Description des paramètres :
Doushoku samourai est un robot trading adapté pour du trading semi-automatisé. Il utilise une moyenne mobile pour déterminer les ordres qu'il doit passer. Si le prix actuel est au-dessus de la moyenne mobile, il achète. Si le prix actuel est en-dessous de la moyenne mobile, il vend. Le calcul du take-profit (ou target) est déterminée en points (0.1 PIP).
Il est le résultat de la différence entre un prix choisi nb bougies dans le passé et le prix de la dernière b
FREE

Volume Weighted Average Price or VWAP is an indicator wich shows different average prices on chart. This is very useful to find strong negotiation price areas and as trend following.
Configurations: Day, Week and Month - Show different VWAPs according to the period. You can change each line style on "colors" tab.
Any doubt or suggestion please contact us. Enjoy! This is a free indicator, but it took hours to develop. If you want to pay me a coffee, I appreciate a lot <3 PayPal, Skrill, Ne
FREE

Overlay indicator on chart between 2 pairs
The Timeframe Overlay indicator displays the price action of timeframes on a single chart, allowing you to quickly assess different timeframes from a single chart. The advantage is to observe and follow the correlations of price movements in real time to help you find potential trades at a glance.
---- Symbol 1 ----
Symbol = EURUSD
Correlation Inverse = false
Display = true
Ratio
FREE

マーチンゲール。 「Constructor_Simple_MT5」エキスパートアドバイザーは、同時に独立して機能する5つの個別のエキスパートアドバイザーで構成されています。 バー取引。 iEnvelopesインジケーターを使用した取引。 iMAインジケーターでの取引。 iIchimokuインジケーターを使用した取引。 iSARインジケーターを使用した取引。 「Constructor_Simple_MT5」エキスパートアドバイザーは、 「Constructor_MT5」 エキスパートアドバイザーの簡易バージョンです。入力パラメーターの数が最小限に抑えられるため、ExpertAdvisorの使用とその最適化の両方が容易になります。 アドバイザの機能: 文字が繰り返される場合があります。 各戦略は最大 4 つの通貨ペアを使用できます。 ブローカーの通貨ペアのシンボル名に接尾辞または接頭辞が含まれている場合 (例: #.EURUSD.ch ) 、それらを入力データに完全に登録する必要があります。 1つの取引口座に、異なる設定で複数の「Constructor_Simple_MT5」をインストー

This indicator is especially for the binary trading. Time frame is 1 minutes and exp time 5 or 3 minutes only. You must be use martingale 3 step. So you must put lots size is 10 % at most. You should use Mt2 trading platform to connect with my indicator to get more signal without human working. This indicator wining rate is over 80% but you may get 100% of profit by using martingale 3 step. You should use MT2 Trading Platform to connect meta trader platform and binary platform . You can get mt2
FREE

I present the well-known Moving Average indicator.
This indicator is presented as a channel, where the upper and lower lines are equidistant from the main line by a percentage set by the user.
The indicator is easy to use. The basic settings of the moving average have been saved and a percentage parameter (Channel%) has been added.
Basic parameters:
Channel% - shows how much we want to deviate from the main line.
The indicator is freely available.
FREE
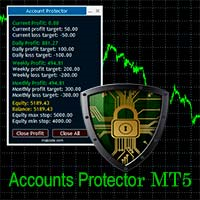
The Expert Advisor is designed to protect the account, fix profit (loss) and display current information about the account. Trading account protection is carried out by closing all open orders in the terminal and/or closing all charts. When running the Expert Advisor with default parameters, it will only display your account information and will be reduced in size. Next, you can set the conditions under which your trading account will be protected. Profit and loss limits can be set for daily pro
TradeSystem 取引する日にバーを選択します。このバーが閉じると、ロボットはろうそくの安値で2つの注文を送信し、もう1つはキャンセルされます StopLoss ストップは、買いの場合は安値より1ティック下、売りの場合は高値より1ティック上になります TakeProfit テイクはstopLossの範囲に必要な量を設定でき、戦略の最適化でコストをかけることができます 最適化 このロボットにはリスクリターンを取得するための入力があるため、メタトレードの戦略最適化で実行して、取引するシンボルの最適な入力を取得できます TradeSystem torihiki suru hi ni bā o sentaku shimasu. Kono bā ga tojiru to, robotto wa rōsoku no yasune de 2tsu no chūmon o sōshin shi, mō 1tsu wa kyanseru sa remasu StopLoss sutoppu wa,-gai no baai wa yasune yori 1 tikku-ka, uri no baai
FREE

A pin bar pattern consists of one price bar, typically a candlestick price bar, which represents a sharp reversal and rejection of price. The pin bar reversal as it is sometimes called, is defined by a long tail, the tail is also referred to as a “shadow” or “wick”. The area between the open and close of the pin bar is called its “real body”, and pin bars generally have small real bodies in comparison to their long tails.
The tail of the pin bar shows the area of price that was rejected, and
FREE

Gold Mahameru FTMO MT5 is a very accurate expert advisor for Gold/XAUUSD.This EA is designed with a secret super signal. This EA is a single entry method use stop loss and take profit (semi martingale after loss).
Please send me inbox after purchase, I will give you Breakout EA for free (promote until 12.12.2024).
This EA has been rigorously tested at several backtest levels, but past results do not guarantee future results. Please do your own research!
Requirements: Currency pair: GOLD/

Baby WPR opera automáticamente en base al algoritmo oscilador WPR. Es capaz de llegar a generar resultados alcistas en las pruebas realizadas con el par de FX GBPUSD en el marco temporal H1 Se puede testear en otros instrumentos ajustando sus diversas opciones. Diseñado para operar con un capital mínimo de 100 USD y un apalancamiento de 1:30 Ideal para los iniciados. Con Baby WPR no esperes grandes beneficios con la configuración conservadora por defecto, por el contrario habrán DD significativo
FREE

The indicator draws daily support and resistance lines on the chart, as well as the Pivot level (reversal level).
Adapted to work in MT5
The standard timeframe for calculating support and resistance levels is D1. You can choose other timeframes according to your strategy (for example, for M1-M15, the optimal timeframe for calculations is H1)
The function for calculating support and resistance levels has been updated; in this calculation option, fibonacci levels are taken into account, res
FREE

Discover the Future of Financial Freedom with Our Revolutionary Trading Robot! Welcome to the Year 2224
The global elite, secretly proclaiming the concept of the "golden billion," continues to implement their insidious plan for financial enslavement of the population. Most inhabitants of planet Earth do not realize they are being manipulated. But there are those who refuse to accept this state of affairs. Rebel Programmers: Heroes of Our Time From different corners of the planet, rebel progra
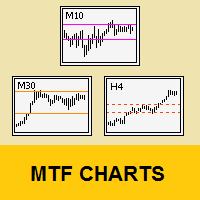
Tool that allows viewing more than one timetime in the same window (up to 3 timeframes). Then, the tool helps the analysis in multiple timesframes.
This is another product developed by Renato Fiche Junior and available to all MetaTrader 5 users!
Input Parameters
- Timeframes 1, 2 and 3: Timeframes of sub-charts
- Show Dates: Shows the dates on the sub-charts on the X-axis (Yes / No)
- Show Prices: Shows on the Y-axis the prices in the sub-charts (Yes / No)
- Show Subwindow: Sh
FREE

ケルトナー・エンハンスドは、ケルトナー・チャネルの精度と見やす さを向上させるもので、METAデフォルトを超える多くの調整オプショ ンと5つの価格計算を備えています。
ケルトナーEインディケータは、ボリンジャーバンドや移動平均エンベロープ に類似したバンド型インディケータです。ケルトナーEは、ボリンジャーバンドや移動平均線に似た帯状のインジケータで す。
ケルトナー・チャネルを使用する際に注意すべき主な現象は、上限エンベロープの上方または下限エンベロープの下方へのブレイクアウトです。上側のエンベロープを上抜けた場合は、買われ過ぎを意味します。下限エンベロープを下抜けた場合は、売られ過ぎを意味する。
ただし、ケルトナー・チャネルを使用する際には、買われすぎや売られすぎの状態はしばしば強さの兆候であることに留意してください。
トレンドが明確に定義されている場合、買われ過ぎや売られ過ぎは強さを示すことがあります。この場合、現在のトレンドは強まり、最終的に継続する。横ばい相場では、少し違った動きをする。相場が横ばいトレンドにある場合、買われすぎや売られすぎの読みは、多くの場合
FREE

CAP Prime Scalper EA is a Forex scalping EA that uses a smart system to detect key breakout signals then cuts the profit of the move as much as possible while minimizing the loss. The robot automatically analyzes the market volumes and volatility and follows strong supply and demand movements. It smoothly sets breakeven levels and features the built-in smart mechanism for partial closure of profitable trades. It also has option to stop trading before important news releases to avoid slippage an

This is my version of the famous VWAP indicator.
Channel Group: Click Here
You get: - Default VWAP Line - First and second deviation zones - Previous day levels Very simple to use, one of the best tools for day trading. Can be used on any TF and on any symbol. Don't use for entries, use as a trend filter. Add supporting indicators
I would recommend to use the indicator on either 15M or 5M chart.
FREE
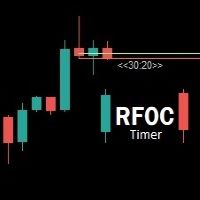
Uma informação de grande valor para o trader se localizar no tempo é a informação de quanto tempo temos para o encerramento do candle atual ou quanto falta para a formação de um novo candle. O RFOC Timer apresenta esta informação de forma clara e alocada à direita do candle atual. Adicionalmente o RFOC Timer acompanha a opção de inclusão das linhas de preços ASK e BID com e sem extensão a direita e/ou esquerda. Esta função auxilia, por exemplo, a não sobreposição das linhas de ASK e BID com as
FREE

Seeing and interpreting a sequence of Candlesticks is easy to spot when you are a human... Higher Highs, Higher Lows, are the panorama of a Buying trend, at least in a short period of time... Seeing a current candlestick higher high and a lower candlestick low, as a human, you can immediately spot a "divergence", an "alert", a "starting range", but in the end and based on other analysis a human trader can understand and behave accordingly to this kind of candlestick data... But what about EAs (r
FREE

The EU_15_111517128_S_Op_CF_SQ3 is an algorithmic trading strategy for MetaTrader, tested on EURUSD using the M15 timeframe from April 1, 2004, to April 24, 2024. There is no need to set up parameters, all settings are already optimized and fine-tuned.
Recommended broker RoboForex because of EET timezone.
You can find the strategy source code for StrategyQuant at the link: http://quantmonitor.net/listing/eurusd-bollinger-bands-breaker/
Key details are:
Main Chart: Current symbol and
FREE

移動平均とRSI EA
移動平均と RSI EA をご紹介します。これは、外国為替市場で最適な取引パフォーマンスを実現するためにテクニカル分析の力を活用するように設計された究極の取引パートナーです。
主な特徴:
デュアル移動平均クロス: EA は 2 つの移動平均を利用して市場トレンドを特定し、買いまたは売りのシグナルを生成します。これらの移動平均のクロスオーバーは、潜在的な市場の方向性の変化を示す強力な指標となります。
RSIの確認: シグナルの精度を高めるために、EA には 30 および 70 の重要なレベルの相対強度指数 (RSI) が組み込まれています。これにより、EA は市場の状況を確認し、買われすぎと売られすぎの状況を特定して、高確率の取引を保証できます。
動的なロットサイズ管理: EA には、さまざまな取引スタイルやリスクの好みに合わせてさまざまなロットサイズ モードが含まれています。動的ロットサイズ モードでは、EA が口座残高に基づいてロットサイズをインテリジェントに計算し、最適なリスク管理を確保し、潜在的な利益を最大化します。
FREE

Candle High Low
Indicator showing High and Low of X candles across a line.
Settings Candle number for calculation (>= 1 ) - Define the number of candles for the indicator to find the maximum and minimum of that period of candles. Continuation of the line's display to the right - If you want the High and Low line to extend to the right edge of the graph Line High Color - Set line color Line High Style - Set line style Line Low Color - Set line color Line Low Style - Set line style
FREE

モメンタムリバーサルは、価格の動きとバーの形成の強さの分析に基づいて、可能な逆転ポイントと修正の開始を検出するための強力なツールです。
_________________________________
インジケータ信号の使用方法:
この指標は、新しい価格バーが表示された後に信号を生成します。 価格が指定された方向の臨界点を突破した後、生成された信号を使用することをお勧めします。 インジケーターは信号を再描画しません。
_________________________________
インジケータパラメータは、信号の矢印の表示スタイルを変更することを示唆しています。 計算に使用されるパラメータを変更することは提供されていません-これは私の製品の哲学によるものです:安定性と客観性。
_________________________________
ご質問やご提案のいずれかが歓迎されており、プライベートメッセージで送信することができます
_________________________________
興味のあるすべての人に事前に感謝し、市場を征
FREE

マルチアセット、マルチストラテジー、マルチランゲージ: Edgeweasel Pro は、主要な通貨ペア、指数、商品を含む最大20の金融商品を同時にスキャンできるマルチアセットツールです。また、Forex、指数、商品のためのカスタマイズされたストラテジーを取り入れたマルチストラテジー機能も備えています。これらのストラテジーは、極端な動きの後の価格修正を利用することを目指しています。グローバルなユーザーベースに対応するため、このアドバイザーは英語、ロシア語、中国語、スペイン語、ブラジルポルトガル語、ドイツ語を含む複数の言語をサポートしています。グリッド戦略やマーチンゲール戦略に頼ることなく、好条件の下でロットサイズを戦略的に増やす損失回復メカニズムを特長としています。広範なテストを通じて、シンプルな1:xのリスクリターン比が一貫して最良の結果をもたらすことを発見しました。 キャリブレーション : 多数のパラメーターを持つ戦略を開発することは、特に歴史的データに合わせて最適化する際に、過剰適合を招く可能性があります。これを緩和するために、私たちはエキスパートアドバイザーのパラメーター数を
FREE

The NQ_H4_820422556_S_BB_CF_SQX is an algorithmic trading strategy for MetaTrader, tested on NQ using the H4 timeframe from December 7, 2017, to June 2, 2023. There is no need to set up parameters, all settings are already optimized and fine-tuned.
Recommended broker RoboForex because of EET timezone.
You can find the strategy source code for StrategyQuant at the link: http://quantmonitor.net/listing/nasdaq-trend-catcher/
Key details are:
MagicNumber: 820422556 Main Chart: Current
FREE

Auto Levels is a technical analysis indicator designed to automatically identify and draw support and resistance levels on price charts. The robot is capable of automatically identifying support and resistance levels based on historical price patterns, eliminating the need for manual analysis. You can set the maximum number of lines that the indicator plots as a parameter
FREE

This EA uses the MACD Crossover Strategy. Entries opened when the signal and MACD line cross each other. The Buy position entered only when the cross is below the zero line while the Sell position entered above the zero line. The Moving Average Convergence/Divergence (MACD) is an oscillator that combines two exponential moving averages (EMA)—the 26-period and the 12-period—to indicate the momentum of a bullish or bearish trend. MACD can be used to signal opportunities to enter and exit positions
FREE

The standard Fractals Bill Williams indicator with the ability to specify the number of candles for formation. The indicator works on all charts and timeframes.
Settings: candles - the number of candles to the left and right on the basis of which the fractal is built (in the classic indicator this value is always 2)
Contact: If you have any questions or need assistance, please contact me via direct message. Author: Fertikov Serhii, More of my indicators, advisors, scripts are available i
FREE

Shows the agression balance (buy agression deals - sell agression deals) in a histogram. The agression is calculated on every tick of a given candle and is the sum of volume of all the market buys minus all of the market sell trades. If the ticker does not have real volume, tick volume is used insted;
Very useful to determine if a given candle is dominated by bulls or bears
It is necessary for the data provider to have a list of trades (times & sales) as well as the agressor (buy/sell) d
FREE

Mostra a média móvel quando ADX > 20 e pinta de verde ou vermelho quando os valores de ADX estão subindo indicando tendência. Quando o ADX é menor que 20 indica movimento lateral consolidado. O indicador não define pontos de entrada, somente mostra a média colorida quando a tendência está se fortalecendo. Faz parte do grupo de indicadores do Indicador Tavim.
FREE

このテキストは英語からの機械翻訳です。 英語版 ニュース エクスプローラーは、価格チャート上の経済カレンダー イベント間を移動できるツールです。 ターミナルでフル機能の経済カレンダー。 カレンダー イベント間のクイック チャート ナビゲーション。カレンダーのウェブサイトを開いたり、日付をコピーして貼り付けたり、チャートをそれらの日付まで手動でスクロールしたりする必要はありません。イベントのある線をマウスで 1 回クリックするだけで、チャート上ですべてを利用できます。 市場の反応は、発表時間中の最大の価格アクションとして計算されます。これは、ほとんどのカレンダーで使用される 3 スコアの重要度分類よりもはるかに正確です。それはまさにニュース取引に関連するものです。 イベントのリストは、計算された市場の反応によってソート可能です。何千ものイベントの中から実際に市場を動かしたものだけがテーブルの一番上に表示されます。 時間、国、通貨、タイトル フィルターにより、必要なイベントのみを探索できます。 プログラムを起動します。チャートを M1 に設定し、価格履歴をチェックして読み込み、カレンダーを

Monte Carlo simulation is an Indicator that uses a Monte Carlo model to calculate the probability of the price going up or down. If the price has a probability of going up or down more than 90%, the system will enter a trade by doing a back test of gold assets. It was found that it was able to generate a return of more than 20% in a period of 5 months while having a MAX DD of less than 7%.
What is a Monte Carlo simulation?
A Monte Carlo simulation is a model used to predict the probability o
FREE
The EA uses 4 strategies, each strategy uses joint work on several currencies at the same time. The EA uses 4 stages of control and order tracking for a step-by-step profit capture. Trading is carried out in a pair for several currencies at the same time, trading is also carried out in a group of several strategies, for example: the advisor opens orders simultaneously for two or more pairs and closes upon reaching a certain profit in% of the current or user balance. The EA does not use Marti

VWAP RSJ is an indicator that plots the Hourly, Daily, Weekly and Monthly VWAP Lines.
Large institutional buyers and mutual funds use the VWAP ratio to help move into or out of stocks with as small of a market impact as possible. Therefore, when possible, institutions will try to buy below the VWAP, or sell above it. This way their actions push the price back toward the average, instead of away from it. Based on this information I developed this indicator that combines 4 types of VWAP T
FREE
Price Ray indicator is a utility that will improve the way you trade. Primarily, it shows the Bid, Ask or Last price as a line ray which beams till the current candle, last visible chart candle or extended to all candle bars. The enhanced features in this indicator provide information in an area where you focus most, right next to the current candle. You can select text to be shown above or below the Price ray. The indicator is fully customizable, allowing it to fit any strategy requirements. Th
FREE

This is advanced Multi-Symbol and Multi-Timeframe version of the "Candle Pattern Finder" indicator (search for candlestick patterns based on the book by Gregory L. Morris "Candlesticks charting explained. Timeless techniques for trading stocks and futures" ). The indicator searches for candlestick patterns for ALL symbols of the "Market Watch" window and for ALL standard timeframes from M1 to MN1. When patterns appear on any symbol / timeframe, the indicator gives a signal (text, sound, sending
To access the MT4 version of this EA you can contact via private message. Also you can contact for further modifications. strategy description: - Detect underlying trend using the BxTrender indicator in daily time frame. - Trigger entry using supertrend indicator in M15 time frame. - Also use supertrend indicator to set SL and TP accordingly. EA setup - Nasdaq and other indices(like DAX40) are suggested to be traded. - Risk per trade is hard coded to 0.5%. - Risk:Reward ratio is hard coded to 1:
FREE

The currency strength momentum has a lot of similarities with currency strength meter presented in the previous page, but the difference are much more pronounced. You can try putting both in the same chart and see the difference in results. Currency strength momentum measures strength of a currency based on (you guess it) it's momentum relative to other currencies, while currency strength meter measures the strength of a currency based on pips it has moved in a certain direction.
FREE

XE Forex Strengh Indicator MT5 displays visual information about direction and strength of a signal for current pair and chosen timeframes (M5, M15, M30 and H1). Calculations are based on multiple factors and results are shown as a colored panel with scale bar, numerical values and arrows. There are also displayed values of current price and spread on the pair. There can be activated an alert (as a mail or pop-up window with sound) for each available timeframes which send a message when the dir
FREE

This indicator builds upon the previously posted Nadaraya-Watson Estimator. Here we have created an envelope indicator based on kernel smoothing with integrated alerts from crosses between the price and envelope extremities. Unlike the Nadaraya-Watson Estimator, this indicator follows a contrarian methodology. Please note that the indicator is subject to repainting. The triangle labels are designed so that the indicator remains useful in real-time applications.
Settings
Window Size: Dete

トレンドインジケーター「 スーパートレンドフレキシブルアラート 」には最低限の設定があります。このインジケーターは、できるだけ使いやすいように設計されています。インジケーターは、主要な色付きの線 (「データ ウィンドウ」ウィンドウで確認できる「スーパートレンド」線) でトレンドを示します。また、トレンドが変化する場所では、インジケーターに色付きの矢印 ( 「STBuy」および「 STSell」アイコンが表示され、「データ ウィンドウ」ウィンドウで確認できます) )。 トレンドが変化する場所では、インジケータはシグナルを発しません: サウンド (またはサウンド ファイルまたはアラート) を再生したり、電子メールにメッセージを 送信したり、プッシュ メッセージを送信したり できます。 携帯端末 信号設定: サウンド名 - *.wav 形式のサウンド ファイル名 (サウンド ファイルはターミナルの「Sounds」フォルダにある必要があります) 繰り返し - 信号の繰り返し数 秒単位の一時停止 - シグナル間の秒数 (1 つのバー内) Use Sound - 「 Sou

グリッド戦略(トレンドの動きに対抗する取引の開始)とピラミッド化(トレンドの取引の開始)を使用するFOREXアドバイザーHERO。 EAは成行注文でのみ機能します。最初の取引の開始は、割り当てられた時間内の極値の内訳で発生します。ここでは、N個の指値注文が集中しています(価格はこのレベルを数回テストしています)。価格がレベルを超えても、NパイントがN秒以内に通過しない場合、シグナルは偽と見なされます。
MT4バージョン-https:// www.mql5.com/en/market/product/52194
便利なマネーマネジメント、各Nバランスの初期ロット、グリッドと注文のピラミッドの乗数があります。グラフには情報が表示され、構成と最適化が簡単です。
作業時間枠はEAパラメータで設定され、デフォルトではH1、EURUSD記号です。次のペアがアドバイザーに適しています:GBPUSD、USDCAD、EURUSD、USDJPY、USDCHF、AUDUSD、NZDUSD .. ..
オプション:
タイムフレーム-作業時間枠; EXTREMUM_BARS、SHIFT-極

I think you all know Donchian Channels. so I am not going to write about it.
With this indicator I tried to create Donchian Trend Ribbon by using Donchian Channels.
How it works ?
- it calculates main trend direction by using the length that is user-defined. so you can change it as you wish
- then it calculates trend direction for each 9 lower lengths. if you set the length = 20 then the lengths are 19, 18,...11
- and it checks if the trend directions that came from lower lengths i
FREE

QuantumAlert CCI Navigator is a free indicator available for MT4/MT5 platforms, its work is to provide "alerts" when the market is inside "overbought and oversold" regions in the form of "buy or sell" signals. This indicator comes with many customization options mentioned in the parameter section below, user can customise these parameters as needful. Join our MQL5 group , where we share important news and updates. You are also welcome to join our private channel as well, contact me for the pri
FREE

The DD_ATR MT5 indicator is a trading tool developed by the Dagangduit Core Team . This indicator is designed to calculate and display the Average True Range (ATR) in real-time, providing traders with essential volatility information to aid in their trading decisions. Key Features: ATR Calculation : Calculates and displays the ATR for the selected timeframe. Multiple Timeframes : Displays ATR values for multiple timeframes (M1, M2, M3), giving traders a comprehensive view of market volatility.
FREE

This panel displays the price percentage change
Shows the percentage change in price from the last open: Daily, Weekly and Monthly timeframes. Numbers are easier to use than histogram currency meters. Line up the three timeframes strengths/weaknesses for strong trends. Compare currencies strongest against weakest. USD is the world's reserve currency to compare against.
How to use 1. Match the strongest currency with weakest currency; or 2. Match the strongest or weakest currency against US
FREE

This indicator is very useful in observing the direction of the market. It allows users to enter multiple MA lines with specific display method. In addition, it is also possible to change the candle color same to color of the background of chart, so that we only focus on the MA lines. When a signal appears, represented by a red or green dot, we can consider opening a sell (red dot) or buy (green dot) order. Note: it need to set stoploss at the highest value of MA lines (with sell order) or lowe
FREE

チャート上に超簡単に線を引いたり、移動したりできるツールです。
クリックしてから、ドラッグするとトレンドラインが引けます。 横に引くと価格線、縦に引くと日付線になります。 そこにある線やオブジェクトで、クリック&ドラッグすると移動できます。
クリックしたところから、ドラッグしたところに交差線が引かれ、間の時間と価格の差が表示されます。
クリック&ドラッグしたら、左右に振ると色が変わります。 クリック&ドラッグしたら、上下に振ると削除します。
クリック&ドラッグとは? 1.マウスの左ボタンを押す(カ) 2.マウスの左ボタンを放す(チ) 3.マウスの左ボタンを押す(カ) 4.左ボタンを押したまま、マウスを移動する(ツー)
この動きをすることでトレンドラインを引いたり、オブジェクトを移動したり、色を変えたり、消したりできます。
トレンドライン、価格ライン、日付ラインだけでなく、矢印や価格表示、フィボナッチ、ギャンライン、サイクルライン、図形なども移動させることができます。
他にも便利なところ
・うっかり線を引いてしまったら、チャート外でマウスボタンを離せ
FREE

Swiss VWAPsimple Motivation Did not find free VWAP that works, the one that I found craseh. So I created a VWAP which calculates values only for the actual day. So computer resouces are not over stressed.
What is VWAP, how is it used? VWAP stands for Volume Weighed Average Price, it calculates the running sum of tick volume and the runnung sum of price times tickvolume. The division of these sums result in a weighed price (Sum P*V/Sum V). The calculation starts normally at midnight. The value
FREE

Индикатор PivotPointSuperTrend отлично показывает данные Тренд на основе мат данных от Pivot и ATR и очень удобен для входа в сделку и выставления стопов. Если кто то сможет добавить в код мултитаймфрем, я и многие пользователи будут очень Благодарны, то есть чтобы ондикатор показывал значение старшего таймафрема на графике младшего таймфрема, Заранее Спасибо!
FREE

Make grid trading safe again | Built by a grid trader >> for grid traders. Walkthrough Video <== Get Grid Rescue up and running in 5 minutes This is MT5 version, click here for BlueSwift GridRescue MT4 (settings and logics are same in both versions) BlueSwift Grid Rescue MT5 is a risk management utility MT5 EA (used together with other grid trading experts) that can help you trade aggressive grid / averaging / martingale systems with manageable drawdown, therefore

This is an extension indicator that allows the user to select any second time-frame from 1 to 60 second without any multiplier limitaion (ex, 7 seconds, 13 seconds ... are all allowed).
There is only one input called Interval that allows you to set the seconds timeframe you want given is in the range above. You can use indicators on that new time frame with no problems and also build your EAs based on any second timeframe. I hope this is useful, please let me know any bugs you find!
Note: Sin
FREE

AliPivot Points is a Meta Trader 5 Indicator that draws you the latest pivot points. You can choose from timeframes ranging from 1 Minute to 1 Month. Calculation methods for pivot points includes: Classic Pivot Points Camarilla Pivot Points Fibonacci Pivot Points Woodie Pivot Points You can personalize the line colors, style, and width to suit your preference. The indicator displays values on the right side of the chart. AliPivot Points values can also be utilized by developers for creating Expe
FREE

The Expert Advisor for this Indicator can be found here: https://www.mql5.com/en/market/product/115564 The Contraction/Expansion Breakout Indicator for MetaTrader 5 (MT5) is a powerful tool designed to identify and signal the breakout of bullish and bearish contraction or expansion formations in financial markets. Utilizing advanced algorithmic calculations, this indicator helps traders spot significant price movements that often accompany these formations, providing valuable insights for stra
FREE
Trading strategy: Scalping. The "Perfect Breakout" EA is based on a complex breakdown tactics based on Patterns. The essence of the Adviser's strategy boils down to the fact that the expert determines two or more multidirectional fractals (marks the local minimum and maximum) and places two or more pending buy stop and sell stop orders at a given distance from them. In the event of a breakdown of one of the pending orders, the expert accompanies the position: trailing stop, breakeven and smart c

Provlepsisインジケーターへようこそ。
「Provlepsis」は、MQLマーケット向けに設計された高度なインジケーターです。 同じ時間帯の過去のローソク足を分析することで、市場の動きの潜在的な範囲を正確に計算し、将来の価格変動に関する貴重な洞察を提供します。 従来のATRインジケーターとは異なり、「Provlepsis」は時間の要素を考慮に入れており、異なる市場状況に適応するより強力なツールとなっています。 夜間には狭い範囲を予測し、活発な取引時間帯ではより広い範囲を予測します。 「Provlepsis」による包括的な範囲分析で、トレード戦略に競争力を持ちましょう。 Provlepsis インジケーターの長さとシフトを変更できるフルバージョンはこちらでご確認いただけます!
https://www.mql5.com/ja/market/product/98802
なぜProvlepsisを使用するのか
レンジベースのトレード:市場の動きの潜在的な範囲を特定する能力は、レンジベースのトレード戦略にとって価値があります。トレーダーは、指標を使用して予測される範囲内の主
FREE
MetaTraderマーケットが取引戦略とテクニカル指標を販売するための最適な場所である理由をご存じですか?宣伝もソフトウェア保護も必要なく、支払いのトラブルもないことです。これらはすべて、MetaTraderマーケットで提供されます。
取引の機会を逃しています。
- 無料取引アプリ
- 8千を超えるシグナルをコピー
- 金融ニュースで金融マーケットを探索
新規登録
ログイン