YouTubeにあるマーケットチュートリアルビデオをご覧ください
ロボットや指標を購入する
仮想ホスティングで
EAを実行
EAを実行
ロボットや指標を購入前にテストする
マーケットで収入を得る
販売のためにプロダクトをプレゼンテーションする方法
MetaTrader 5のためのエキスパートアドバイザーとインディケータ - 22
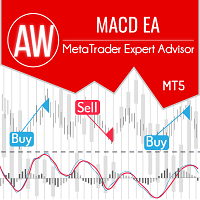
完全に自動化された取引システム。クラシックインジケーターはシグナルとして使用されます MACD 。トレンドインジケーターとオシレーターを組み合わせてエントリーポイントを検出します。これは、平均化、バスケットの最初と最後の注文を閉じる機能、および自動ロット計算の機能を使用します。高度な情報パネルと3種類の通知があります。 Problem solving -> HERE / MT4 version -> HERE / Instruction -> HERE 利点:
完全に自動化された取引システム 簡単なセットアップと直感的なパネルインターフェース キャンドルごとに1つの注文のみを開く機能 内蔵の自動ロット計算 バスケットの最初と最後の注文を閉じるための組み込みシステム 通知の3つのタイプ:プッシュ、電子メール、アラート ストラテジー:
インジケーターからシグナルを受信すると、EAはポジションをオープンします。 -ゼロレベル:下から上にマーク「0」の速いラインを横切るとき-購入するシグナル、購入注文を開きます。マーク「0」を上から下に横切ると、売りの合

This is a simple utility which will put Automatic Stop Loss and Take Profit on all your open trades. The input value of the Stop Loss and Take Profit is in Pips. Whenever you open a trade it will put stop loss and take profit in pips automatically. Inputs: 1. SL and Trailing SL - This is the Stop Loss value in Pips. Also used as Trailing Stop Loss if, "Use Trailing = true". 2. Trailing Steps - This is the steps value in pips for trailing the stop loss. 3. Take Profit pips - Take profit value in

MT5用バイナンス取引ツール
1. この製品には、WebSocket からのライブ チャート、履歴チャート、
mt5ターミナルの再起動時に自動更新され、手動介入なしでスムーズに動作し、バイナンスをスムーズに取引できるようになります。
スポットと先物で利用可能な取引、ライブチャート、履歴データ
使い方 :
1. このユーティリティの入力フィールドに API キーとシークレットを追加する必要があります。 API を作成するときは、必ず先物取引を有効にしてください。
3. [ツール] > [オプション] > [URL からの Web リクエストを許可] タブで説明されているように Binance API URL を追加し、Web リクエストを許可するチェックボックスにチェックを入れる必要があります。
バイナンススポット
URL 1: api.binance.com
URL 2: stream.binance.com
バイナンス先物
URL 1: fapi.binance.com
URL 2: fstream.binance.com
これら

This indicator is the converted Metatrader 5 version of the TradingView indicator "ATR Based Trendlines - JD" by Duyck. This indicator works by automatically and continuously drawing trendlines not based exclusively on price, but also based on the volatility perceived by the ATR. So, the angle of the trendlines is determined by (a percentage of) the ATR. The angle of the trendlines follows the change in price, dictated by the ATR at the moment where the pivot point is detected. The ATR percentag
FREE

Rua Close All Orders An EA used to preserve profits. EA will close all orders when reaching profit expectations or loss limits in USD or a percentage of the balance. Custom parameters BackTest EA + True: there is a command when running in Backtest mode. + False: Not entered, used for real time Closebyprofit: + true: use payment in USD + false: do not use closed in USD profit win: stop rate (USD) profit loss: stop loss (USD) Closebypercent: + true: use close to percent of bal
FREE

Introduction to Fractal Moving Average Fractal Moving Average indicator was designed as part of Fractal Pattern Scanner. Inside Fractal Pattern Scanner, Fractal Moving Average Indicator was implemented as multiple of chart objects. With over thousands of chart object, we find that it was not the best and efficient ways to operate the indicator. It was computationally too heavy for the indicator. Hence, we decide to implement the indicator version of Fractal Moving Average indicator to benefit ou
FREE

この指標は、こちらからダウンロードできるMy candleの完全版のデモ版です: Candle Patterns Creator 完全版では、独自のローソク足ルールを作成したり、従来のローソク足パターンを戦略に合わせてより正確に修正することができます。 この指標にはいくつかのローソク足ルールの例が含まれていますが、ここではいくつかをご紹介します: Pattern Rule Candle Green C > O Candle Red C < O Doji C = O Hammer (C > O and (C-O) *2 < O-L and (C-O) *0.5 > H-C) or (C < O and (O-C) *2 < C-L and (O-C) *0.5 > H-O) Hammer Green C > O and (C-O) *2 < O-L and (C-O) *0.5 > H-C Hammer Red C < O and (O-C) *2 < C-L and (O-C) *0.5 > H-O Marubozu (C > O and C-O > (H-L) * 0.7 ) or
FREE

Airiamu ni aimashou. Kanojo wa māchingēru ya guriddo shisutemu o shiyō shite imasen. Tesuto wa EURUSD H 1 de okonawa remashitaga, hoka no tsūka pea mo kinō suru kanōsei ga arimasu. Watashi wa kono botto o sakusei suru tame ni nemurenu tsuki o nan-kagetsu mo tsuiyashimashitaga, tekisetsuna tesuto o hete hajimete, kyōyū suru junbi ga dekita to kanjimashita. Okonawa reta tesuto no sukurīnshotto ga fukuma rete imasu. Deforuto settei wa watashi ga shiyō shita monodesu. Gaikoku kawase torihiki ni wa t
FREE

Thermo MAP is a multicurrency and multitimeframe indicator that display a smart heat map based on proprietary calculations. Watch how Forex market moved and is currently moving with a single dashboard and have a consistent and good idea of what is happening!
It can be suitable for both scalping or medium/long term, just select options that better fit your trading style Symbols list are automatically sorted based on the preferred column. There is the possibility to click on: First row, timefram
FREE

This indicator calculates the volume profile and places labels that correspond to the VAH, VAL and POC levels, for each candle individually.
Indicator operation features The indicator works on the timeframes from M3 to MN, but it uses the history data of smaller periods: M1 - for periods from M3 to H1, M5 - for periods from H2 to H12, M30 - for the D1 period, H4 - for the W1 period, D1 - for the MN period. The color and location of the VAL, VAH and POC labels on the current candle are consider
FREE

Combining the best of Price Action , Directional Movement , and Divergence/Convergence analysis, Candle Color Trend is a easy and reliable way to identify trend direction. The indicator automatically paints the candles according to the assumption that an uptrend is defined by prices that form a series of higher highs and higher lows. In contrast, a downtrend is defined by prices that form a series of lower highs and lower lows. Additionally, ADX Wilder indicator is used to measure trend weakness
FREE

Probability emerges to record higher prices when MACD breaks out oscillator historical resistance level. It's strongly encouraged to confirm price breakout with oscillator breakout since they have comparable effects to price breaking support and resistance levels; surely, short trades will have the same perception. As advantage, many times oscillator breakout precedes price breakout as early alert to upcoming event as illustrated by 2nd & 3rd screenshot. Furthermore, divergence is confirmed
FREE

Limited-Time Offer: Only $49!
Get Insight Pro now for just $49 (was $99)! Hurry, this special price is valid until 30th August . After that, the price returns to $99 . Don't miss out—boost your market analysis today! Insight Pro is a comprehensive tool for market analysis. It offers various features such as trend analysis, resistance and support levels, and distribution analysis, suitable for both novice and experienced traders. Features Trend Analysis Detects and visualizes marke

Santa Bollinger Indicator is an efficient way to detect price retracement in any market. A common approach is to identify overbought or oversold market conditions. When the price of the asset breaks below the lower band of the Bollinger Bands, prices have perhaps fallen too much and are due to bounce. On the other hand, when price breaks above the upper band, the market is perhaps overbought and due for a pullback . Advantages Generates instant buy and sell signals. Never repaints, never back
FREE

This indicator show Gann Swing Chart (One Bar) with multi layer wave. 1. Wave layer F1: Gann waves are drawn based on candles. SGann wave(Swing of Gann) is drawn based on Gann wave of wave layer F1. 2. Wave layer F2: Is a Gann wave drawn based on the SGann wave of wave layer F1. SGann waves are drawn based on Gann waves of wave layer F2. 3. Wave layer F3: Is a Gann wave drawn based on the SGann wave of wave layer F2. SGann waves are drawn based on Gann waves of wave layer F3. ---------Vi
FREE

親愛なる友人、ご清聴ありがとうございました。 異なる通貨ペアの動きが相互に関連していることを観察したい場合は、インジケーター Visual Correlation に注目してください。 異なる通貨ペアの動きは相互に関連しています。 Visual Correlation インジケーターを使用すると、スケールを維持しながら 1 つのチャート上にさまざまな金融商品を表示できます。 正の相関、負の相関、または相関なしを定義できます。
親愛なる友人、あなたは、いくつかの楽器が他の楽器よりも先に動くことをご存知でしょう。 このような瞬間は、グラフを重ね合わせることで判断できます。
親愛なる友人へ、チャート上に商品を表示するには、Symbol フィールドに商品名を入力する必要があります。
Version for MT4 https://www.mql5.com/ja/market/product/33063
FREE

Identification of support and resistance areas
A useful indicator for traders
completely free
Can be used in all symbols
Can be used in all time frames
It has three different trends: short term, medium term, long term
Settings:
Clr1,2: You can change the color of the lines
Type Trend: You can determine the trend
Message me for questions, criticism and suggestions
FREE

Prop Challenger EA is based on candlestick formation and trading time. Prop Challenger EA's strategy is to recognize the candlestick formation and position yourself approximately 3 minutes after the New York Stock Exchange opens. The positions that are in plus are accompanied by additional purchases and tight traillingstop! EA was tested in the XAUUSD M5, H1 strategy tester and adapted to this symbol. Experience trading at the highest level. With very small draw-down and the certainty of large l
FREE

Money Printer EA is an Expert Advisor designed specifically for trading Gold and Forex.
It good to combo with Buy Sell Signals to follow Trend and Sellect Buy Only/Sell Only for EA work Semi-Automatic. Recommend ECN broker with LOW SPREAD: IC Market , Exness, NordFX , FXPRIMUS , Alpari , FXTM
First, before attach EA to chart, you need add http://calendar.fxstreet.com/ in the list of allowed url in the tab ' Expert Advisors '
Tool —> Option —> Expert Advisors —> Allow We

The indicator synchronizes eight types of markings on several charts of one trading instrument.
This indicator is convenient to use in conjunction with "Multichart Dashboard" or other similar assistant that allows you to work with several charts at the same time.
"Multichart Dashboard" can be found under the link on my youtube channel.
Settings:
enable vertical line synchronization
enable horizontal line synchronization
enable Trend Line synchronization
enabling Fibonacci Retracement
FREE

The name Aroon means “ Dawn's Early Light ” in Sanskrit. His creator Tushar Chande chose this name because the indicator is designed to catch the beginning of a new trend. At first sight it seems a little confusing all those jagged lines but after you understand the basics of it, you will find this indicator pretty cool and use it in a variety of ways, i.e.: Trigger, Trend Filtering System, and so on. The Aroon indicator was created in 1995 so it is a "modern" indicator compared to the Jurassic
FREE

*** 50% DISCOUNT, LAST CHANCE TO BUY THE EA AT $75 ***
Milky Way is a completely automated trading robot. All trades are protected by stop loss. the EA uses one same stop-loss for all the trades in one circle so the risk is limited with a safe lot size. Users can use a fixed lot or auto lot money management.
Some features : The EA has strategies for trading 10 currency pairs (AUDUSD,NZDUSD,NZDCAD,AUDCAD,USDCAD,EURCAD,AUDCHF,AUDNZD,GBPUSD,EURUSD) The EA Contains a special drawdown contro

Free version of the TickScalper indicator. The Tick Scalp indicator is a trading assistant for a scalping trader. Works in a separate window. Tracks the momentary activity of the market, shows the graph of the movement of ticks and the strength of bulls or bears. Sometimes it can anticipate the beginning of a strong movement before any other indicators. Helps the trader to make a decision to open the desired order. Designed to work on any instrument. Used timeframes from M1 to M15. Has simple a
FREE

Necessary for traders: tools and indicators Waves automatically calculate indicators, channel trend trading Perfect trend-wave automatic calculation channel calculation , MT4 Perfect trend-wave automatic calculation channel calculation , MT5 Local Trading copying Easy And Fast Copy , MT4 Easy And Fast Copy , MT5 Local Trading copying For DEMO Easy And Fast Copy , MT4 DEMO Easy And Fast Copy , MT5 DEMO "Cooperative QQ:556024" "Cooperation wechat:556024" "Cooperative email:556024@qq.com" Strong
FREE

Recommendations: For limited time only will be removed next month 1/9/2024
Currency pair: EURUSD (Works with other symbols) Timeframe: M5 Minimum deposit : $1000 for default set
Account type: ECN, Raw or Razor with very low spreads. Brokers : IC Markets, Pepperstone with Raw and Razor accounts for lowest spreads IMPORTANT: It is very important to use LOW SPREAD accounts for best results ! Account type: Hedge use OHLC 1min for faster backtest could work in different charts in same time (just
FREE

Indicator that uses ATR and standard deviation to calculate the current trend. It has the top and bottom line. The top line is shown when it is high, and the bottom line when it is low. The indicator does not draw a trend line or show the trend for the day, or for a certain period. It has the function of indicating the current trend, and may indicate a reversal.
use it with caution and at your own risk.
FREE

The provided code is an example of an Expert Advisor (EA) written in MQL5, a programming language used for creating algorithmic trading systems in MetaTrader 5. Here is a breakdown of the code:
The code begins with various input parameters and settings defined using the input keyword. These parameters allow customization of the EA's behavior, such as entry lots, stop loss, take profit, and indicator parameters.
Several constant values and variables are declared, including session time setti
FREE

Introduction To Time Box Indicator Time Box Indicator is a must have indicator for any trader. It will display daily, weekly and Monthly box according to your preferences. Yet, you can extend any important price levels in your chart automatically. You can use them as the significant support and resistance levels. It is very simple but effective tool for your trading.
Graphic Setting Use White Chart Line Style for Current Open price
Daily Setting Update Timeframe for daily box Number of days
FREE

A classic buy low & sell high strategy. This Bot is specifically Designed to take advantage of the price movements of US30/Dow Jones on the 1 Hour Chart, as these Indices move based on supply and demand. The interaction between supply and demand in the US30 determines the price of the index. When demand for US30 is high, the price of the US30 will increase. Conversely, when the supply of shares is high and demand is low, the price of t US30 will decrease. Supply and demand analysis is used to i
FREE

RSIBand Pro EA is a hybrid strategy that has been tested and optimized using 100% History Quality from 2012 to 2023. Its main signal is based on Bollinger Bands, with RSI as a confirming signal to identify trends.
Supported currency pairs: AUDCAD Recommended timeframe: M15
MT4 Version: Click Here
Backtest Modelling quality: 100% History Quality Spread: Variable Time Period: 2012 – 2023.10 Symbol: AUDCAD Timeframe: M15 Dynamic lot: Dynamically sets the lot size based on the current b
FREE

REMEMBER THAT TO OBTAIN POSITIVE RESULTS YOU MUST USE A RAW ACCOUNT WITH LOW SPREADS, TRADE ON SYMBOLS WITH LOWER SPREADS BETWEEN BID/ASK PRICE, ALWAYS FOLLOW THESE 3 FUNDAMENTAL RULES IN YOUR SET:
- TP AND DISTANCE MUST HAVE THE SAME VALUE
- SL MUST ALWAYS HAVE A DOUBLE VALUE OF TP AND DISTANCE
- LOT MULTIPLIER MUST HAVE A VALUE GREATER THAN 2 ( BETTER 3 ) EURUSD M15 Set -> lotsize 0.01 | SL 50 | TP & Distance 25 | Coefficient 2.5 | Max Orders 20 | Money SL (according to your balance) -

Magic Trend
This MT5 indicator is a Moving Average with 3 signal colors. The 3 input parameters on this Indicator give you a chance to set any Moving Average of choice. A combination of 2 different exponential moving averages, relative strength index, commodity channel index, and William's percent range provide the signals.
White color = Null/No/Exit Signal Green color = Buy Signal Red color = Sell Signal
Point To Note: Confirm the color change only after the current candle closes to avo
FREE

XAUUSD H1 Broker- VANTAGE RAW/EXNESS ZERO ACCOUNT MINIMUM DEPOSIT 200$ XAUUSD H1 According to the margin adjust the risk setting trade with EA goldsmith. And get your dream i have used for 3 to 5 months it works better and in live market working 100% dont judge while while checking with backset, only for xauusd i have set files, if your willing to trad
FREE

Smart Grid MT5 automatically recognizes any symbol, period and scale of the chart and marks it up accordingly. It is possible to mark up the chart by trading sessions. The grid consists of the two main line types.
Vertical lines There are two visualization methods: Standard - the lines are divided into three types, separating: Small time period. Medium time period. Large time period. Trading Session - the lines are divided into groups (a total of ten). Each group has two lines: the first is re
FREE

The ICT Unicorn Model indicator highlights the presence of "unicorn" patterns on the user's chart which is derived from the lectures of "The Inner Circle Trader" (ICT) .
Detected patterns are followed by targets with a distance controlled by the user.
USAGE (image 2) At its core, the ICT Unicorn Model relies on two popular concepts, Fair Value Gaps and Breaker Blocks. This combination highlights a future area of support/resistance.
A Bullish Unicorn Pattern consists ou
Expert Advisor (EA) that utilizes the basic Dow Theory strategy along with RSI for take profit, and employs support and resistance levels from the Zigzag indicator as stop-loss and take-profit points, you can follow these guidelines: Dow Theory Strategy : This involves analyzing trends using the Dow Theory principles, mainly focusing on identifying primary trends (bullish or bearish) and secondary trends (corrections). You'll need to implement rules for identifying these trends based on price ac
FREE

One of the best tools for analyzing volume,
Weis Wave was idelized by David Weis, to facilitate the reading of directional flow. For the VSA method disciples it is an evolution of the practices created by Richard Wycoff, facilitating a predictive reading of the market, always seeking an accumulation and distribution of the negotiated contracts.
Cumulative wave volume Range of wave ( removed) Average Wave volume Ref "Tim Ord lectures" ( removed)
FREE

The balance of supply and demand is a simple and effective market analysis method. The supply and demand diagram can show you in advance, even before the trend reversal, where the supply ends and the demand is already emerging, where the demand ends and the supply is emerging, while substantially increasing the probability of making a deal in the right direction and with a high profit factor.
Indicator signals The indicator uses the price/volume values to generate signals: ED – excess demand.

This indicator is a simple tool to spot a possible trend.
When the ribbon below the price bars, It will turn to Green color and the trend is seen to be bullish When the ribbon above the price bars, it will turn to Red color and the trend is seen to be bearish. It can be used a either Entry Signal Exit Signal or trailing stop, so it is very versatile. By default color : Green is UP trend and Red is Down trend and this work perfect with Bar4Colors.ex5
FREE

Japanese candlestick analysis has been in existence for hundreds of years and is a valid form of technical analysis. Candlestick charting has its roots in the militaristic culture that was prevalent in Japan in the 1700s. One sees many terms throughout the Japanese literature on this topic that reference military analogies, such as the Three White Soldiers pattern Unlike more conventional charting methods, candlestick charting gives a deeper look into the mind-set of investors, helping to establ
FREE

This is an indicator that shows total pips ,order counts and the total profit accumulated for the open orders of the pair attached. The colors change depending on if the total profit is positive , negative or zero. Contact:
If you have some questions or if you need help, kindly contact me via Private Message. Author: A.L.I, fintech software engineer and a passionate forex trader.
FREE

The "Standardize" indicator is a technical analysis tool designed to standardize and smooth price or volume data to highlight significant patterns and reduce market noise, making it easier to interpret and analyze.
Description & Functionality: Standardization : The indicator standardizes price or volume values by subtracting the mean and dividing by the standard deviation. This converts the data into a distribution with zero mean and standard deviation of one, allowing different data sets
FREE

Trading Session Indicator The Trading Session Indicator visualizes the high and low points as well as the start and end times of the Asian, London, and New York trading sessions directly on your chart. Features: Visualization of major trading sessions Highlighting of high and low points Display of start and end times for each session Customizable session times User-friendly and efficient Customizability: Each trading session (Asian, London, New York) can be individually customized to match speci
FREE
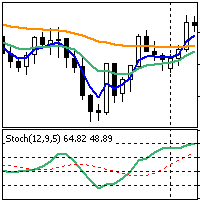
This is a simple trend strategy for Forex. Recommended timeframe is H1, the default settings are for the GBPUSD currency pairs (for other timeframes and currency pairs, it is necessary to select other indicator settings). The following indicators are used in the strategy: Exponential Moving Average: EMA (4) — blue Exponential Moving Average: EMA (13) — green Exponential Moving Average: EMA (50) — orange. Stochastic Oscillator (12,9,5), levels — 20, 40, 60, 80. A buy trade is opened at the openin
FREE

PreCogniTrade : Un Indicador Técnico Avanzado para Predecir el Mercado (Fase Beta) El PreCogniTrade es un indicador técnico revolucionario diseñado para los traders que buscan una ventaja competitiva en los mercados financieros. Este indicador no solo analiza las tendencias actuales, sino que también predice los movimientos futuros de los precios con una precisión asombrosa, lo que lo convierte en una herramienta de incalculable valor para cualquier estrategia de trading. Características Pr
FREE

少し速度のために変更されました。 テスターは、電子メールで私に書いて、興味を持っている新しい顧問のために必要とされます777basil@mail.ru
インジケータは履歴の価格変化に基づいて計算され、数学的に計算され、データが再び受信されるたびに再計算されます。 それは異なる時間枠で使用することができます。 70%のインジケータの境界から、価格の動きや統合の方向に変化があります。 このようにして、トレンドとチャネルの中央の両方を国境から取引することができます。 抵抗/サポートレベルを決定するためにトレンド取引でそれを使用する方が良いです。 ビデオでは、インジケータの動作を確認できます: https://youtu.be/UG2ZZEH9B_U 通信のための連絡先 777basil@mail.ru 私たちは、専門家、あなたのタスクのための指標を準備します。
インジケータは履歴の価格変化に基づいて計算され、数学的に計算され、データが再び受信されるたびに再計算されます。 それは異なる時間枠で使用することができます。 70%のインジケータの境界から、価格の動きや統合の方向に変化が
FREE

Session Killzone Indicator
Indicator that helps you to identify the killzone times of both London and NewYork sessions which usually is the most times for high volatility and taking liquidity from the market. Killzone times are configurable through indicator parameters. The indicator adjusts the range of the killzones based on the daily trading range.
FREE

RENKO Reversal by StockGamblers Actually working RENKO in MT5. Uses "custom symbols" for drawing. You can apply any indicators with complete peace of mind. The movement of the last price is displayed in real during the formation of the "brick". Put the script in the MQL5/Experts folder. More precisely: C:\Users\user\AppData\Roaming\MetaQuotes\Terminal\terminal_number\MQL5\Experts Settings: ValuePerBar - height of the "brick" in points revCandle - multiplier for the height of the turning "brick".
FREE

Highly configurable Moving average indicator.
Features: Highly customizable alert functions (at levels, crosses, direction changes via email, push, sound, popup) Multi timeframe ability Color customization (at levels, crosses, direction changes) Linear interpolation option Works on strategy tester in multi timeframe mode (at weekend without ticks also) Parameters:
MA Timeframe: You can set the lower/higher timeframes for Ma. MA Bar Shift: Y ou can set the offset of the line drawing. MA Perio
FREE
A neural network Expert Advisor based on two moving averages with the training mode. Train the Expert Advisor on selected examples and make a profit in real life. The EA can work on any instrument and in any timeframe.
Trading Algorithm of the EA Two moving averages are analyzed by the neural network core, which produces commands to buy or sell. the values of two moving averages, fast (FMA) and slow (SMA), are provided to the first layer, at the second layer it calculates two neurons responsib
FREE

The Key level wedge MT5 indicator automatically draws rising wedge pattern and falling wedge pattern for you on the chart. This pattern is really good when used as a confirmation entry at key support & resistance, supply & demand and reversal zones.
Advantages
The Key level wedge MT5 block DOES NOT RE-PAINT, giving you confidence when a signal appears and also helps when looking back. The Key level wedge MT5 includes an on/off button on the chart to easily keep the charts cle
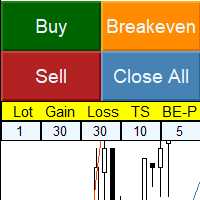
Simple panel with Stop loss (Loss), Stop gain (Gain) , Trailing stop (TS) and Breakeven (BE-P).
Lot is the number of contracts to be traded.
Gain is the number, in points, that the stop gain will be positioned. If you don't want to put stop gain, just put 0 (zero) in place and when you open the order it won't have this stop.
Loss is the number, in points, that the stop loss will be placed. If you don't want to put stop loss, just put 0 (zero) in place and when you open the order it won't
FREE

This indicator shows current major support and resistance, if one exists. And as a support or resistance is broken it shows the new current, if any. To identify support and resistance points it uses the high and low points identified on the current chart. Allows too you to inform the maximum number of bars used to consider a support or resistance point still valid.
FREE

Schaff Trend Cycle (STC) "CON ALERTAS"
El Indicador Schaff Trend Cycle (STC) es una herramienta técnica utilizada en el trading e inversión para identificar tendencias y generar señales de compra o venta. ¿Qué es el Schaff Trend Cycle? El STC fue desarrollado por Doug Schaff para mejorar las medias móviles incorporando análisis de ciclos. Su objetivo es identificar tendencias y cambios de tendencia midiendo la fuerza y velocidad de los cambios de precio. Es un oscilador que mide la velocida
FREE

This tool is useful for indicating resistance and support levels It bases on zone in setting to identify top/bottom of candles and and draw rectangle according to those resistance/support level Beside user can edit the zone via dialog on specific timeframe and that value will be saved and loaded automatically. User can determine what strong resistance and support and make the order reasonably.
FREE

Introduction
The RSI Plus is an innovative technical analysis tool designed to measure the strength and direction of the market trend. Unlike the traditional RSI indicator, the RSI Plus boasts a distinctive ability to adapt and respond to market volatility, while still minimizing the effects of minor, short-term market fluctuations.
Signal
Buy when the RSI plus has been in the oversold (red) zone some time and it crosses above the 20 level on previous candle close
Sell when the RSI
FREE

Ever wanted to use MACD like you see in TradingView??? Now you can use this indicator to use same MACD in your MetaTrader5 and enjoy more time in Trading.. You can change MACD settings if you want to change and it will be ready to use for you... Now you will not spend time in TradingView to use only indicator there... Open charts , load Indicator and you are ready to do analysis in MetaTrader5 and Put Trades when you feel okay with your analysis.
FREE
UPD: https://t.me/mql5_neuroExt актуальная версия и обсуждение. -作成されたトレーニングベースを成功させるために、一時的に使用するためのアドバイザーを無料で提供します。 -トレーニングの進行に伴い、トレーニングベースが配置されます。 -トレーニングには約20エポックが必要です。 なぜならExpert Advisorはリソースを大量に消費し、市場はそれを処理できません。Market値を持つTypeOfWorkパラメーターが導入されました。 他の希望する値に切り替える必要があります! 共同学習のために公開されました! 入力データのセットの深さは、設定で指定された時間枠の50バーです。 ThresholdOUTは効果がありません。 場合によっては、速度は非常に大きな値にのみ影響します。 トレーニングモードでは、SLとTPが等しい最小ロットで1つの注文のみを開きます。スケジュールは統一されている必要があります。このモードでは、利益自体は重要ではありません。 距離は、MaxOrders> 1でのみ機能します。 MaxOrde
FREE

This is a smooth and responsive accelerometer which reveals the market trend and strength. [ Installation Guide | Update Guide | Troubleshooting | FAQ | All Products ]
Two moving averages indicate trend direction The histogram represents strength of the price movement It draws buy and sell zones as colored vertical lines Should be used as a confirmation indicator Customizable line widths and colors It implements alerts of all kinds This indicator is similar to MACD but aims to react faster t
FREE

The Indicator show Daily Pivot Points. It is possible to specify the number of days to display. For forex it doesn't consider the sunday session data. It is possibile to modify the color, style and width for every level. It is better to use this indicator with timeframe not higher than Н1. 4 Levels of support and resistance with also Intermediate Levels that is possible to hide.
FREE
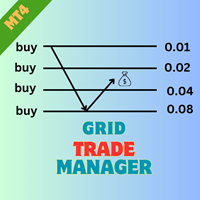
Product Name: Grid Trade Manager MT5 Description: The Grid Trade Manager EA for MetaTrader 5 is meticulously crafted to oversee trades employing a grid trading strategy. It strategically places a sequence of pending buy and sell orders at predefined intervals, forming a grid pattern. This EA vigilantly monitors market fluctuations, dynamically adjusting the grid to optimize potential profits. Additionally, it incorporates robust risk management features to control grid size and curtail potential
FREE

AC Pivot Panel
AC Pivot Panel is a pivot point indicator including favorite selection panel accessible in the chart. For pivot traders, It is well convenient to easily and quickly can adjust their pivots setting in the chart. To reaching this goal, a panel has been considered to user can easily switch to each pivot levels by different method and time period. In the current version: All pivots including supports and resistance can be selected to display or disappear in the chart just by
FREE

The ICT Zone Arrow Indicator is an innovative tool developed based on ICT principles. It provides ease and efficiency in identifying key trading areas in the market. Based on the 'killzone' concept, this indicator provides traders with important support and resistance levels by identifying places where large changes in price direction could potentially occur.
The ICT Zone Arrow Indicator provides visual graphical markers that help traders identify trade entry zones with a high probability of
FREE

Mouse You can draw fibonaccis moving the mouse over the zigzag indicator Pin them You can click on fibonacci with this option and it will no longer be deleted unless you click on it again :) Precision The tuned fibonacci gets the precise point in lower timeframes Enjoy it You can ask me for add more features, so please comment and leave your ranting for me to be happy, thank you :)
FREE

GREAR TRADING BOT – это инновационный торговый бот для MetaTrader 5, разработанный для автоматизации стратегий торговли с использованием моделей "Sweep + BOS" и "HTF Sweep + LTF QM". Этот экспертный советник интегрирует расширенные методы анализа рыночных данных, позволяя пользователям выбирать между двумя мощными стратегиями входа. Благодаря гибкости настроек, бот может адаптироваться к различным торговым условиям, проверяя наличие свипов и уровней BOS на различных таймфреймах.
Для стратегии
FREE

Jackson Support and Resistance V it a powerful advance support and resistance indicator which provide signal base on price action, it Design to make things easy for everyone to draw support and resistance. we believe most strategies are built with support and resistance as a foundation .Having support and resistance perfect can be a game change to you way of trading. It flexible to all instrument .don't forget to watch our video on how to us this indicator prefect and progressive.
FREE

This indicator is based on the Parabolic SAR indicator. It helps the user identifying whether to buy or sell. It comes with an alert that will sound whenever a new signal appears. It also features an email facility. Your email address and SMTP Server settings should be specified in the settings window of the "Mailbox" tab in your MetaTrader 5. Blue arrow up = Buy. Red arrow down = Sell. Line = Trailing Stop. You can use one of my Trailing Stop products that automatically move the Stop Loss and i
FREE

MT4 バージョン: https://www.mql5.com/en/market/product/102622 MT5 バージョン: https://www.mql5.com/en/market/product/102624 ライブシグナル: https://www.mql5.com/en/signals/2208634
「Gold Buster」EA のご紹介: 次世代の動的サポート/レジスタンスおよびリスク管理システム
「Gold Buster」EA は、オープン ポジション管理とリスク分析テクノロジーの最新の進歩を活用して、金融市場でサポートとレジスタンス レベルを識別および使用する方法を再定義する、最先端の自動取引システムです。この革新的なエキスパート アドバイザー (EA) は、さまざまな取引プラットフォームや商品でシームレスに動作するように設計されており、安定した利益とリスク軽減を求める初心者と経験豊富なトレーダーの両方のニーズに対応します。
主な機能:
動的なサポートとレジスタンスの識別:
「Gold Buster」EA の核心は、動的なサポートと
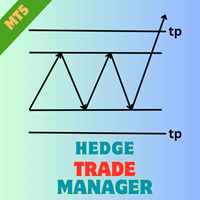
Product Name: Hedge Trade Manager MT5 Description: The "Hedge Trade Manager" EA for MetaTrader 5 is a sophisticated solution designed to adeptly manage trades through a hedge trading strategy. With a range of configurable settings, this EA provides comprehensive control over hedge trades. The documentation below outlines the various inputs and parameters to assist you in customizing the EA to suit your trading preferences. Overall Settings/Input Guide Name Setting Description General Settings Ma
FREE
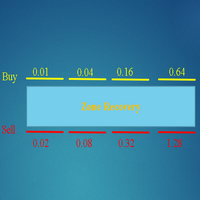
ZoneRecoveryHW MT5
This is High Risk strategy and suggested to set proper parameters.
01. ModeType is StopOrder or LimitOrder
02. Built-in strategy, default is NotUse, so user can manually Click-to-Trade with any Indicators/Signals (Your own strategy).
02a. BreakOut strategy goes with StopOrder
02b. Reversion strategy goes with LimitOrder
03. Multiplier is next order lot sizes, set 2 for BreakOut, 1 for Reversion.
04. RecoveryPoint, example EURUSD sets 200 is acceptable
05. SL USD o
FREE
MetaTraderマーケットは、開発者がトレーディングアプリを販売するシンプルで便利なサイトです。
プロダクトを投稿するのをお手伝いし、マーケットのためにプロダクト記載を準備する方法を説明します。マーケットのすべてのアプリは暗号化によって守られ、購入者のコンピュータでしか動作しません。違法なコピーは不可能です。
取引の機会を逃しています。
- 無料取引アプリ
- 8千を超えるシグナルをコピー
- 金融ニュースで金融マーケットを探索
新規登録
ログイン