YouTubeにあるマーケットチュートリアルビデオをご覧ください
ロボットや指標を購入する
仮想ホスティングで
EAを実行
EAを実行
ロボットや指標を購入前にテストする
マーケットで収入を得る
販売のためにプロダクトをプレゼンテーションする方法
MetaTrader 5のためのエキスパートアドバイザーとインディケータ - 194
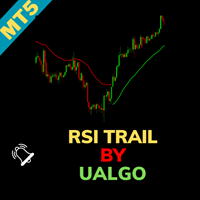
RSI Trail [UAlgo] Indicator for MetaTrader 5 The RSI Trail [UAlgo] indicator is a sophisticated technical analysis tool designed to enhance trading strategies by leveraging the Relative Strength Index (RSI) in conjunction with various moving average calculations. This indicator dynamically plots support and resistance levels based on RSI values, offering clear visual signals for potential bullish and bearish market conditions. Key Features:
Dynamic Support and Resistance Levels: The indicator u

**Compassエキスパートアドバイザー(EA)**は、FXペア、特にEURUSD通貨ペアに特化して設計された強力な取引ツールです。経験豊富なトレーダーでも、初心者でも、このEAは取引体験を向上させるさまざまな機能を提供します。
正確なエントリーポイント: このEAは複数の時間枠にわたる過去のサポートおよびレジスタンスレベルを計算し、最適な取引のエントリーポイントを特定します。
スピードと効率: 効率を追求して構築されており、取引を迅速に実行し、遅延を最小限に抑え、利益のチャンスを最大化します。
データの独立性: 一部のEAとは異なり、このEAは過去のデータや外部サーバーに依存しません。独立して動作し、信頼性が高く堅牢です。
カスタマイズ可能な取引システム: 独自のグリッドライクなシステムにより、取引レベルを制御し、さまざまな市場状況やリスクの好みに適応させることができます。
意欲的なトレーダーの選択: 意欲的なトレーダー向けに設計されており、マーチンゲールやグリッドなどのリスクの高い戦略を避け、確立されたプライスアクションの原則に焦点を当てています。
インジケーター不
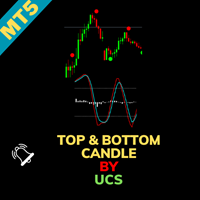
UCS_Top & Bottom Candle Indicator for MetaTrader 5 The UCS_Top & Bottom Candle is an innovative experimental indicator designed for MetaTrader 5. Based on momentum, this indicator identifies the top and bottom candles for most swing movements, assisting traders in making precise market entries and exits. Key Features: Momentum-Based Analysis: Utilizes momentum to detect the top and bottom candles for swing trading opportunities. Customizable Settings: Percent K: Set the Percent K value (default

This Expert Advisor utilizes a Parabolic SAR trading system on lower timeframes to determine entry points and measure the distance for placing pending orders. It also employs Heiken Ashi on higher timeframes to establish the trend direction for placing pending orders. The EA supports both Martingale and non-Martingale strategies. Give it a try with a backtest! . Disclaimer - Do not trade with money you cannot afford to lose: The developer does not constitute an offer or solicitation to trade fu

" Stern " is a cutting-edge Forex trading bot designed for advanced traders. This high-tech tool is an indispensable assistant for anyone who wants to automate their trading processes as much as possible. The bot's algorithm is based on pending orders, which are placed at a certain distance from the current price and are triggered only when the price reaches a specified level. The bot also uses trailing pending orders, which is activated when the price moves. As soon as the order becomes a mark

Welcome to US30 Scalper EA!
Download the Setfile
Please use the setfile when running a backtest/ forward, modelling every tick based on real ticks.
Act fast—just a few copies remain at the current price before it gets to $297!
Check live signals for 4 EAs US30 D1, M1, US500 M2, DE40 M10.
Account Details for Demonstration: To view the trading EAs in action, log in to the following live account. Account Number: 8328683 Password: WM6nCb?6M0+5 Server: EquitiGroupLtd-Live
**

PLEASE CONTACT ME BEFORE PURCHASE FOR DISCOUNT UP TO 50%
BlueMACross EA by BlueTrade The BlueMACross EA is an automated trading tool designed specifically for the USD/JPY currency pair. Developed by BlueTrade, this EA uses a classic Moving Average crossover strategy to spot trade opportunities. When two moving averages cross each other, it signals a potential BUY or SELL, and the EA takes action accordingly. Key Features: Moving Average Crossover Strategy: The EA relies on the crossover of two

The Day Trading Price Patterns Scanner is an EA that searches for all Day Trading Price Patterns on the all pairs and send to your Telegram Channel. Scan all the main Price Patterns are introduced in the Ebook Day Trading With Price Action - Galen Wood You won't never miss any potential trading setup.
[ Demo ] [ Manual ] [ Free Indicator ]
Setup
A step by step user guide is available. No knowledge of Telegram API is required; all you need is provided by the developer.
Free Day Trading

Unleash the Power of Precision and Adaptability in Your Trading Journey! Apex Crossover isn't just another Expert Advisor; it's a meticulously crafted trading engine designed to navigate the complexities of today's markets with unparalleled accuracy and efficiency. By seamlessly integrating advanced technical analysis, intelligent risk management, and adaptive filtering, Apex Crossover empowers you to capitalize on market opportunities with confidence. Key Features: Intelligent Crossover Strateg

このエキスパートアドバイザー(EA)は、3つの連続したロウソク足のパターンに基づいて取引シグナルを決定する「3本ロウソク足トレンド」戦略を使用しています。3本の連続するベアキャンドルが現れると、EAはロングポジションを開き、3本の連続するブルキャンドルが現れると、ショートポジションをトリガーします。EAは、ロットサイズ、スリッページ、ストップロス、テイクプロフィットの事前設定されたパラメーターを使用し、「即時執行またはキャンセル」(IOC)のオーダー執行モードを使用して取引を実行します。 免責事項: このEAは実験的な目的で使用されており、リアルタイム取引には最適化されていません。異なる通貨ペアや時間枠における3本ロウソク足トレンド戦略の効果をテストするために設計されています。このEAを使用した取引には重大なリスクが伴うことをユーザーは認識し、慎重に使用することをお勧めします。個別の取引戦略やリスク管理により適合させるために、追加のインジケーターなど、カスタムコンフルエンスを組み込むために開発者に連絡することを強くお勧めします。 翻訳はChatGPTバージョン4o miniによって提供
Entry Confirmation Indicator for MT5: Precision Trading for Volatility Indices The Entry Confirmation Indicator for MetaTrader 5 (MT5) is a powerful and versatile tool tailored specifically for traders who focus on volatility indices. Whether you're looking to capitalize on trend continuations or identify key reversal points, this indicator is designed to provide clear and actionable signals that enhance your trading strategy. Targeted Instruments: A Focus on Volatility This indicator is optimiz

Este EA Scalping Nipon , trabaja en temporalidad de 1M y 5M. Se puede usar en pares de divisas con JPY, no recomendado para otros activos, ya que su operativa esta basado en JPY. Se recomienda su uso en Bróker con bajo spread. No utiliza ningún sistema Martingala . su lotaje puede ser modificado sin problema. (Lotaje FIJO) Las pruebas realizadas en el video de muestra son con un 1lote por operativa, lo que hace que visualmente sea perfecto. Sin embargo hay muchas variables negativas a considerar

Boom and Crash indices from Deriv are synthetic indices designed to mirror the dynamics of rising and falling real-world financial markets. They specifically simulate the behavior of a market that's either booming or crashing. For traders looking to capitalize on these indices, one of the most effective strategies involves focusing on higher time frames. This is because Boom spikes and Crash drops tend to easily break through support and resistance levels on lower time frames. By placing your e
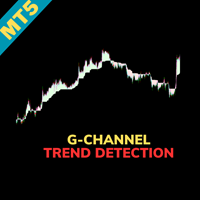
Indicator Name: G-Channel Trend Detection Overview: The G-Channel Trend Detection indicator offers a unique approach to trend analysis, leveraging AlexGrover's G-Channel methodology. This indicator provides a clear and simplified view of market trends by identifying bullish and bearish conditions based on price interactions with the G-Channel boundaries. Key Features: Trend-Based Market Analysis: The indicator determines trend direction by monitoring price action relative to the G-Channel bounda

"PS Celestial Navigator" is a powerful and straightforward Expert Advisor (EA) designed for MetaTrader 5, tailored for both trend-following strategies and professional traders.
This EA operates on a simple yet effective rule: It initiates a Buy trade when the last candle closes above the 9 EMA and a Sell trade when it closes below. Both the EMA value and other key parameters can be easily modified through the user-friendly input settings. One of the standout features of "PS Celestial Navigator"
Subscribe to the MA7 Trading channel to receive notifications about new programs, updates and other information. Ask questions in the profile on the MQL5 .
Description of work The MA7 Moss C2 expert advisor is based on the MA7 Moss indicator. When a signal appears, the expert advisor opens a position, sets a stoploss and takeprofit, and after opening the position, accompanies it until it is closed. After receiving a loss, the expert advisor increases the volume. Detailed information about the

Meet Franklin – Your Ultimate Trading Ally! Step up your trading game with Franklin , the cutting-edge expert advisor that brings innovation and precision right to your trading desk. With its advanced algorithms and state-of-the-art features, Franklin is here to take your trading experience to the next level. Unleash the Power of Precision Franklin is crafted with the perfect blend of technical analysis, artificial intelligence, and machine learning, making it a powerhouse for delivering

CVD SmoothFlow Pro - すべての資産に対応した無制限のボリューム分析! CVD SmoothFlow Pro は、精密で無制限のボリューム分析を求めるトレーダーに最適なソリューションです。Cumulative Volume Delta(CVD)の計算と高度なノイズフィルタリングを使用することで、プロ版はあらゆる金融資産の取引に必要な柔軟性と精度を提供します。 CVD SmoothFlow Pro が提供するもの: クリアな分析 :ノイズをフィルタリングし、すべての金融資産における重要なボリュームの動きを際立たせます。 ️ 正確な計算 :買いと売りの差を監視し、外為、インデックス、暗号通貨などの資産におけるボリュームの詳細な動きを提供します。 直感的なインターフェース :データの表示が明確で、分析がわかりやすく効率的です。 トレンドの特定 :市場のトレンドを自信を持って特定し、情報に基づいた意思決定をサポートします。 実用的な用途: リアルタイムで任意の資産における買い手と売り手のバランスを監視します。 ボリュームに基づいてトレンドの反転

スーパー インジケーターは、初心者および経験豊富なトレーダー向けに調整された包括的な取引ソリューションです。 5つ以上のインジケーターを組み合わせて警告を発します 信号の明瞭さ: 明確な入口と出口の矢印信号を提供します。 リアルタイムアラート: 取引のエントリーおよびエグジットのアラートでトレーダーに最新の情報を提供します。 特徴: 無再塗装 最大アクティベーション数 7 つ以上の戦略 5つのインジケーターがひとつに 入口と出口のポイントと矢印 電話やメールでのアラート 推奨事項: 通貨とペア: EURUSD、AUDUSD、NZDUSD、XAUUSD (金)、BTC、SYNTHETIC: ブーム/暴落/ステップ、ボラティリティ... 期間: 常時 Sūpā injikētā wa, shoshinsha oyobi keiken hōfuna torēdā-muke ni chōsei sa reta hōkatsu-tekina torihiki soryūshondesu. Itsutsu ijō no injikētā o kumiawasete keikoku o hassh

Crash 1000 Scalping Indicator for the Crash 1000 Deriv Synthetic Index. Introduction The Crash 1000 Scalping Indicator is a specialized tool designed for the Crash 1000 index on the Deriv Synthetic market. This indicator is particularly useful for scalping on the M1 timeframe, helping traders to identify precise entry and exit points for buy positions. It is designed to be non-repainting, providing clear signals with audible alerts and push notifications, and is compatible with mobile devices th

Welcome to US500 Scalper EA!
Download the Setfile
Please use the setfile when running a backtest/ forward, modelling every tick based on real ticks.
Heads up—just a few copies remain at the current price before it goes up to $497!
Check live signals for 4 EAs US30 D1, US30 M1, DE40 M10, US500 M2 . *** Purchase US30 D1, or M1 Scalper EA and get DE40 EA for free! ** Contact me in messages, for more details.
Account Details for Demonstration: To view the trading EAs in action, log in t

No Nonsense Signal Sender for MT5: Automate Your Trading Signals with Telegram Integration The "No Nonsense Signal Sender" Expert Advisor (EA) is a powerful tool for MT5 traders, especially those who provide trading signals to their clients. This EA is designed to streamline the process of sending signals, allowing traders to focus on analysis and strategy while automating the distribution of trading information to their followers via Telegram. Key Features: Telegram Integration: The EA seamless

Welcome to DE40 Scalper EA!
Download the Setfile
Please use the setfile when running a backtest/ forward, modelling every tick based on real ticks.
Act fast—just a few copies remain at the current price before it gets to $397!
Check live signals for 4 EAs US30 D1, M1, US500 M2, and DE40 M10.
Account Details for Demonstration: To view the trading EAs in action, log in to the following live account. Account Number: 8328683 Password: WM6nCb?6M0+5 Server: EquitiGroupLtd-Live
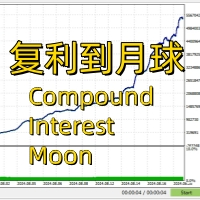
Compound Interest Moon brushing orders! Attention! Attention! Attention!: Low cost and low point platforms are necessary for brushing orders. Please review first and then simulate trading. Do not directly conduct actual trading and test suitable trading varieties A set of arbitrage brushing strategies developed after years of research and development Suggested variety of gold

DYJ SmoothedMA Strategy is a very simple but powerful system to get forex and s ynthetic market trend direction. This indicator is actually a moving average indicator containing 10 smoothing algorithms in a file . The indicator can help you to see the whole trend break out/rebound signal. And these BUY and SELL signals are sent out. You can use DYJ GameDevice follow-up software to receive these signals and realize automatic opening and closing of positions. And can use the game strategy fu

Looking to boost your trading performance on MT5? Introducing the signal indicator that will become your reliable ally on the path to success! This unique indicator utilizes arrows and a color-changing moving average to simplify your trading decisions. When the trend shifts upwards, the indicator turns the line blue, alerting you to potential price increases. If the trend reverses downwards, the line turns red, signaling a potential price drop. Additionally, arrows precisely indicate the optimal

The "Swiss Knife" Expert Advisor is a versatile trading tool that allows the use of various technical indicators, tailored to your specific needs. You can customize and select which indicators will be utilized in trading. The Expert Advisor can operate on any asset, enabling you to choose the best option according to your trading preferences and goals. Available Indicators: SMA (Simple Moving Average) RSI (Relative Strength Index) MACD (Moving Average Convergence Divergence) Bollinger Bands Stoc
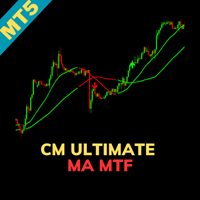
Indicator Name: CM_Ultimate_MA_MTF_V2 - Added Tilson T3 Overview: The CM_Ultimate_MA_MTF_V2 is a powerful moving average indicator that offers a high degree of customization and flexibility for traders. It supports multiple types of moving averages, including the advanced Tilson T3, and provides features such as multi-timeframe analysis, cross detection, and visual highlights. Key Features: Multi-Timeframe Flexibility: The indicator defaults to the current timeframe on the chart but allows users
A correlation trading strategy in the Forex market involves taking advantage of the statistical relationship between two or more currency pairs. The basic premise is that certain currency pairs move in relation to each other due to economic, geopolitical, or market factors. By understanding these relationships, a trader can exploit divergences and convergences to generate profits.
Types of Correlation Here are the three types of correlation that exist in the financial world: Positive Correlatio

Magnus について Magnus は、安定性、カスタマイズ、トレンドベースの取引アプローチを提供するように設計された高度な取引ボットです。このアルゴリズム ロボットの作業は、2023 年 4 月に開始されました。
Magnus の独自の前置詞: テスト中の Expert Advisor 取引は、実際の取引での取引と完全に一致しており、これは非常に重要です。 GBPUSD、GBPJPY、Dax 40 インデックス CFD、および Apple と Nvidia の株式 CFD でうまく機能します。 アカウント サイズが 5,000 米ドル以上の PROP FIRM チャレンジに適しています。ハード バックテストと最適化では、ドローダウンは 8% から 12% の間で変動します。 変化する市場状況への適応性を重視しながら、トレンドベースのアプローチと他の多数の機能 (取引ロジックに組み込まれている) を組み合わせて使用します。 安定性、一貫性、長期的な収益性に関心のある個人、機関投資家に適しています。 初心者とプロのトレーダーの両方に適しています。 投資資本、取引商品

The Spike Forecaster SFD is a system that was developed to catch spikes, it simple to use, its just plug and play.
It will give both Buy Alerts and Sell Alerts through arrows white and red respectively.
The system was designed to make it easier for those traders who might be busy to analyse the market hence it will just give you simple alerts to know the direction of the market. Regards
Spike Forecaster
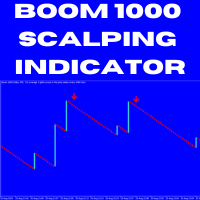
DC Boom 1000 Scalping Strategy Guide **Price**: $30 **Contact**: WhatsApp/Telegram: +27683229304 WhatsApp/Telegram: +27671192993 1. Understanding the Boom 1000 Index Boom 1000 Index: A synthetic index known for generating upward spikes. This strategy focuses on capturing the brief downward movements between spikes by selling when specific signals appear. 2. Timeframe M1 Timeframe: This strategy is exclusively designed for the 1-minute (M1) chart, allowing you to make quick trades and capture sma

你若不试怎知不好!!!
Super Magic For Gbpusd On H4 策略: 1. 在GBPUSD H4图表上进行大趋势交易 2. 在 GBPUSD H4图表进入震荡区间时不下单 3. 在 GBPUSD H4图表方向转换时进行止损,可以看到回测图形中大趋势转换时会出现一定的回撤 4. 每笔订单设置较大级别的止损(600点),避免大区间震荡时打到止损
注意事项: 1. 建议起始资金$1000及以上, 低于1001不会下单 2. ordex_max为最大订单数,默认值为15,可配置; 当前余额如为500可设置为 order_max= 5,余额为15可设置 order_max=15,建议 order_max最大值不要超过50 3. 当余额达到$12000时,订单会在最小下单的基础乘以2; 余额达到$24000时下单手数会乘以4,以此类推

This is a early support and resistance indicator. It will allow you to choose how many candles back. You can use it on all timeframes. Change the color as you like. You can use it with other indicators for better entry prediction it will give you trend for bear market and bull market. It will help you predict sideways market trending market and falling market. Save trading

このエキスパートアドバイザー(EA)は、口座を大幅に増やす可能性があります。わずか7か月で200ドルから1000ドル以上に成長したスクリーンショットをご覧ください。EAは、利益が実現するたびにそれを確保するためにトレーリングストップを使用する場合があります。保守的なアプローチとして、最低開始残高は500ドルが推奨されますが、200ドルでも0.01のロットサイズで動作します。ロットサイズとTP(テイクプロフィット)のレベルは、EAをチャートにアップロードする際に設定/入力で完全にカスタマイズできます。より保守的な方法としては、口座残高が300ドル増えるごとにロットサイズを0.01増やすことです。EAは毎日取引を行わないかもしれませんが、取引を行う前に適切な確認を待ちます。M30ゴールドチャートにEAを設置することで、より良い結果が得られます。EAはモメンタムクロスとブルパワークロスを利用して、ロング/ショートポジションを設定します。 免責事項:外国為替取引には高いリスクが伴い、投資額や預金の大部分またはすべてを失う可能性があることに注意してください。そのため、エキスパートアドバイザーを購

Trade Sniper のご紹介: 市場で優位に立つ。
MT4 バージョン: https://www.mql5.com/en/market/product/122371
収益性の高い取引を逃したり、市場の間違った側に捕まったりすることにうんざりしていませんか? トレンドの力を活用して取引で鋭い優位性をもたらす最先端のインジケーター、Trade Sniper をご紹介します。
Trend Sniper は、ありふれたインジケーターではありません。高度なアルゴリズムと実績のある取引原則を組み合わせた洗練されたツールで、驚異的な精度で高確率の取引機会を見つけることができます。
Trade Sniper が市場での秘密兵器となる理由は次のとおりです:
強化されたトレンド検出: 当社独自の AIgo は、複数の市場要因をリアルタイムで分析し、従来のインジケーターをはるかに超える精度でトレンドを特定します。
非常に明確なシグナル: 混乱を招くチャートの乱雑さに別れを告げましょう。 Trade Sniper は、チャート上で明確で実用的な売買シグナルを提供します。 スマートなリスク管

Developed with a focus on low risk, stable, high consistency and integrity in mind with these characteristics:
No History Reader No Grid or Martingale Surviving 1 more year of backtest, no other EA is able to pass the long period of stress test Breakout at critical levels and no over-trading (opening too many trades) Fixed stop loss Setting for every trade Low Drawdown This gold expert advisor is also prop firm ready beside running on usual live and real personal broker accounts, and it comes wi
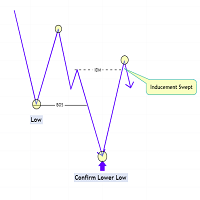
The Market Structure with Inducements & Sweeps indicator is a unique take on Smart Money Concepts related market structure labels that aims to give traders a more precise interpretation considering various factors.
Compared to traditional market structure scripts that include Change of Character (CHoCH) & Break of Structures (BOS) -- this script also includes the detection of Inducements (IDM) & Sweeps which are major components of determining other structures labeled on the chart.
SMC & pri

Warren Buffett famously said: "Be greedy when others are fearful. Be fearful when others are greedy." This expert advisor captures the very essence of this wisdom.
Indeed, since 1871, the U.S. stock index S&P500 has been growing at an average annual rate of 10%. That is why Warren Buffett has been advocating investing in it.
This EA boosts the annual return to 150% (or 8% monthly) by utilizing a grid approach. Simply attach it to the S&P500 chart (or "US500" / "US500Cash" for some brokers) an

注:デフォルトのセットファイルへのリンクについては、コメントセクションの最初のコメントを参照してください(バックテストの際は、「システム設定」を介して「取引シミュレーション= false」を確認してください) MegaTrade Systems は、SMC / ICT取引戦略がロジックを実装する方法が異なる非常にユニークな取引アルゴリズムを利用する次世代のエキスパートアドバイザーである tHE iMBalance を提示します。 このアルゴリズムは、高度な市場スキャン技術を組み合わせて将来の価格変動を予測することにより、定義された取引時間中に最も実行可能な不均衡/ギャップを特定します。 いくつかの手法には、プライスアクションパターン認識、主要な価格レベルの現在の価格との相対性、マルチトレンドの方向性バイアス、流動性のステータス、取引セッション中に発生する大部分の不均衡に合わせる必要があるブレイクアウェイギャップが含まれます。 tHE iMBalance は 、リスクを軽減したり、市場センチメントの突然の変化が検出された場合に取引を早期に終了して時間の経過とともに損失を最小限に抑えるこ

Présentation de notre EA MT5 : Conçu avec des algorithmes avancés et utilisant une technologie d'apprentissage profond, notre Expert Advisor (EA) est conçu pour vous aider dans le monde complexe du trading Forex. Le système analyse les comportements du marché et effectue des transactions en fonction de critères spécifiques, vous permettant ainsi de vous engager plus efficacement dans les tendances du marché. S'appuyant sur près d'une décennie de données, l'EA utilise l'apprentissage profond pou

The Kijun Sen is a component of Ichimoku Kinko Hyo indicator. The Ichimoku Kinko Hyo is a technical analysis indicator that measures the direction, momentum, and strength of trends in the market , effectively helping traders point out trade signals where possible. Its lines also serve as support and resistance lines that give traders further insight into the market dynamics.
PLEASE CONTACT US for any assistance in the comments section. The Entry criteria used ensures that sniper entries are

TRIX EA - MT5
The Expert Advisor was created using the TRIX Indicator. It opens trades by levels and continues to open multiple positions until profit is achieved.
The recommended starting balance is $500 if you choose to trade with 2 to 4 symbols or $1,000 if you choose to trade with 5 to 8 Symbols. Here are the BEST currency pairs with the highest profit and lowest drawdown:
Use the H1 Timeframe on any of these symbols. EURUSD AUDUSD AUDNZD EURCAD USDCHF CADJPY USDCAD CADCHF EURJPY AUDCAD

The Bot Father: Advanced Trading EA for MetaTrader 5 Unlock the power of automated trading with The Bot Father , an advanced Expert Advisor designed for MetaTrader 5. This sophisticated trading bot combines robust functionality with user-friendly features to help you navigate the forex market with confidence. Key Features: Automated Trading : The Bot Father automates your trading strategies, reducing the need for manual intervention. It continuously monitors the market and executes trades based

Joni Lee Second Forex Robot in the Market CAN RUN WITH ONLY $300 (recomended minimum deposit) LOT size 0.01 if <$2000 else 0.02 Introducing the “Joni Lee First Forex Robot,” a trailblazing innovation in automated forex trading. Developed by the renowned Joni Lee, this robot is the first of its kind, setting new standards in the forex market. Key Features: Can take profit (TP) and cut loss (CL) State-of-the-Art Algorithms: Employs sophisticated algorithms to analyze market data and execute tra
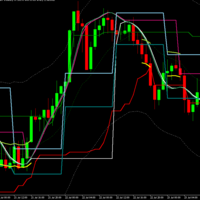
Mega Analyzer MT5 Indicator: A Comprehensive Trading Solution In the dynamic world of trading, having an edge can make all the difference. The "Mega Analyzer MT5 Indicator" offers traders that edge, providing a powerful tool that deciphers market movements with precision and clarity. Designed for both novice and experienced traders, this indicator is tailored to enhance decision-making and optimize trading strategies by revealing key price levels and market conditions that often go unnoticed by

Meet AZ WolfScalper: Your New Forex Scalping Partner Looking for an easy-to-use scalping EA for MetaTrader 5? Check out AZ WolfScalper! It’s designed to trade the best times with simple take profit and stop loss settings on every trade. No risky strategies like martingale or grid—just straightforward, reliable scalping. Why Use AZ WolfScalper? Built-In Risk Management : Each trade has take profit and stop loss to protect your capital while aiming for consistent gains. Customizable Settings : Ad

Want to keep up with the latest trends in developing trading advisors based on fixing prices? Join our channel
Oracle Wave EA is designed to provide high reliability and safety when trading on financial markets. The advisor builds its strategies on the analysis of key price fixing levels set by banks and institutional traders, including significant levels such as Tokyo Fix , London Fix , and Gold Fix . These levels are often critical points where the highest trading volume occurs, an

Panel Anywhere with Server is similar to the free version of Panel Anywhere but includes server files and allows you to edit the host URL. In the free version, the host URL is set to "forex.chjonline.com" and cannot be changed. With this version, you can build a complete client-server system in your local environment without worrying about data being sent elsewhere. Additionally, you’ll experience faster internet response times since you won’t be connecting to a server on the other side of the

Buy Sell Storm
Professional indicator for trading on financial markets, designed for MT5 platform .
Trading on the indicator is very simple, Blue arrow to buy , Red arrow to sell.
The indicator does not redraw and does not change its values.
( see the video of the EA on the indicator).
In the default settings the Period parameter is set to - 1
You can change this parameter for more accurate signals.
If you have any questions, please contact me.
Good luck trading!!!
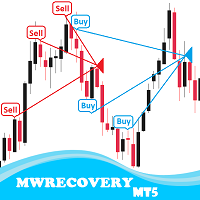
MWRecovery is a system designed to recover unprofitable positions.When the market moves by a certain amount against the direction of a trade and brings it to a loss, the system opens other trades in the same direction at specified intervals. Once these trades reach a certain profit, a magic trailing stop is activated to maximize your profit. How it works : The utility resets StopLoss levels for all processed orders. New trades will be placed if the conditions are met according to what you hav

The main function of this EA: Quick batch modification stop profit stop loss to the specified price position. For example: you have five XAUUSD BUY orders, the opening price is 2510, 2508, 2506, 2504, 2495you can through this EA, batch unified change the profit is 2530, stop loss is 2480.Good luck with your deal! Wechat:FX-AIEA QQ:2813871972 Email:lxy284628@163.com Wechat public account: Xinyou Jinke FXAIEA.com Welcome to your attention ( Xinyou Jinke FXAIEA.com) Around A1, big data, cloud com

Balancer EA is a sophisticated grid trading tool designed to maximize profits by simultaneously opening both buy and sell positions. Or even greater control, you can also utilize the manual panel to fine-tune your trading strategy. However, it is important to use this EA with caution and only risk an amount you are comfortable with. We encourage you to backtest the EA and experiment with the settings to find the ones that work best for you. Recommended symbols : Backtest on any symbol of yo

BuySellClose Hotkeys provides an efficient and rapid way to manage trades with just a single keystroke on your keyboard. This feature allows you to assign specific hotkeys for Buy, Sell, and Close All actions, making your trading experience smoother and faster. Key Benefits: Instant Order Execution: Assign hotkeys to quickly execute buy and sell orders, enabling immediate trade entry without navigating through multiple menus or moving the mouse extensively. Easy Order Closure: Configure a hotke
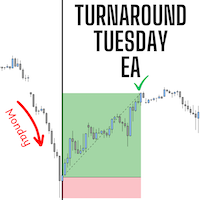
The Turnaround Tuesday bot is based on a time-tested, well-known concept that has consistently proven its robustness over the long term. The strategy is built on a fundamental market principle: fear often creeps into the market after a weekend, when trading has been on pause for two days. This fear, coupled with the potential for significant news events over the weekend, can lead to a sharp gap down when the market opens on Monday. Historically, the market tends to bounce back from this initial

Metatrader5 Trailing Stop Loss Program Platform Compatibility : This program is designed for the MetaTrader 5 platform. Functionality : The program scans all open Forex currency pair trades on MetaTrader 5 and adjusts their STOP LOSSES to a PROFIT position based on your specified input parameters. Parameters and Example : Example Trade : EURUSD Long (BUY) trade @ 1.0800 STOP LOSS (-50 pips) @ 1.0750 TAKE PROFIT (+50 pips) @ 1.0850 Program Settings : WhenToTrail = 20 PIPS (Pips profit amount to

Turbo Close All is a powerful and versatile script designed to help traders quickly and efficiently manage their trading positions and pending orders on MetaTrader 5. With its advanced features and customizable settings, this script is an essential tool for traders who want to streamline their trading process and maintain control over their positions and orders.
Key Features: Comprehensive Closing Options: Turbo Close All allows you to close all market positions and/or delete pending orders bas

ПРИНЦИПЫ DAYREST: с оветник основан на контр-трендовой стратегии Мы используем две особенности: 1. Наличие коррекций в тренде. Как правило, после поступательных импульсов всегда происходит "откат". 2. Цикличность рынка. Цена ходит между историческими максимальными и минимальными значениями. Наибольшая вероятность коррекции фиксируется при достижении ценой границ этого канала. Сигналом для открытия позиции служит пересечение ценой верхней или нижней границы индикаторов Price Channel и EMA. Эт

Dragon's Breath 10th Form は、トレンド トレーディングの完全自動エキスパート アドバイザーです。このエキスパート アドバイザーは注意が必要です。実際、動作頻度が高いです。Dragon's Breath 10th Form は LongCandle と DCA に基づいており、これらの取引はいくつかの戦略で管理できます。エキスパート アドバイザーは、非常に高い勝率の取引を実現できます。アドバイザーをできるだけ簡単にインストールできるようにしたので、完全に最適化されており、チャートにインストールするだけで済みます。
最初のシグナルは、 Dragon's Breath 9th
情報: 動作シンボル EURUSD、EURCAD、AUDCAD、AUDUSD 動作時間枠: H1 最小入金額: 1000 ドル 最小レバレッジ 1:30 優れた ECN ブローカーが必要ですが、必須ではありません インストールは非常に簡単で、設定を変更する必要はありません VPS を使用して EA を 24 時間 365 日実行します 取引システムは完全に自動化されており、安定した利益が

Trendline Wizard Overview: The Trendline Wizard is a powerful and versatile MetaTrader 5 indicator designed for traders who rely on trendlines for their technical analysis. This indicator automatically monitors specified trendlines and provides real-time alerts when price action interacts with these critical levels. Whether you’re a swing trader, day trader, or long-term investor, the Trendline Wizard is an essential tool to enhance your trading strategy. Key Features: Customizable Alerts : Set

Wolf Edge EA は、高度な自動取引ロボットで、3 つの戦略が組み込まれています。実際、これらは 3 つの製品を 1 つにまとめたものです。戦略は、修正されたインジケーター Stochastic、Parabolic SAR、CCI に基づいています。Stochastic の戦略 - 現在の波の完了に向けて取引し、CCI 戦略では同様の戦略が使用されます。Parabolic SAR の動作モードは、インジケーターのシグナルに従ってトレンドの方向に従ってトレンドに作用します。 【リアルトレードモニタリングとその他の動向】 購入後、すぐに連絡して個人ボーナスを受け取りましょう! [設定ファイルおよびその他の有用な情報] 利点: アドバイザーはセットアップも使用も簡単です。 1 人の専門家に 3 つの戦略。 自動ロット計算機能が組み込まれています。 あらゆる取引手段で機能します。 注文の開始と終了に便利なパネル。 ストップロス、テイクプロフィット、トレーリングが組み込まれています。 時間通りに働く可能性。 パラメータ: =一般設定= 購入取引 - 購入注文を有効/無効にします。 売り取

BRIEF INTRODUCTION : This new product is a complete application developed to automate trader trading tasks with a winning trading strategy modern. This new brand product provides two types of functionality such as a manual and a fully automatic trading. Unicorn is adapted with multicurrency. This application utilizes Moving Average indicator as market price trend directional and Stochastic indicator as price Oscillation. Unicorn possesses an automatical Breakeven BE Checker and an automate CRASH

Welcome to Fighter EA: Fighter EA is designed exclusively for trading gold (XAU/USD) with precision and reliability. This expert advisor run on multiple timeframes to capture the best trading opportunities, while maintaining a disciplined approach with defined take profit (TP) and stop loss (SL) levels. Fighter EA is built with a focus onconsistency, stability, and risk management, ensuring that even traders with a litle amount can participate in the gold market then Fighter EA is fully compli
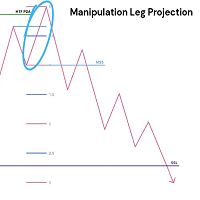
This indicator delves into using standard deviations as a tool in trading, specifically within the Inner Circle Trader (ICT) framework. Standard deviations are a statistical measure that helps traders understand the variability of price movements. These projections is use to forecast potential price targets, identify support and resistance levels, and enhance overall trading strategies. Key Concepts: Understanding Standard Deviations : Standard deviations measure how much a set of values (in thi

概要 ATRマルチレベルおよび移動平均バンドインジケーターは、トレーダーが市場のトレンド、サポートおよびレジスタンスレベル、ボラティリティを特定するのを支援する強力なツールです。このインジケーターは、価格変動の周りにビジュアルバンドを作成するために、複数の移動平均とATR(平均真の範囲)乗数を組み合わせています。これにより、トレーダーは潜在的な反転ポイント、トレンド条件、および市場の統合ゾーンを検出するのに役立ちます。 特徴 複数バンドの視覚化: トレンドを簡単に識別するために、赤、オレンジ、黄色、緑、青、紫などの異なる色で、6つの動的バンドを表示します。 ATRボラティリティバンド: 市場のボラティリティに基づいてバンドのグラフを調整し、反転または価格の継続の可能性について明確な視覚的信号を提供します。 カスタマイズ可能なパラメーター: ATR乗数と移動平均の期間を調整可能で、市場の異なる条件やトレーディング戦略に適応します。 トレンドの明確な識別: バンドはボラティリティに応じて拡張および収縮し、トレーダーがトレンド、統合期間、および潜在的なブレイクポイントを簡単に視認できます。

I am giving the EA/Software for free if you register under my broker.
Broker Here : https://fbs.partners?ibl=684451&ibp=26113188
After you register message me directly on my inbox. Thank You.
Overview: The strategy of the EA combines Fair Value Gaps (FVG) and Support/Resistance levels identified on the H1 timeframe with pending limit orders. The strategy involves setting pending Buy and Sell Limit orders at key levels derived from FVGs and Support/Resistance on H1, with trade confirmation
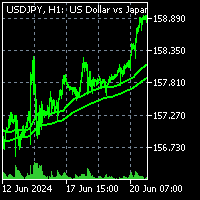
To get access to MT4 version please click here . This is the exact conversion from TradingView: "Liquidity Weighted Moving Averages" by "AlgoAlpha ". This is a light-load processing and non-repaint indicator. All input options are available expect time frame input . Buffers are available for processing in EAs. You can message in private chat for further information/changes you need. Thanks for downloading

*self-introduction
Hey guy's, myname is Hiroaki Mitstuda. I'm one hundred milione trader. and finace wizard class engineer. I was also interviewed as an investor.
https://youtu.be/5Tx9bZrdQtA?si=_JOLnWeBVaDQpTzN
Advisor's advantages: Expert Advisor trades during testing fully correspond to the trades in real trading, which is very important. Does not use parasitic strategies. Suitable for PROP FIRMS ( Works automatically with just one button switch). Suitable for both beginners and prof

This EA is made for BTCUSD on the 5 minute timeframe, with good risk management and a solid strategy i have managed to simplify it all to make using the bot easier. This bot has some optimal setting that i found through back testing although you are free to test it on any chart with any setting. It is intended to be used with the following setting: (Also on XAUUSD) - WRB threshold percentage (10) - ATR period (5) - Stop loss percent (5) - Target percent (1) - Max open trades (5) - Trade session

** VIOP EA-先物およびオプション市場向けの高度な貿易ロボット**
VIOP EAは、ボルサイスタンブール内の先物およびオプション市場(VIOP)向けに特別に設計された貿易ロボットです。このロボットは、プロセス戦略を最適化し、市場のダイナミクスを考慮して、より効果的な貿易体験をユーザーに提供します。 6つの異なるキャンドルフォーメーションが購入戦略として使用されており、ユーザーはそれぞれを個別にアクティブ化できます。したがって、どのフォーメーションを使用するか、投資家が独自の戦略を決定できる柔軟性が提供されます。
ロボットは、処理方法のさまざまなオプションも提供します。 「基本的なMartingale」、「Advance Martingale」、および「通常」は、3つの異なる戦略で動作できます。ユーザーは、自分が望むMartingale戦略を選択したり、両方の方法を無効にして、通常の操作を開くことができます。 Martingaleの方法は、リスク管理と資本管理の点でさまざまな利点を提供するため、ユーザーは自分の投資選好に応じて選択できます。
Metatrader 5プラ
MetaTraderマーケットは自動売買ロボットとテクニカル指標を販売するための最もいい場所です。
魅力的なデザインと説明を備えたMetaTraderプラットフォーム用アプリを開発するだけでいいのです。マーケットでプロダクトをパブリッシュして何百万ものMetaTraderユーザーに提供する方法をご覧ください。
取引の機会を逃しています。
- 無料取引アプリ
- 8千を超えるシグナルをコピー
- 金融ニュースで金融マーケットを探索
新規登録
ログイン