YouTubeにあるマーケットチュートリアルビデオをご覧ください
ロボットや指標を購入する
仮想ホスティングで
EAを実行
EAを実行
ロボットや指標を購入前にテストする
マーケットで収入を得る
販売のためにプロダクトをプレゼンテーションする方法
MetaTrader 5のためのエキスパートアドバイザーとインディケータ - 13

Description :
VWAP (Volume-Weighted Average Price) is the ratio of the value traded to total volume traded over a particular time horizon. It is a measure of the average price at which pair is traded over the trading horizon. Read More.
All Symbols and All Timeframes are supported.
Indicator Inputs :
VWAP Mode : Mode of VWAP Calculation. Options can be selected : Single,Session,Daily,Weekly,Monthly
Volumes : Real Volumes,Tick Volumes
Price Type : Used price for cal

Introducing Scalpie, your ultimate scalping companion in the world of trading. Designed to harness the power of Relative Strength Index (RSI), Scalpie is more than just an expert advisor; it's your strategic ally for navigating the markets with precision and confidence.
Tailored for hedged accounts, Scalpie incorporates sophisticated stop loss and take profit mechanisms to safeguard your investments while maximizing potential gains. Whether you're trading major forex pairs, minor currencies,
FREE

トレンドが勃発しているときにアラートを取得します。 この指標は、価格が支配的な傾向の方向に大きな動きをするときに信号を送ります。 これらの信号は、エントリポイント、またはトレンド内の既存の位置に追加するポイントとして機能することができます。
注:以下の傾向は、低い勝率(50パーセント未満)を持っていますが、平均勝利貿易のリターンは、通常、平均負け貿易よりも3-5倍大きいです。
簡単なセットアップ 任意の時間枠で、任意のグラフにドラッグアンドドロップします。 アラートを有効にする(オプション) そして、あなたは完了です! 視覚的および音声的な警告 お使いの携帯電話に直接送信されるアラート お使いの端末に送信されたアラートをポップアッ マルチユース 株,外国為替,オプション,先物 柔軟性 任意の時間枠で動作します
FREE
ICT Template Indicator visualizes and automatically updates all important ICT elements for Scalpers, Day and Swing traders. It allows you too keep your chart clean and bring any elements by just one click to the buttons. Thanks to mobile notifications on external liquidity levels, you will not miss any opportunity and you don't have to sit behind the screens whole day. Each element has fully customizable colours, width, line types, max timeframe to be shown etc... so you can really tweak your ch
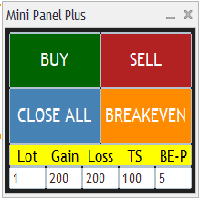
Remodeling the BoletaMiniPanel, the Mini Panel Plus has the same functionalities, but is now in the form of a box that allows it to be minimized and placed anywhere on the chart. Simple Panel with Stop loss (Loss), Stop gain (Gain), Trailing stop (TS) and Breakeven (BE-P). The Lot is the number of contracts to be traded. Gain is the number, in points, at which the stop gain will be positioned. If you don't want to place a stop gain, just put 0 (zero) in its place and when you open the order it w
FREE

Graph configuration and buy and sell signals based on Stormer's (Alexandre Wolwacz, Brazilian trader) swing, position and day trade strategy, described on his youtube channel (https://www.youtube.com/watch?v= 0QZ_NjWkwl0)
The buy and sell indications are based on 2 candle patterns ( Inside Bar [Yellow] and Reversal Closing Price [Blue and Red] ), 3 Moving Averages and 1 Stochastic .
Indicators: Inside Bar - Candle pattern indicating trend continuity, or reversal Reversal Closing Price - Ca
FREE

Supply and Demand indicator does not repaint as it counts the number of tests/retests occurred in the past x number of times. As a trader you need a path to be able to place your buy and sell trades such as: Supply and Demand, Falling & raising channels . Experienced trades will draw the key levels and channels around the timeframes. But, they will not be able to draw them on the small time frames as the price changes too frequent. This indicator is based on Shved supply and demand indicator, b
FREE

A Price Action Trading Expert Advisor (EA) is a type of automated trading system designed to execute trades based on price action patterns and signals. Price action trading focuses on analyzing historical price movements to identify potential future price movements without relying on conventional technical indicators.
Here are key aspects and characteristics of a Price Action Trading Expert Advisor:
1. **Strategy Based on Price Action Patterns**: The EA is programmed to identify and trade b

Line function : Displays the opening line, Stop Loss, Take Profit( 3:1 RR ) on the chart. Risk management : The risk calculation function calculates the volume of a new order taking into account the established risk and the size you want to risk. It allows you to set any Stop Loss size between 3 and 10 pips. Breakeven Button : Brings all open orders to Breakeven. Clear button : Clears the graph and the selected parameters. Trade Button : Execute the idea. Partials Button : Taking partials of al

This is the Cumulative Volume Delta (CVD) , it's an indicator that calculates the long and short volumes plotting it then as a line on the chart, the most efficient way to use this indicator is by comparing the CVD line to the current chart and looking at the Divergence beetween the two of them, so that you can identify fake-outs and liquidty sweeps. for example in the picture that i put below you can see that the price has made a lower low but the CVD didn't, that means the volumes didn't suppo
FREE

The "Trend Fishing Indicator" is a powerful custom indicator designed to help traders identify potential trend reversal points and capitalize on market momentum. This indicator uses multiple moving averages of varying periods to evaluate short-term and long-term market trends. By comparing the short-term moving averages against the long-term ones, it generates clear buy and sell signals that can guide traders in making informed trading decisions. Key Features: Multiple Moving Averages : Incorpor
FREE

The Bheurekso Pattern Indicator for MT5 helps traders automatically identify candlestick pattern that formed on the chart base on some japanese candle pattern and other indicator to improve accurate. This indicator scans all candles, recognizes and then displays any candle patterns formed on the chart. The candle displayed can be Bullish or Bearish Engulfing, Bullish or Bearish Harami, and so on. There are some free version now but almost that is repaint and lack off alert function. With this ve
The Higher timeframe candle tracker is used to get a glimpse of what the selected higher time frame candle is like. It plot the candle after the current price. It can come in handy for day traders and short term traders that often worry about how the current higher timeframe candle may look like. You can select the higher time frame or lower time frame from the options provided: By default the color for bears is red and for bulls is green. You are able to change the width of the candle, its wick
FREE

The "SMC Trading Strategy" or "Smart Money Concept" is a trading strategy that focuses on understanding and following the movements of "large capital" or "Smart Money", which usually refers to institutional investors or major players who can influence the stock or asset markets. This strategy relies on technical and behavioral market analysis to predict market or stock price directions by observing the actions of Smart Money. These investors are believed to have more information, resources, and
FREE

Watermark Centralized
Adds a watermark centered with the asset name and chosen period.
It is possible to override the font type, font size, font color and separator character.
The watermark is positioned behind the candles, not disturbing the visualization.
It has automatic re-centering if the window is resized.
Hope this indicator helps you, good trading ;)
FREE

Full implementation of Directional Movement System for trading, originally developed by Welles Wilder, with modifications to improve profitability, to reduce the number of unfavorable signals, and with Stop Loss lines.
No re-paint
Features
Buy/sell signals displayed on the chart Stop levels visually indicated on the chart Profit-taking points presented in the indicator window Exit points for unfavorable positions presented in the indicator window Signal confirmation through high/low swing c

Tired of plotting trendlines? The PZ TrendLines MT5 indicator applies a mechanical approach to the construction of trend lines for you! [ Installation Guide | Update Guide | Troubleshooting | FAQ | All Products ] It can draw up to 18 trendlines Trendlines can be optionally based on fractals Each line represents a breakout level Each trendline can be broken or rejected Configurable amount of lines Configurable colors Support I am happy to provide free products but given my limited time, they com
FREE

Sessions are very important in trading and often good area where to look for setup. In SMC, ICT we will look for Asian session to serve as liquidity
This indicator displays: High & Low of the Asia session Midnight New York time opening line
Congifuration Line Style, color Label position, size, color Start of the level (Start of the day, Start of the session, Highest or Lowest point in the session)
Any questions or comments, send me a direct message here https://www.mql5.com/en/users/mvonl
FREE

BEHOLD!!!
One of the best Breakout Indicator of all time is here. Multi Breakout Pattern looks at the preceding candles and timeframes to help you recognize the breakouts in real time.
The In-built function of supply and demand can help you evaluate your take profits and Stop losses
SEE THE SCREENSHOTS TO WITNESS SOME OF THE BEST BREAKOUTS
INPUTS
MaxBarsback: The max bars to look back
Slow length 1: Period lookback
Slow length 2: Period lookback
Slow length 3: Period lookbac
FREE

Phantom Force EA for XAUUSD M30 Chart Introducing the Phantom Force EA, a powerful and efficient trading system with a minimum RR of 1:2 with every opened position designed specifically for the XAUUSD on the M30 chart. This expert advisor employs 100 unique strategies simultaneously to identify and exploit trading opportunities, ensuring you never miss a chance to profit from the dynamic gold market. With a 1:2 RR you only need to win 33% of trades to come out breakeven giving you peace of mind
FREE

Golden Lab Expert Advisor 戦略は、Traders Dynamic Index (TDI) 指標に基づいています。 この指標には、RSI (相対力指数) と単純移動平均が含まれます。 * 緑色の線がボトムアップで 50 rsi レベルを超えると、EA は買いです。 * 緑色の線が 50 rsi レベルを上から下に横切ると、EA は売ります。
m15 チャートでデフォルトの EA 設定を使用します。 H1 などの長い時間枠では、より正確なシグナルが得られます。 EA はグリッドとマーチンゲール戦略を使用し、ヘッジできるブローカーを必要とします。
私の信号と他の製品はここにあります
パラメーター: ユーザーが開いた注文を管理する – 真/偽 Max Buys - Trading Advisor が開くことができる買い注文の最大数。 Max Sells - Trading Advisor が開くことができる売り注文の最大数。 コメント - 注文に関するコメント。 ロット - 開始ロット。 動的ロットを使用 - 動的ロットを使用します。 0.01 ロットごと

強力なNRTR(Nick Rypock Trailing Reverse)インディケーターをご紹介します。トレンドの反転を特定し、効果的なトレーリングストップレベルを設定することを目指すトレーダーにとって必須のテクニカルツールです。ニック・ライポックによって開発されたこのインディケーターは、常に変化する市場条件に適応する独自のアルゴリズムを採用しており、どんなトレーダーのツールキットにも欠かせない存在となっています。
以下は、トレーダーがこのインディケーターを使用する人気のある方法です:
1. トレンドの反転:NRTRインディケーターは、トレンドが反転する予兆があるときに明確なシグナルを生成します。インディケーターラインが価格チャートを交差することに注意し、トレンドの方向が変わる可能性を示します。
2. トレーリングストップ:NRTRは、トレンド市場で利益を保護する頼りになるトレーリングストップツールとしても機能します。価格が望む方向に動くと、NRTRラインが価格の下または上に動的に追随し、適応可能なストップロスレベルを提供します。
カスタマイズ可能なパラメータ:NR
FREE

REMINDER: DO NOT USE THE DEFAULT SETTING,PLEASE FOLLOW THE RECOMMENDED PARAMETERS BELOW!!!
SNIPER SACLPER EA - is the ultimate high win rate , the only expert advisor has single entry strategy uses fix and dynamic trail tp & stop loss
- The Backtesing was realistic using high latency and maximum 250 POINTS STOP LOSS to cover market slippage
- It can be tested on multiple time frame from M1 to H1 to see different results but
FREE

The Inside Bar pattern is a very well known candlestick formation used widely by traders all over the world and in any marketplace. This approach is very simple and adds a little confirmation candle, so it adds a third past candlestick to the count to confirm the direction of the move (upward or downward). Obviously, there is no power on this candlestick formation if the trader has no context on what it is happening on the market he/she is operating, so this is not magic, this "radar" is only a
FREE

This indicator finds Double Top and Double bottom Example : What is Double Top When price establishes a new high and then falls, then reverse to the same candle area of High then its considered a valid double top and vice versa for double bottom. 1. It plots and high and low on visible chart if ChartChange is set to true else it searches on new bar opening
2. If there is double top and double bottom found in visible chart window then it plots a line 3. It has options to customize text color, te
FREE

Jackson trendline scanner it a powerful price action tool which draw accurate trendlines and alert a breakout signals . As we all know that trendlines it a most powerful tool in price action by providing us with different chart patterns. e.g. Bullish flag, Pennant, Wedges and more...It not easy to draw trend lines, Most successful traders use trendlines to predict the next move based on chart pattern and breakout. Drawing a wrong trendline it a common problem to everyone, wrong
FREE

For Demo, Competition and Real Account. Valid until 20/12/2025 Combined with artificial intelligence. Build your EA, so you can build your strategy with available indicators and tools. Build EA Simple does not have any set strategy, but with it you can use a combination of indicators and use them as signals or filters and build your strategy!
Indicators available: Price Action Fast Moving Average Slow Moving Average Adaptive Moving Average Triple Exponential Moving Average Relative Strength In
FREE

The indicator displays volume profiles based on the nesting principle. Profiles periods are pre-set so that each subsequent profile has a length twice as long as the length of the previous profile. In addition to profiles, the indicator displays volume clusters sorted by color, depending on the volume they contain.
Indicator operation features The indicator works on typical timeframes from M5 to MN, but for calculations uses historical data from smaller timeframes: M1 - for timeframes from M5
FREE

Indicator Description: MACD EMA Crossover
The MACD EMA Crossover is a powerful MetaTrader 5 (MT5) indicator designed to generate trading signals based on the crossovers between the Moving Average Convergence Divergence (MACD) and the Exponential Moving Average (EMA). This indicator assists traders in identifying opportune buy and sell signals, with a specific focus on trend reversals.
Features:
1. MACD Crossing Below the 0 Line (Buy Signal):
- When the MACD line crosses the signal li
FREE

このエキスパートアドバイザーは、コストのかかるドローダウンを防止したり、取引ルールを遵守したりするために、取引口座のエクイティを常に監視しています。特定のルールセットに違反すると、EAは警告を発し、すべての取引を終了し、場合によっては、保留中のすべての注文を削除します。オプションで、すべてのチャートを閉じて、アカウントで動作しているすべてのEAを削除することもできます。このEAは、FTMOチャレンジやPZチャレンジなどの自己勘定取引チャレンジに特に役立ちます。 [ インストールガイド | アップデートガイド | トラブルシューティング | FAQ | すべての製品 ]
次の機能が実装されており、自由に有効または無効にできます。
エクイティ最大損失、別名トレーリングエクイティドローダウン
毎日のエクイティ最大損失 エクイティ利益目標
エクイティトレーリングストップ
その他の利点は次のとおりです。
使いやすいデッド 自己勘定取引会社やトレーダーに便利
あらゆる種類のアラートを実装します ターミナルに報告する 技術的な案内: それはそれ自身で最大エクイティとデイリーエクイ

The indicator allows you to instantly determine the current trend by color and FIBO levels. Higher Timeframe the panel shows the current trend of higher periods, helping to determine the strength of the trend. Trade according to the trend when changing the color of candles or trade against the trend when the price hit the extreme levels of the FIBO Trend PRO indicator Advantages of the FIBO Trend PRO
Indicator never repaint and does not change their values Very easy to use and intuitive App
FREE

KPL Swing インジケーターは、入出金を自動化する簡単なトrendフォローのメカニカルトレーディングシステムです。システムはハードストップロスとトレーリングストップロスを使用して利益トレードから出金します。ターゲットは与えられず、価格がどこまで(または低い)移動するか誰も知りません。トレーリングストップロスは収益をロックインし、トレードから感情を取り除きます。 Amibroker インジケーターから変換し、修正しました。 KPL Swing インジケーターは、入出金を自動化する簡単なトrendフォローのメカニカルトレーディングシステムです。システムはハードストップロスとトレーリングストップロスを使用して利益トレードから出金します。ターゲットは与えられず、価格がどこまで(または低い)移動するか誰も知りません。トレーリングストップロスは収益をロックインし、トレードから感情を取り除きます。 Amibroker インジケーターから変換し、修正しました。
と組み合わせれば完璧 KPL Chart Uptrend & Downtrend
FREE

The indicator is designed for easy construction of synthetic charts based on data of various financial instruments. It will be useful both arbitrage and pair trading, as well as for analysis purposes. Its main advantage is simplicity and clarity. Each chart is given as a common mathematical formula. For example, if you want to plot the spread (difference) between EURUSD and GBPUSD with coefficients 4 and 3, then set the following formula: EURUSD * 4 - GBPUSD * 3 The resulting chart is shown in t

Synthetic Reverse Bar is an evolution of Reverse Bar indicator. It is well-known that candlestick patterns work best at higher timeframes (H1, H4). However, candlesticks at such timeframes may form differently at different brokers due to dissimilarities in the terminal time on the single symbol, while the history of quotes on M1 and M5 remains the same! As a result, successful patterns are often not formed at higher timeframes! Synthetic Reverse Bar solves that problem! The indicator works on M5

Original supertrend indicator in Tradingview platform. Indicator type: Price Action indicator Introduction: The Supertrend Indicator - Enhancing Your Trend Analysis. If you haven't yet found a Supertrend indicator with good graphics on the MQL5 platform, this is the indicator for you. Overview: The Supertrend Indicator is a powerful tool designed to provide traders with valuable insights into the current and historical trends of financial markets. It serves as a valuable addition to any t
FREE
Master Grid MT5 is a multifunctional grid Expert Advisor designed to fully or partially automate various ideas related to grid trading (on a hedging account ). The Expert Advisor can trade on any timeframe, on any currency pair, on several currency pairs, on any number of signs. It does not interfere with manual trading, trading of other Expert Advisors, or the operation of any indicators.
It allows you to adjust your settings on the fly, works only with your own positions and orders, and f

"The Niffler is a fluffy, black and long-snouted beast. This burrowing creature has a predilection for anything glittery. Nifflers are often kept by goblins to burrow deep into the earth for treasure." Newt Scamander, "Fantastic Beasts and Where to Find Them". Niffler is a multicurrency trend trading Expert Advisor based on moving averages. A classic seasoned with the magic of modern technology. Niffler uses SMA, EMA, LMA, SWMA, HMA, AMA, TMA, EPMA and RMA on the timeframes M15, M20, H1, H3, H6

This indicator is a personal implementation of the famous Traders Dynamic Index, which uses RSI, moving averages and volatility bands to find trends, reversals and price exhaustions. However, this particular implementation supports not only RSI, but many others. It is suitable for scalping, day trading, and swing trading and aims to provide a full picture of the current market conditions. [ Installation Guide | Update Guide | Troubleshooting | FAQ | All Products ]
It is a complex but very use
FREE

Binance Trade Manager — is an utility that allows you to transmit trade orders from your MetaTrader 5 to the Binance exchange. It will suite you if you want to use your favorite MetaTrader 5, getting all the benefits of trading cryptocurrencies directly on the exchange (low commission, high liquidity, absolute transparency, etc.) Binance Trade Manager can work in two modes: copying trades from a demo-account , which your MetaTrader 5 is connected to (cryptocurrencies must be available on this ac
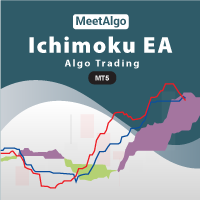
CAP Ichimoku EA MT5 trades using the Ichimoku Kinko Hyo Indicator. It offers many customizable Ichimoku trading scenarios and flexible position management settings, plus many useful features like customizable trading sessions, a martingale and inverse martingale mode. [ Installation Guide | Update Guide | Submit Your Problem | All Products ]
Functions Easy to use and customizable Ichimoku setting. Customizable indicator settings Built-in money management Grid trading when trade in Los
FREE

Что такое Heiken Ashi? Heiken Ashi — это метод построения графиков, который можно использовать для прогнозирования будущего движения цены. Он похож на традиционные свечные графики. Однако в отличие от обычного свечного графика, график Heiken Ashi пытается отфильтровать часть рыночного шума для лучшего определения трендовых движений на рынке. Как рассчитать Heiken Ashi?
Heiken Ashi использует формулу COHL, которая означает «Закрытие, Открытие, Максимум, Минимум». Это четыре компонента, кото
FREE

このダッシュボードは、市場構造反転インジケーターで使用するためのアラートツールです。主な目的は、特定の時間枠での取消の機会と、インジケーターと同様にアラートの再テスト(確認)についてアラートを出すことです。ダッシュボードは、それ自体でチャート上に配置され、バックグラウンドで動作して、選択したペアと時間枠でアラートを送信するように設計されています。多くの人々が1つのMT4の複数のチャートで市場反転インジケーターを実行するのではなく、一度に複数のペアと時間枠を監視するためにダッシュを要求した後に開発されました。 M5、M15、M30、H1、H4、およびD1の時間枠でアラートを出します。もちろん、取引の場合と同様に、より高い時間枠が最も効果的です。 長方形を描画し、特定のペアの市場構造の変化を警告するために作成したインジケーターがダッシュボードを実行します。 ダッシュボードを使用すると、複数のペアと時間枠を監視し、1つのチャートを開いたときにアラートを受け取ることができます。
このダッシュボードは、市場構造反転インジケーターのアドオンとして設計されています。それは独立して機能し、マーケ

This indicator analyzes price action patterns and helps you to make positive equity decisions in the binary options market. [ Installation Guide | Update Guide | Troubleshooting | FAQ | All Products ] Easy to trade Trade both call and put options No crystal ball and no predictions The indicator is non-repainting The only strategy suitable for binary options is applying a mathematical approach, like professional gamblers do. It is based on the following principles: Every binary option represents
FREE

蓮子はタイムレスなチャートです。つまり、期間は考慮されませんが、価格の変化が考慮されるため、チャート上の価格の変化がより明確になります。
ハイパー蓮子はこれを提供する指標です。
設定するには、使用するティックのろうそくのサイズ*のパラメーターを1つだけ使用します。
* tick:アセットの可能な限り小さなバリエーションです。
Hyper Traderインジケーターをお選びいただきありがとうございます。
ウィキペディア: レンコグラフは、変数の値(金融資産の価格など)の経時的な変化が最小限であることを示しています。グラフは、検討中の値(価格など)が特定の最小数量によって変化する場合にのみ時間とともに進みます。たとえば、資産価格のR $ 1の変動を考慮したレンコチャートでは、変動が発生するのにかかった時間と変動に関係なく、その変動が発生した場合にのみ、新しい「レンガ」が描画されます取引されたボリューム。したがって、横軸に時間、縦軸に価格変動をプロットすると、すべての「レンガ」は同じ高さ(同じ価格変動)を持ち、それらの間の間隔は視覚的に同じであるにもかかわらず、時間の変
FREE
CAP Stochastic EA MT5 trades using the Stochastic Indicator. It offers many customizable Stochastic trading scenarios and flexible position management settings, plus many useful features like customizable trading sessions, a martingale and inverse martingale mode. [ Installation Guide | Update Guide | Submit Your Problem | All Products ]
Functions Easy to use and customizable Stochastic setting. Customizable indicator settings Built-in money management Grid trading when trade in Loss C
FREE

VR カラー レベルは、トレンドライン、四角形、テキストなどの要素を使用してテクニカル分析を適用する人にとって便利なツールです。グラフにテキストを直接追加したり、スクリーンショットを撮ったりすることができます。 設定、設定ファイル、デモ版、説明書、問題解決方法は、以下から入手できます。 [ブログ]
レビューを読んだり書いたりすることができます。 [リンク]
のバージョン [MetaTrader 4] インジケーターの操作は ワンクリック で実行できます。これを行うには、線の付いたボタンをクリックすると、カーソルの下に傾向線が表示されます。次に、カーソルを移動して 線の位置 を選択し、もう一度クリックして修正します。 インジケーター の特徴は、スタイルと色のすべての変更が自動的に保存され、その後すべての 新しく作成された グラフィック オブジェクトに適用されることです。 このインジケーターには、異なるスタイルのトレンド ラインを設定するための 2 つの独立したボタン、異なるスタイルの 2 つの独立した四角形、独自のスタイルを持つ 1 つのテキスト フィールド、およびスクリーンショ
FREE

トレーダーとPropFirmsの挑戦者向けのZenith Zone Botをご紹介します。このロボットは、カスタム開発されたテクニカルおよびファンダメンタルインジケーターに基づいたユニークな戦略を採用しており、一年以上にわたる専念した研究と改良を経ています。 Zenith Zone戦略は、以下の4つの包括的なステップで展開されます: 確認済みのサプライとデマンドのレベル:ロボットは確認済みのサプライとデマンドのレベルを計算することから始め、市場での正確なエントリーポイントと出口ポイントを可能にします。 リキディティの吸収:高度なアルゴリズムを活用して、ロボットはトレーディングペアのリキディティの吸収を評価し、トレードの実行を最適化し、スリッページを最小限に抑えます。 デイリーレリティブパフォーマンス:戦略には、トレーディングペアのデイリーレリティブパフォーマンスの堅実な評価が組み込まれており、変動する市場状況に対応した適応的な対応を保証します。 影響力のあるニュース分析:Botはリアルタイムで、トレーディングペアに関連する当日の重要なニュースの影響を評価し、ダイナミックで反応性のある取

** All Symbols x All Timeframes scan just by pressing scanner button ** *** Contact me after the purchase to send you instructions and add you in "M W Scanner group" for sharing or seeing experiences with other users. Introduction: Double Top(M) and Double Bottom(W) is a very repetitive common type of price reversal patterns. Double Top resembles M pattern and indicates bearish reversal whereas Double Bottom resembles W pattern and indicates a bullish reversal that they have high win r

AlgoRex EAは、独自開発された先進的な市場分析システムを搭載しており、FXトレーディングの精度と効率を飛躍的に向上させます。 AlgoRex専用ボラティリティアダプター AlgoRexの独自開発されたボラティリティアダプターは、ATR(平均真の範囲)とRSI(相対力指数)を駆使して、市場の揺れをリアルタイムで精密に分析します。この革新的な機能により、微細な市場の変動にも迅速に対応し、トレンドの変化を即座に捉えることが可能です。トレーダーは、この高度な技術を活用して、市場の動きに合わせた最適なトレーディングチャンスを見極めることができます。トレードのタイミングを科学的に判断し、より確実な取引結果を目指しましょう。 動的取引調整機能 現在の市場環境に基づいて、トレーディング戦略を自動的に調整するAlgoRexの動的取引調整機能は、あらゆる市場状況に最適なトレードを実現します。この機能は、リアルタイムの市場分析を基にして、エントリーとエグジットのポイントを継続的に最適化し、トレーダーにとって最良の取引条件を提供します。市場の予測不可能な変動にも強く、常に一歩先を行く取引をサポートしま
FREE

Using the Stochastic Oscillator with a Moving Average is a simple but very efficient strategy to predict a trend reversal or continuation.
The indicator automatically merges both indicators into one. It also gives you visual and sound alerts.
It is ready to be used with our programmable EA, Sandbox, which you can find below: Our programmable EA: https://www.mql5.com/en/market/product/76714 Enjoy the indicator!
This is a free indicator, but it took hours to develop. If you want to pay me a c
FREE

Do you already know the Start Midas indicator?
What about the Vwap Standard Deviation indicator?
And I need to speak again in the book MIDAS Technical Analysis ...
The Start Midas SD Channel indicator combines the two in one, bringing the practicality and efficiency of Midas with the statistical calculation of the standard deviation.
All of this with the practicality of the White Trader Start indicators, where you can plot the indicator and move them on the screen using keyboard s

A very simple indicator, but one that cannot be missed when carrying out your operations.
Fast and accurate Spreed information before entering a trade as well as the time to start another candlestick.
Spread refers to the difference between the buy (purchase) and sell (offer) price of a stock, bond or currency transaction.
Come and see our mql5 signals too. https://www.mql5.com/pt/signals/899841?source=Site +Signals+From+Author
FREE

Ultimate Pivot Levels indicator for MetaTrader 5 Ultimate_Pivot_Levels is versatile tool designed to enhance your trading experience by accurately plotting pivot levels on your charts. It allows entering your desired values manually or using well known pivot calculation methods to create pivot levels. It draws the levels in the background and allows you to customize levels, size and colors of areas, and it keeps your adjustments while extending the levels to every new bar. Whether you are a novi
FREE

The Pivot Point indicator automatically calculates and displays the pivot point line and support and resistance levels. Pivot can be calculated according to the Classic, Floor, Fibonacci, Woodie, Camarilla or DeMark formula. It is also possible to select the period for calculating the indicator. A trader can choose from daily, weekly, monthly, or user-defined periods.
Types of pivots Classic Floor Fibonacci Woodie Camarilla DeMark
Main features The indicator shows the current and histor
FREE

このプログラムを使用すると、MetaTrader 4 (MT4) と MetaTrader 5 (MT5) の間でトランザクションを任意の方向に簡単にコピーできます。このプログラムは、「Windows PC」および「Windows VPS」で動作するように設計されています。 あらゆる種類のコピーが可能
MT4 - MT4 MT5 - MT5 MT5 - MT4 MT4 - MT5 *The copier works only on forex and only with currency pairs
※MT4~MT5端末間のコピーには、Trade Copier for MT4 + Trade Copier for MT5の2つのバージョンが必要です。
MT4 - https://www.mql5.com/en/market/product/85792
パラメーター:
WORKING_MODE - 動作モード、信号の受信または送信。 FILE_ID - enter the file name identifier, for example 12345;
P

To get access to MT4 version please click here . - This is the exact conversion from TradingView: "Twin Range Filter" by " colinmck ". - This is a light-load processing and non-repaint indicator. - All input options are available. - Buffers are available for processing in EAs. - You can message in private chat for further changes you need. Thanks for downloading

このインジケータは、横ばいを検出し、検出された領域を色の付いた四角形で塗りつぶします。
このインディケータの主なアイデアは、価格がチャート上の特定の領域を埋 めたときにフラットを検出することです。
入力パラメータ
Color rectangle - 影を付ける矩形の色。
Bars in rectangle - 長方形内のバーの最小許容数。
Density in % - 平坦の密度。矩形の面積に対するパーセンテージで設定。 __________________________________________________________________ __________________________________________________________________

This is an advanced multi-timeframe version of the popular Hull Moving Average (HMA) Features Two lines of the Hull indicator of different timeframes on the same chart. The HMA line of the higher timeframe defines the trend, and the HMA line of the current timeframe defines the short-term price movements. A graphical panel with HMA indicator data from all timeframes at the same time . If the HMA switched its direction on any timeframe, the panel displays a question or exclamation mark with a tex

Trading ICT's OTE Concept is simplified with the ICT Optimal Trade Entry Tool. This semi-automatic EA/utility allows trading with manually defined Fibonacci retracement levels. Simply anchor the Fibonacci between swing highs and lows, select your desired entry level in the graphical panel, and the tool automatically opens positions based on your predefined direction. No more waiting in front of charts for price action to reach your entry levels; set the Fibonacci, enable your chosen entry level,

通貨強度メーターは、現在どの通貨が強いか、どの通貨が弱いかをすばやく視覚的にガイドします。 メーターは、すべての外国為替クロスペアの強度を測定し、それらに計算を適用して、個々の通貨の全体的な強度を決定します。 28ペアのトレンドに基づいて通貨の強さに基づいて計算します。
MQL5ブログにアクセスすると、インジケーターの無料バージョンをダウンロードできます。 Metatrader Testerの制限なしで、購入する前に試してみてください: ここをクリック
1.ドキュメント すべてのトレンド通貨強度のドキュメント(手順)と戦略の詳細は、MQL5ブログのこの投稿で入手できます: ここをクリックしてください。
2.お問い合わせ ご不明な点がある場合やサポートが必要な場合は、プライベートメッセージでご連絡ください。
3.作成者 SAYADI ACHREF、フィンテックソフトウェアエンジニア、Finansyaの創設者。

RSI クロスオーバー アラートは、 取引戦略で 相対強度指数 (RSI) を利用するトレーダー向けに特別に設計された強力な通知システムです。このインジケーターは、高速 RSI ラインが低速 RSI ラインの上または下を横切るときに発生する RSI クロスオーバーを特定することに重点を置いています。これらのクロスオーバーを組み合わせることで、インジケーターは効果的に誤ったシグナルを除去し、トレーダーがより正確な取引決定を行えるようにします。 RSI Crossover Alert は、機能性と使いやすさを向上させるいくつかの重要な機能を提供します。これは、あらゆる時間枠および取引シンボルに適用するのに適しており、トレーダーに取引アプローチにおける柔軟性を提供します。この指標にはユーザーフレンドリーなパラメータも備わっており、トレーダーは自分の好みや取引戦略に応じて設定を簡単にカスタマイズできます。さらに、このインジケーターはチャート上に以前のシグナルを描画できるため、トレーダーは過去のクロスオーバー パターンを分析できます。 トレーダーが重要な取引機会を決して逃さないようにするために
!!!ATTENTION TRADERS!!! Bug hunters will get an EA of their choice FOR ABSOLUTELY FREE!!! If you purchase any of my EAs and happen to find a bug, report it to me and I'll gift you one of my EAs here on MQL5 for ZERO dollars, no strings attached! Download the entire trade journal in csv format here → drive.google.com/file/d/12rs2Ymff1Wt2YDgJf1HyLSxQJV1XwfXa/view I recommend you to open it with LibreOffice Calc if Microsoft Excel gives you an error. Description: Regenerat0r is a novel trading rob

需要と供給の取引を自動化します。市場を作る。
このEAは、誰もが販売および模倣する人気のある需要と供給の指標に触発されて作成されました。 EAは取引とヘッジを続け、市場を作ります。非ヘッジ口座でも取引できます。リスクを評価し、時間枠、ロットサイズ、ヘッジ機能を使用する必要があります。一度に複数のペアをオンとオフで合計約1か月間取引しました。
システムの概念:
EAは需要と供給のレベルを交換します。レベルが変わるので、EAは新しいレベルを交換し続けます。より低いロットの多くのペアに分散することは、システムの機能です。安定したゲインを維持しながら、大きなドローダウンを回避する必要があります。 SLは使用できますが、これをオプションにするために説明したヘッジされた側面。私が多くのペアで小ロットで得ているドローダウンは4%であり、これはSLなしです。より大きなロットは6%を示しています。したがって、小さいサイズは控えめで、大きいサイズはより積極的です。これらは、残高と比較して取引されるロットを低く保つ理由です。貿易は発展する余地が必要です。
特徴:
取引数 固定ロット ボ

Cointegration Pair Trading Indicator
Indicator for statistical and quantitative pair trading strategies. You can perform Long&Short or Long&Long/Short&Short between two different assets.
The indicator performs a series of statistical tests between the assets and shows whether the pair is cointegrated or not.
Suggested Usage Strategies
(a) Verify if that the pair is cointegrated by the ADF test (Augmented Dickey-Fuller Test). 0% means the pair is not cointegrated; 90% 95% 97.5% and 99% means

VR Calculate Martingale インジケータは、収益または損失を計算するための注文とポジションの強力な計算ツールです。 注文とポジションの計算ツールを使用して、トレーダーは通貨、株式、通貨の暗号など、あらゆる為替の平均価格を計算できます。 これで、インジケータを接続して、実際の注文と位置に仮想注文を重ねて表示する機能を開始できます。 追加の仮想位置を作成することで、任意のイベントを計算できます。 インジケータには、ロット計算機、ポジション平均化計算機、テイク損益計算機、ストップロスレベル計算機が含まれます。 特別な機能を使用すると、現在の価格のあらゆる方向への移動をシミュレートし、 1 つまたは複数のポジションの利益または損失を計算できます。 購入や販売のポジションはたくさんありますか? VR Calculate Martingale - すべてのポジションをゼロまたは小さな利益でクローズできる平均価格を計算します。 平均価格で注文をグループ化し、 1 つ以上のポジションをクローズするための最も収益性の高いソリューションを見つけることができます。 テクニカルサポート、設

Display Order box list from Trading box Order Management tool. Find contacts and manual links on my profile . This dashboard gives you an edge in forex trading because in few seconds you can decide which pair and timeframe is worth to watch more closely. This is how you will not be distracted by all other forex pairs that you trade, and you will not miss great opportunities to trade the best price.
Trading Dashboard (order box overview panel and Trading box Order management extension) Tr
FREE

Blue Chip Investing を紹介します。これは、努力せずに利益を最大化するために設計された画期的なForexロボットです。ブレイクアウトとボラティリティトレーディングを専門としており、一貫した利益を求めるトレーダーにとって究極のツールです。 最適なパフォーマンスのために、Blue Chip Investingは EURCHF ペアと1時間足( H1 )タイムフレームでのみ運用してください。 主要機能: 先進的なAI技術によって動かされ、Blue Chip Investingはリアルタイムの市場データを分析し、トレンドを特定して正確に結果を予測します。 初心者から経験豊富なトレーダーまで、どのスキルレベルのユーザーでも簡単にナビゲートし、機能を活用できるユーザーフレンドリーなインターフェース。 市場の変化に合わせて学習し、適応することで、継続的に改善しています。 堅牢なリスク管理システムを装備し、各トレードは現在の市場条件に合わせてカスタマイズされたストップロスとテイクプロフィット機能で保護されています。 2010年から2020年までの訓練を受け、その後のライブ結果を提供す
Free TrendLine EA opens trades whenever the price on the chart interacts with or crosses your trend line. You simply draw the trend line manually then let the EA do the trading automatically according to the rules you give it. The settings available in the EA are explained below: Lots : The lot size for trading. RiskPercentage : Set a value other than zero to activate lot sizing by use of percentage of margin. TrendLineName: The name of the line to track. You can either * rename the trend li
FREE

Note : Limited version can trade with the volume less than 0.05 lots.
Important :
This is Arbitrage EA and may not work on all accounts. It is recommended to follow the testing process described on product screenshots. If you are not familiar with arbitrage trading, It is recommended to use our other trading robots .
Strategy :
EA will place trades based on Triangular Arbitrage strategy. Triangular arbitrage (also referred to as cross currency arbitrage or three-point arbitrage) is t

Advanced Indicator Scanner is a multi-symbol multi-timeframe scanner that works with hundreds of custom indicators available across the web including mql5 website market and codebase indicators.
Advanced Indicator Scanner features:
Scans your indicator in 28 customizable instruments and 9 timeframes. Monitors up to 2 lines(buffers) of an indicator. Showing of indicator value on buttons. You can choose between 3 alert modes: Single symbol and timeframe Multiple timeframes of a symbol Multipl
MetaTraderマーケットは、他に類のない自動売買ロボットやテクニカル指標の販売場所です。
MQL5.community ユーザーメモを読んで、取引シグナルのコピー、フリーランサーによるカスタムアプリの開発、支払いシステムを経由した自動支払い、MQL5Cloud Networkなど、当社がトレーダーに対して提供するユニークなサービスについて詳しくご覧ください。
取引の機会を逃しています。
- 無料取引アプリ
- 8千を超えるシグナルをコピー
- 金融ニュースで金融マーケットを探索
新規登録
ログイン